Top-down spatial attention and nociception
Bachelorthesis of
Maria Herzog
Under supervision of
01-02-2008
Abstract
Samenvatting
Table of contents
ABSTRACT...2
SAMENVATTING...3
TABLEOFCONTENTS...4
INTRODUCTION...5
METHODS...6
Participants...6
Stimuli and apparatus...6
General Procedure...7
Data recording...8
Behavioural data analysis...8
EEG data analysis...8
Source analysis...9
RESULTS...10
Behavioural data...10
ERL results...10
ERP results...12
Source analysis...15
DISCUSSION...16
ACKNOWLEDGEMENTS...18
Introduction
There are a lot of people who suffer from chronic pain today. It is a serious disease which can cause other symptoms, such as depression or anxiety (Searle & Bennett, 2008). To improve chronic pain treatment and to get a better understanding of chronic pain, further investigation is needed. Pain is defined as an “unpleasant sensory and emotional experience associated with actual or potential tissue damage, or described in terms of such damage” (IASP, 1994, p.210). Nociception is neural activity due to stimulation of nociceptors, which are the free nerve endings that transfer potentially harmful or damaging stimuli. There are two sorts of nociceptors, Aδ-fibers and C-fibers. Aδ-fibers are fast conductive and sensitive to intense mechanical and thermal stimuli while C-fibers are slow conductive and respond to thermal, mechanical and chemical stimuli. According to these properties, Aδ-fibers correspond to sharp first pains and C-fibers to longer-lasting second pains (Purves, 2007). Pain is a subjective experience and in this study we tried to investigate the influence of top-down spatial attention on pain perception.
A well-accepted assumption is that pain demands attention. The flight reaction which is associated with pain is evolutionary relevant and it depends on several properties of pain stimuli, as intensity, novelty, emotional arousal etc. (Eccleston & Crombez, 1999). When attention is paid to nociceptive stimuli, it is found that the processing of sensory stimuli within the neural network is enhanced and that the synchronization between the two hemispheres is strengthened. This secures an efficient information pathway which can be essential for a suited reaction to potentially harmful stimuli (Hauck et al., 2007).
There are a number of studies that have examined the effect of attention on pain perception. In one such study, participants received strong and weak stimuli on both hands with a frequent and rare probability. Their task was to count the rare stimuli on one hand and to ignore stimuli given to the other hand. The results showed that an attended nociceptive stimulus evokes an increased pain sensation compared to an unattended nociceptive stimulus (Legrain et al., 2002). An implication of this finding is that pain perception can be diminished by distraction.
An electrophysiological response that can be used in these studies, is an event-related potential (ERP) or more precisely a somatosensory event-event-related potential (SEP). An ERP is an electrophysiological response to an internal or external stimulus which is a result of a higher process such as attention (Legrain et al., 2002). An ERP can contain negative (N) and positive (P) components at different times. An SEP is a useful measure for pain perception because it correlates with subjective pain reports after somatosensory stimulation. Particularly the N150-P260 complex elicits higher amplitudes for higher stimulus intensities and attended compared to unattended stimuli (Miltner et al., 1989).
Many brain areas are involved in pain perception, such as the somatosensory cortices SI and SII, which represent information about the strength, location and duration of noxious stimuli (Purves, 2007), the anterior cingulate cortex (ACC) and the insular cortex to name a few. An influence of the ACC is seen in response conflict when attention is reoriented from a distraction task towards pain (Dowman, 2004).
a button with their left hand for a weak stimulus and with their right hand for a strong stimulus and vice versa. 80% of the stimuli were received ipsilateral, which means that the hand receiving the stimulus is also the hand pressing the button and 20% were contralateral. The reaction times were slower in the contralateral condition and when a strong stimulus was received. Furthermore, more errors were made when responding to a strong stimulus. These results suggest that there was an attention shift to the hand receiving the noxious stimulus resulting in a delayed response. This idea is strengthened by a study of Legrain et al. (Legrain et al., 2003). They used a spatial attention task and found that an involuntary orientation of attention occurred towards an unexpected deviant stimulus. This attentional orientation depends also on task difficulty (Legrain et al., 2005), which supports the gate theory of pain, because the theory states that a person has a limited capacity of attention which is distributed by the brain. If a task is executed which demands a lot of attention, less capacity is left for the perception of pain (Melzack & Wall, 1965). These findings suggest that pain perception can be modulated by directing attention away from pain stimuli.
The aim of this study was to investigate the effects of stimulus-location-related attention on the processing of nociceptive stimuli. It was hypothesized that pain perception can be modulated by top-down spatial attention. This attention effect was expected in medial anterior regions of the brain, approximately in the ACC, at around the N150-P260 complex.
Methods
Participants
In total, 16 students (9 male and 7 female) participated in this experiment with a mean age of 20.7±3 years. They were all right handed and had normal or corrected to normal vision. The participation took place within the scope of their study to receive two credits for their subject pool. Written informed consent was signed by everybody and the study was approved by the ethics committee of the faculty of behavioral sciences.
Stimuli and apparatus
an open end of 1mm) , which were placed on the middle of the index finger where the callus was taken away with the aid of a dentists’ trepan.
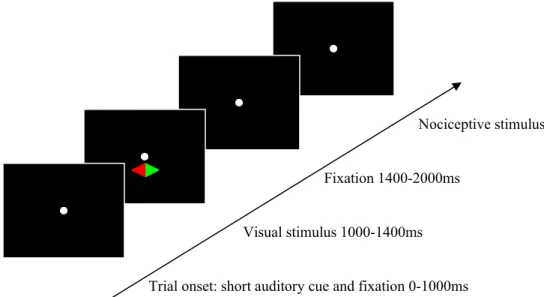
Every trial began with a tone, to indicate that a new trial was starting. Simultaneously, a fixation point appeared on the screen, which stayed there until the end of a trial. After a rest of 1000ms, the diamond showed up for 400ms and was followed by 600ms rest. Then, a pain stimulus was offered on one hand and a foot pedal was used to measure the response of the participants. After an interval between 6-8 seconds the next trial started. Figure 1 shows the scheme of one trial.
Figure 1.An example of a trial. The visual stimulus indicated which side to attend.
General Procedure
The experiment began with a Mood Inventory and continued with the determination of the individual pain threshold by means of the visual analogue scale (VAS). This was done by increasing the given current by 0.08mA per step on a pain scale of 0 (no sensing at all) to 10 (pain tolerance). The pain threshold was set at 7. This procedure was repeated three times per finger before taking the average of the second and third time. After this, 0.2-0.5mA, depending on the pain threshold, was added and subtracted to the just defined pain threshold, to get three different currents on each finger. Now, these three currents were either given in a single stimulus (low intensity) or in a train of five (high intensity). In total, there were six random pain stimuli on each finger, which had to be rated with the VAS by the participant. Next, a background EEG (electroencephalogram) measurement was done to control for anomalies. After this, the actual experiment began. The participants were instructed to pay attention on either the green or the red side of the diamond and to respond to either the low or the high intensity stimuli. For a congruent combination of these two tasks the foot pedal had to be pushed in as response selection. This means that the pain stimulus was received on the hand where the attended side of the diamond pointed at. With these variables, the experiment had a 2x2 design with the response condition “intensity to respond to” as between subject factor. The attention condition “attended side” was the within subject factor, because it varied randomly from trial to trial. In total, one block consisted of 80 trials which were
Trial onset: short auditory cue and fixation 0-1000ms Visual stimulus 1000-1400ms
Fixation 1400-2000ms
counterbalanced. Overall, every combination occurred 20 times. During the second block the “intensity to respond to” stayed the same, but the participants were instructed to attend to the other colour of the diamond. Then, the six pain stimuli were given for rating one more time and at the end of the experiment the Mood Inventory had to be filled in again and a second background EEG measurement was recorded.
Data recording
The EEG of the participants during the two blocks was measured by Brain Vision Recorder (Version 1.03.0002), installed on a Pentium IV computer. 61 channels (Fpz, Fp1, Fp2, AFz, AF3, AF4, AF7, AF8, Fz, F1, F2, F3, F4, F5, F6, F7, F8, FCz, FC1, FC2, FC3, FC4, FC5, FC6, FT7, FT8, Cz, C1, C2, C3, C4, C5, C6, T7, T8, CPz, CP1, CP2, CP3, CP4, CP5, CP6, TP7, TP8, Pz, P1, P2, P3, P4, P5, P6, P7, P8, POz, PO3, PO4, PO7, PO8, Oz, O1 and O2) were used for the EEG recording, which consisted of Ag/AgCl ring electrodes that were connected to a BrainCap (Brain Products GmbH) electrode cap. The ground electrode was placed at the middle of the forehead and all channels were online referenced against the average. The horizontal and vertical electro-oculogram (hEOG and vEOG) were measured by bipolar electrodes from the outer canthi of the eye and from above and below the left eye. The heart rate was detected by a bipolar electrode above and below the clavicle and the electrode resistance was kept below 5 kΩ. All signals passed a QuickAmp amplifier (Brain Products GmbH) and were sampled at a rate of 500Hz. The low cut-off was set off, the notch filter at 50Hz and the high cut-off at 200Hz. LabVIEW and the foot pedal sent digital codes to Vision Recorder to indicate the type of stimuli and the moment of response on the pedal.
Behavioural data analysis
For the analysis of the behavioural data, all hits (correct responses), misses (missed responses), positive rejections (correct no-responses) and false alarms (incorrect responses) were counted for each participant. SPSS (SPSS Inc., version 12.0.1) was used for the descriptive statistics to get the means and the standard deviations, to decide if some participants had to be rejected due to their number of made errors. The used decision interval was set at Mean±2Standarddeviations. An independent t-test was conducted to test for differences between the high and the low response condition. Furthermore, a measure for sensitivity, P(A), of the signal detection theory was computed which determines how easy or hard it is to discriminate a target stimuli from its background events (Kaplan & Saccuzzo, 2004). The used formula is P(A) = {P(H) + [1 -P(FA)]} / 2 with the needed probabilities of the hits (H) and the false alarms (FA).
For the analysis of the VAS, all the stated values were put together and with a one-way ANOVA it was tested if there were differences between theses values before and after the experiment.
EEG data analysis
between stimuli on the right and the left side which were attended or unattended and were of high or low intensity. The first 100ms were used to set a baseline. The artefact rejection, with an interval length of 10ms and lowest allowed amplitude of 0.10μV, was divided into three parts. For the frontal part a minimum of -200μV and a maximum of +200μV was used. These voltages were deviated in two cases due to too much winks. A minimum of -150μV and a maximum of +150μV was used for the central and temporal part of the brain and for the parietal and occipital part a minimum of -100μV and a maximum of +100μV was operated. Furthermore, an ocular correction, type Gratton & Coles (1983), and a baseline correction were conducted. Bad channels were replaced offline by the average of surrounded channels, what happened for three participants each with one electrode.
Based on a grand average, we decided which channels would be used for the statistical analysis. The electric brain activity in time showed that the most pronounced negative activity for the pain stimulus was at about 100ms at the electrode C3 for a stimulus presented at the right hand and at electrode C4 for a pain stimulus at the left hand. At approximately 300ms, FCz showed a distinct positive activity.
Finally, the channels of the right hemisphere of the left attended segments were subtracted from the channels of the left hemisphere of the right attended segments to get an event related lateralization (ERL) (Verleger et al., 2000). With this operation, the sixteen different combinations of “intensity to respond to”, “attended side”, “stimulus intensity” and “hemisphere”, which indicated the side of the received stimulus, were halved to eight, whereby the factor hemisphere was gone. This was done to avoid the measurement of a pure stimulus location related effect.
Next, these amplitude data were exported to SPSS to conduct the statistical analysis. To distinguish the changes of brain activity over time on FCz, C3 and C4, an analysis over time was used. This means that the whole time interval, which covered the first 400ms, was divided into 20 segments of 20ms which were analysed separately. The end point of the analysis was set at 400ms to avoid response related processes. Furthermore, a Bonferroni correction was used and the level of significance was set at α≤.01 to diminish the risk of a type 1 error.
In SPSS a general linear model was applied for the further analysis with “intensity to respond to” as between subject factor and “stimulus intensity” and “attended side” as within subject factor.
Source analysis
Results
Behavioural data
The means and standard deviations for the response selection for the high stimuli were 34.5±5, 5.5±5, 39.0±1 and 1.0±1 for the hits, misses, positive rejections and false alarms respectively and 37.1±3, 2.9±3, 36.0±4 and 4.0±4 for the low stimuli. These values did not result in the rejection of any participant due to the error rate. Furthermore, an independent t-test showed that there is a significant difference between the “high” and the “low” condition with an F(1,14) of 18.3, p≤.001, for the “positive rejection” and “false positive” category. The hit rate for the high stimulus was 82.5% and 76.7% for the low stimulus while the false alarm rate for the high stimulus was 20% and for the low stimulus 13.3%. The computation of the sensibility, P(A), resulted in a P(A, low) of .81 and a P(A, high) of .82. The mean current for the intracutaneous pain stimuli were 1.35mA on the right hand and 1.11mA on the left hand. The one-way ANOVA of the VAS values reached significance for the difference before and after the experiment (F(1,382)=5.568, p≤.019).
ERL results
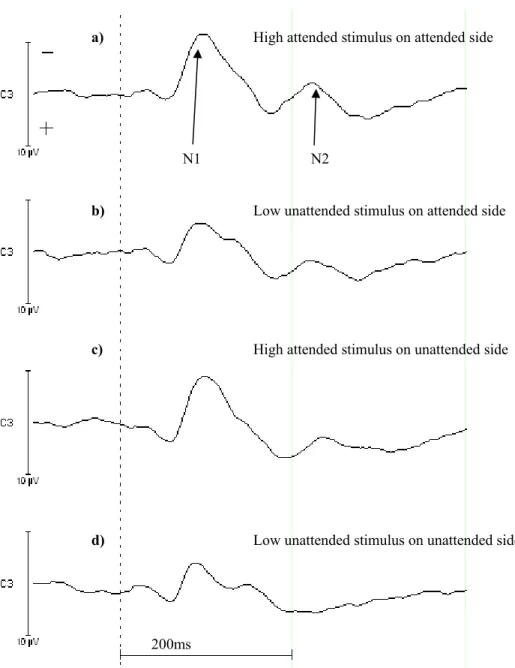
Figure 2. The four waveforms show the EEG on C3 for the high intensity to respond to. a) High stimulus intensity is received on the attended side, b) low stimulus intensity is given to the attended side, c) high stimulus intensity is received on the unattended side and d) low stimulus intensity is received on the unattended side. The arrows point to the N100 and N200 component.
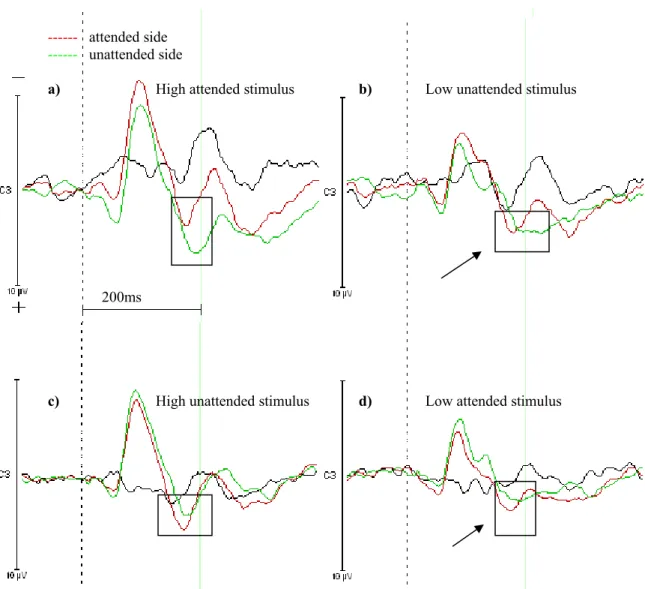
The eight different conditions of the ERLs were put together to grand averages in Vision Analyzer. All the waveforms which corresponded to stimuli given on the unattended side were subtracted from the waveforms corresponding to stimuli received on the attended side. Figure 3 shows these difference waveforms. There are four combinations which are a) responding to high intensity stimuli and receiving high stimulus intensity, b) responding to high intensity stimuli and receiving low stimulus intensity, c) responding to low intensity stimuli and receiving high stimulus intensity and d) responding to low intensity stimuli and receiving low stimulus intensity. The N200 component is marked by a rectangle and the arrows point to the cases, where there is no N200 component at the unattended side. This means that there is an event-related
a) High attended stimulus on attended side
N1 N2
b) Low unattended stimulus on attended side
c) High attended stimulus on unattended side
d) Low unattended stimulus on unattended side
Figure 3. The red waveforms depict the attended side and the green waves the unattended side. The black curve is the difference from the green wave subtracted from the red wave. a) High stimulus intensity was received while responding to high stimuli intensity. b) High stimuli had to be responded to and low stimulus intensity was given. c) High stimulus intensity was received while low stimuli were responded to. d) Low stimuli had to be responded to and low stimulus intensity was given. The rectangles indicate the N200 component and the arrows point to the conditions when there is no N200 component in both waves.
negativity (ERN). This finding is supported by the significant time interval from 200-220ms for “attended side”.
ERP results
The analysis over time of the electrode FCz showed significant results for the intercept during fourteen intervals which were 20-40ms, 80-120ms and 180-400ms (F(1,14)>20.0, p≤.001). The main effect for “attended side” reached significance during the time intervals of 80-100ms, 100-120ms, 200-220ms and 260-400ms (F(1,14)>8.8, p≤.01). “Stimulus intensity” was also a main effect, which showed eight significant results during 20-40ms, 140-160ms and 200-320ms (F(1,14)>16.7, p≤.001). Figure 4 shows the FCz EEG for the high stimulus intensity to respond to. A P100 component can
--- attended side
--- unattended side
a) High attended stimulus b) Low unattended stimulus
200ms
be seen which corresponds to the interval of 80-120ms of “attended side”. The time interval from 140-160ms of “stimulus intensity” is in line with the N150 component and the P250 component contains significant intervals from both “attended side” and “stimulus intensity”.
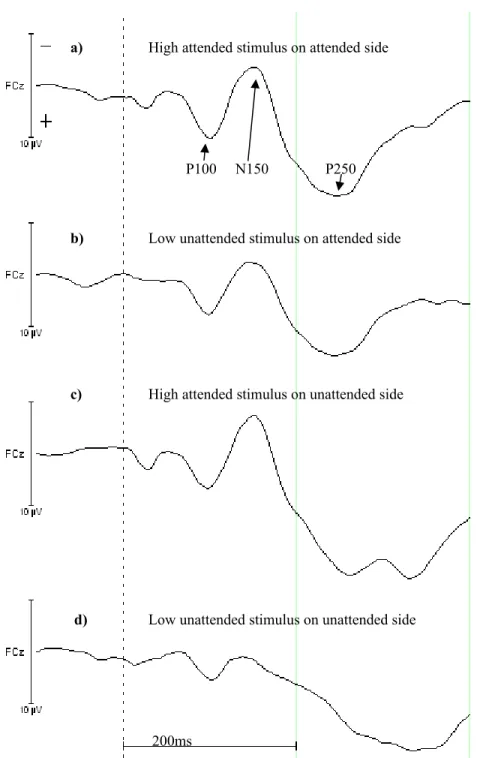
Figure 4. The four waveforms from the FCz electrode show the EEG for the high intensity to respond to. a) High stimulus intensity is received on the attended side, b) low stimulus intensity is received on the attended side, c) high stimulus intensity is received on the unattended side and d) low stimulus intensity is received on the unattended side. The arrows point to the P100, N150 and P250 component.
a) High attended stimulus on attended side
P100 N150 P250
b) Low unattended stimulus on attended side
c) High attended stimulus on unattended side
d) Low unattended stimulus on unattended side
Furthermore, two of the four possible interaction effects reached significance at some times during the whole interval of 400ms. The interaction effect of the factors “stimulus intensity” and “intensity to respond to” showed a significant result in the time interval of 300-320ms (F(1,14)=10.5, p=.006) and the second-order interaction between “attended side”, “stimulus intensity” and “intensity to respond to” reached significance between 380-400ms (F(1,14)=16.1, p=.001).
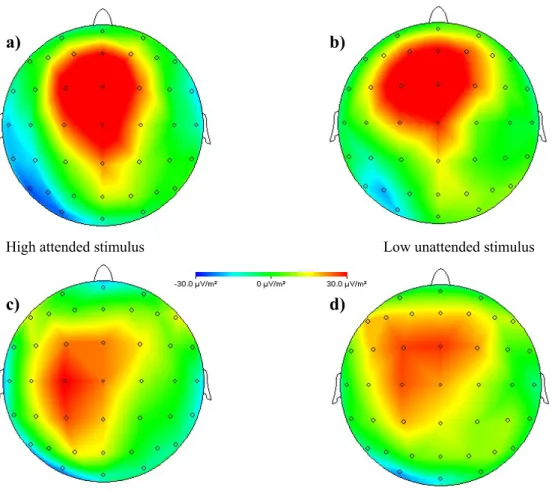
The pictures in figure 5 are current source density (CSD) maps of the grand averages of the different conditions. These were made in Vision Analyzer and they show differences of activity between participants who received a nociceptive stimulus on the unattended side subtracted from the activity of participants who were given a nociceptive stimulus on the attended side. There are four possible combinations due to the different conditions and the given pain stimuli. All these pictures were taken when the differences were at the maximum, which was at about 320ms.
Figure 5. Grand Average CSD maps of the difference in activity for receiving pain stimuli at the unattended side subtracted from receiving pain stimuli at the attended side. a) High stimulus intensity is received when responding to high intensity, b) high intensity has to be responded to and low stimulus intensity is given, c) low stimulus intensity is received when high intensity has to be responded to and d) response is given to low intensity and low stimulus intensity is received. The activity scale goes from -30μV to +30μV.
a) b)
High attended stimulus Low unattended stimulus
c) d)
a
The maps of figure 5 correspond to the interaction effect of “stimulus intensity” and “intensity to respond to”. By comparing figure 5b) and 5c) it is visible that the subtraction of the attended-unattended side is more positive when high intensity had to be responded to than when low intensity was necessary to respond. This does not depend on high or low stimulus intensity.
Source analysis
The results of the conducted source analysis are shown in figure 6. All the sixteen participants were pooled. Furthermore, the three chosen time intervals were depicted in one source location by what the red (a) and the blue (b) symmetric dipoles represent the first time interval of 0-20ms, the green (c) and the purple (d) symmetric dipoles mark the second time interval of 40-120ms and the brown (e) and light blue (f) symmetric dipoles describe the third time interval between 160 and 280ms. The Residual variance is very low with 1.1% and therefore, the dipoles explain the activity quite well.
Figure 6. BESA source analysis for all sixteen participants together. The red (a) and the blue (b) waveforms correspond to the first time interval from 0 to 20ms, the green (c) and the purple (d) waveforms locate the sources between 40-120ms and the brown (e) and the light blue (f) curves show the sources during 160 and 280ms.
1
a)2
b)
c)
d)
e)
f)
a) b)
f) d)
e)
c)
Discussion
In the present study, it was hypothesized that pain perception is modulated by top-down spatial attention during the N150-P260 complex in medio-anterior regions of the brain. The results supported the purposes of this study and demonstrated two more attention effects, at approximately 100ms and 300ms, during the first 400ms after stimulus onset.
The results of the behavioural data indicate that participants paid attention to the task quite well. The t-test resulted in a difference of the positive rejection and the false alarm rates between the two conditions of responding to high and low stimulus intensities. This result suggests that one condition was easier than the other, but the measure of sensibility showed that there were no distinctions between the two conditions. This means that there was no difference in task difficulty. It can be assumed that the result of the t-test refers to something different. The one-way ANOVA of the VAS values showed a habituation effect. The same nociceptive stimuli were felt less painful after the experiment than before the experiment.
The first significant time window for an ERL on electrodes C3-C4 went from 80-120ms and it was associated with “stimulus intensity”. This means that there was more negative brain activity associated with receiving a high intensity stimulus. An N100 component was also observed during this time interval. This effect was independent of “intensity to respond to”. It is suggested that this activity derived from the somatosensory cortices which is supported by the second time interval of the source analysis. This time interval identified a parietal origin near the central sulcus and above the lateral sulcus. At 200-220ms after stimulus onset “attended side” reached significance, indicating that there was an attention effect on brain activity at the lateralized potential of C3-C4. This was followed by a significant interval of “stimulus intensity”. These time windows corresponded to an N200 component which was more negative for high intensity stimuli and absent for low intensity stimuli on the unattended side. These findings are in agreement with a study of Legrain et al. (2002). It can be suggested that there occurs a modulation of pain perception at around this time.
Rainville, 2002). These results confirm our hypothesis that there is a modulation of pain perception in the ACC at around the N150-P260 complex. The interaction effect of “intensity to respond to” and “stimulus intensity” at 300-320ms indicated that brain activity is higher when high stimuli had to be responded to than when attention had to be paid to low stimulus intensities. This effect interacted with stimulus intensity, because high stimulus intensities generated lower brain activity when low intensity stimuli are responded to than when high intensity stimuli are responded to. The same effect was seen for low intensity stimuli, which caused lower brain activity when responded to low stimuli than when responded to high stimuli. The second-order interaction between “attended side”, “stimulus intensity” and “intensity to respond to” reflected an incorporation of all three factors to execute the whole task. It can be observed by comparing all the EEG waveforms with each other, because only the combinations for response selection showed less positivity.
Summarized, it can be said that somatosensory processing could be seen at approximately 100ms after stimulus onset. An N100 component for the ERL on C3-C4 was found with more negativity for high stimulus intensities. At around this time, the ERPs showed an early attention effect. A P100 component was observed with more positive brain activity for the attended side. Another ERP component, N150, could be associated with stimulus intensity with high nociceptive stimuli generating more negativity. At approximately 200ms an attention effect for the ERLs could be seen, together with an effect of stimulus intensity. They corresponded to an N200 component which was absent for low unattended stimuli. At the same time, there was an “attended side” effect in the ERPs. A P250 component was found in the ERPs for “attended side” and “stimulus intensity”. This P250 component was quite similar to the N200 component of the ERLs, because it was also absent for low unattended stimuli and it showed higher activity for high stimulus intensities. It is very likely that this activity derives from the ACC. At approximately 300ms, a late attention effect was found which yields in higher activity when attention had to be paid to high stimulus intensities. Finally, at 400ms an interacting effect of all factors was observed.
Acknowledgements
References
Bromm, B., & Lorenz, J. (1998). Neurophysiological evaluation of pain. Electroencephalography and Clinical Neurophysiology, 107(4), 227-253.
Dowman, R. (2004a). The role of the pain-evoked negative difference potential in dual-task response conflict. European Journal of Pain, 8(6), 567.
Dowman, R. (2004b). Electrophysiological indices of orienting attention toward pain. Psychophysiology, 41(5), 749761.
Dowman, R., Glebus, G., & Shinners, L. (2005). Effects of response conflict on pain-evoked medial prefrontal cortex activity. Psychophysiology, 42(5), 555-558. Eccleston, C., & Crombez, G. (1999). Pain demands attention: A cognitiveaffective
model of the interruptive function of pain. Psychological Bulletin, 125(3), 356. Frishkoff, G. A., Tucker, D. M., Davey, C., & Scherg, M. (2004). Frontal and posterior
sources of event-related potentials in semantic comprehension. Cognitive Brain Research, 20(3), 329.
Hauck, M., Lorenz, J., & Engel, A. K. (2007). Attention to Painful Stimulation Enhances {gamma}-Band Activity and Synchronization in Human Sensorimotor Cortex. J. Neurosci., 27(35), 9270-9277.
Kaplan, R.M. & Saccuzzo, D.P. (2004). Psychological testing: Principles, applications and issues (6th ed.): Wadsworth Publishing.
International Association for the Study of Pain Task Force and Taxonomy (1994). Classification of chronic pain: Pain terms, a current list with definitions and notes on usage (2nd ed.). Seattle: IASP Press.
Legrain, V., Bruyer, R., Guerit, J.-M., & Plaghki, L. (2005). Involuntary orientation of attention to unattended deviant nociceptive stimuli is modulated by concomitant visual task difficulty. Evidence from laser evoked potentials. Clinical Neurophysiology, 116(9), 2165.
Legrain, V., Guerit, J.-M., Bruyer, R., & Plaghki, L. (2002). Attentional modulation of the nociceptive processing into the human brain: selective spatial attention, probability of stimulus occurrence, and target detection effects on laser evoked potentials. Pain, 99(1-2), 21.
Legrain, V., Guerit, J.-M., Bruyer, R., & Plaghki, L. (2003). Electrophysiological correlates of attentional orientation in humans to strong intensity deviant nociceptive stimuli, inside and outside the focus of spatial attention. Neuroscience Letters, 339(2), 107.
Melzack, R. & Wall, P.D. (1965). Pain mechanisms - a new theory. Science, 150(3699), 971-979.
Miltner, W., Johnson, R., Braun, C., & Larbig, W. (1989). Somatosensory event-related potentials to painful and non-painful stimuli: effects of attention. Pain, 38(3), 303. Purves, D. (2007). Neuroscience (4th ed.): Sinauer Associates, Inc.
Rainville, P. (2002). Brain mechanisms of pain affect and pain modulation. Current Opinion in Neurobiology, 12(2), 195.