Linearity in Cell Signaling Pathways
Thesis by
Harry Nunns
In Partial Fulfillment of the Requirements for the Degree of
Doctor of Philosophy
CALIFORNIA INSTITUTE OF TECHNOLOGY Pasadena, California
2019
© 2019
Harry Nunns
ORCID: 0000-0002-9669-0039
ABSTRACT
Accurate cellular communication is of paramount importance for the development,
growth, and maintenance of multi-cellular organisms. Communication between
cells is carried out by a highly conserved set of signaling pathways, whose
dysregu-lation can lead to many diseases. The molecular details of these signaling pathways are now well-characterized, allowing researchers to investigate the emergent
prop-erties that arise from the complex signaling networks. These propprop-erties often arise
from counter-intuitive or paradoxical mechanisms, meaning that systems-level
anal-ysis is necessary. Importantly, mathematical models have been constructed for many
pathways that capture measured reaction rates and protein levels. These
mathemat-ical models successfully recapitulate dynamic responses of each pathway. Here, I
investigated the input-output response of the Wnt, MAPK/ERK, and Tgfβpathways
using analytical and numerical treatment of mathematical models. Using this
ap-proach, I found that the distinct architectures of the three signaling pathways lead to a convergent behavior, linear input-output response. Specifically, mathematical
analysis reveals that a futile cycle in the Wnt pathway, a kinase cascade coupled to
feedback in the ERK pathway, and nucleocytoplasmic shuttling in the Tgfβ
path-ways all yield linear signal transmission. I then verified this finding experimentally
in the Wnt and ERK pathways. For the Wnt pathway, direct measurements of
the input-output response reveal that β-catenin is linear with respect to Wnt co-receptor LRP5/6 activity up until co-receptor saturation. For the ERK pathway, direct
measurements indicate a linear relationship between phosphorylated ERK1/2 and
the concentration of EGF ligand, up until saturation of ERK1/2. Finally, mathe-matical modeling reveals that linear response in the Wnt pathway, in conjunction
with a recently identified cis-regulatory motif, is sufficient to explain gene
expres-sion buffering to perturbations. Therefore, this thesis demonstrates how linearity
emerges across three dissimilar architectures, and introduces a novel benefit for
[1] Kibeom Kim, Jaehyoung Cho, Thomas S Hilzinger, Harry Nunns, Andrew Liu, Bryan E Ryba, and Lea Goentoro. Two-element transcriptional regulation in the canonical wnt pathway. Current Biology, 27(15):2357–2364, 2017. doi: https://doi.org/10.1016/j.molcel.2009.11.018.
H.N. performed the mathematical analysis for the paper.
[2] Harry Nunns and Lea Goentoro. Signaling pathways as linear transmitters. eLife, 7:e33617, 2018. doi: https://doi.org/10.7554/eLife.33617.001.
TABLE OF CONTENTS
Abstract . . . iii
Published Content and Contributions . . . iv
Bibliography . . . iv
Table of Contents . . . v
List of Illustrations . . . vi
Chapter I: Introduction . . . 1
Bibliography . . . 10
Chapter II: Linearity in Cell Signaling Pathways: Analytics . . . 15
2.1 Introduction . . . 15
2.2 Results . . . 17
2.3 Discussion . . . 29
2.4 Supplementary Figures . . . 31
2.5 Supporting Information . . . 34
Bibliography . . . 46
Chapter III: Linearity in Cell Signaling Pathways: Experiments . . . 51
3.1 Introduction . . . 51
3.2 Results . . . 52
3.3 Discussion . . . 58
3.4 Materials and Methods . . . 59
3.5 Supporting Figures . . . 62
Bibliography . . . 73
Chapter IV: Linearity underlies fold-change response in the Wnt pathway . . 75
4.1 Introduction . . . 75
4.2 Results . . . 77
4.3 Materials and Methods . . . 88
4.4 Supporting Figures . . . 89
Bibliography . . . 90
Chapter V: Conclusions . . . 93
Number Page
1.1 Signaling pathway schematic . . . 3
2.1 Architecture of the Wnt, ERK, and Tgfβpathways . . . 16
2.2 Mathematical analysis reveals linear signal transmission in the Wnt pathway . . . 19
2.3 Mathematical analysis reveals linear signal transmission in the ERK pathway . . . 21
2.4 Mathematical analysis reveals linear signal transmission in the Tgf-β pathway . . . 24
2.5 Linear signal transmission occurs over a range of parameter values . . 27
2.6 Simulations demonstrate the requirements for linear signal transmission 29 2.7 Numerical simulation of the input-output relationship of the NF-κB pathway . . . 30
S2.1 Model simulations for the ERK pathway . . . 31
S2.2 Linear signal transmission extends throughout the dynamic range of the ERK and Tgfβpathways . . . 32
S2.3 Model simulations for the Tgfβpathway . . . 33
3.1 Measurements of the input-output relationship in the Wnt pathway . . 54
3.2 Measurements of the input-output relationship in the ERK pathway . 57 S3.1 Standard curves are linear for all Western blot antibodies . . . 62
S3.2 Variation across Western blot technical replicates . . . 63
S3.3 Linearity is not an artifact of loading control normalization . . . 64
S3.4 Linearity was observed across independent experiments . . . 65
S3.5 Timecourse ofβ-catenin accumulation following Wnt stimulation . . 66
S3.6 Wnt dose-response for hospho-LRP5/6 andβ-catenin . . . 67
S3.7 Timecourse of ERK activation following EGF stimulation . . . 68
S3.8 Incorporating into the Wnt model the dual function of GSK3β in phosphorylatingβ-catenin and LRP5/6 . . . 69
S3.9 Single-cell immunofluorescence of ERK response to EGF stimulation 70 S3.10 WT Raf-1 overexpression does not affect linear dose-response . . . . 71
4.1 Two benefits of linearity in cell signaling pathways . . . 76
4.2 Schematic of fold-change response in cell signaling . . . 77 4.3 Linearity produces fold-change response that is robust to parameter
variations . . . 79
4.4 Wnt pathway with IFFL circuit . . . 80
4.5 Endogenous gene expression shows regulation not captured by the
Wnt-responsive element . . . 84
4.6 Model of gene regulation recapitulates experimental data . . . 85
4.7 Theβ-catenin IFFL behaves either as a fold-change detector or am-plitude filter . . . 86
INTRODUCTION
Signaling pathways are critical to metazoan development and maintenance
Development and maintenance of multi-cellular organisms depend on the
coordi-nated growth, movement, and death of large numbers of cells. After fertilization, a
single egg rapidly divides and differentiates into an increasingly complex embryo;
in humans, normal development produces hundreds of cell types and trillions of
cells, each guided to the correct location at the correct time [8, 9]. To achieve this
outcome, cells must communicate with nearby cells (juxtacrine signaling) and over
longer distances (paracrine signaling). This coordination enables the emergence of
many layers of tissue patterning, from precise mosaic patterning between cells to
patterning across an entire embryonic axis [19, 34]. In this way, cellular commu-nication drives the complex body plans of all multi-cellular organisms [39]. After
development, cellular communication is important for organ homeostasis, in
regu-lating cell turnover by controlling growth and death responses, and preventing the
occurrence of cancers and other harmful activities [14]. The remarkably complex
processes of cellular regulation require effective systems for cell-cell
communica-tion.
The intricate process of communication is orchestrated by signaling pathways:
net-works of multiple proteins within the cell that sense, interpret, and transmit signals from outside. Signaling pathways govern an array of cellular responses including
gene transcription and regulation of metabolism and cell-cycle. Signaling pathways
also initiate cell differentiation, pluripotency, proliferation, apoptosis, migration,
adhesion, cytoskeletal reorganization, and polarity[39]. With the wide range of
functions that must be achieved in many dissimilar multi-cellular organisms, it
would not be surprising if hundreds of individualized signaling pathways developed
independently to satisfy a diversity of needs. Yet fewer than 20 classes of
meta-zoan signaling pathways have been identified [19], all of which evolved prior to
the diversification of modern body plans. Of these 20, seven signal pathways are responsible for most developmental processes – the Hedgehog, Wnt, Tgfβ, ERK,
Notch, JAK/STAT, and nuclear hormone pathways [40]. As a result, these signaling
many developmental contexts.
Signaling pathways transmit ligand-receptor action to cellular response
The structure of the seven developmental signaling pathways can be broadly gen-eralized to a few key steps and components. These signaling pathways function
by transmitting some extracellular signal such as an extracellular protein ligand or
chemical into a response within the cell.
This process begins with ligand-specific receptors, which undergo conformational
changes and oligomerization following ligand-recognition [31]. There are often
multiple receptor-ligand pairs that activate each pathway. In general, receptors span
the cell membrane, though some receptors, as in the nuclear hormone receptor
pathways, reside within the cell and respond to membrane-permeable factors. Once bound to ligand, receptors begin a series of biochemical reactions within the cell
[19].
With the exception of the nuclear hormone pathway, ligand-receptor binding is
followed by recruitment of protein factors to the plasma membrane. This recruitment
instigates changes to the state and location of various proteins through sequestration,
nuclear transport, cleavage, chemical modification, and protein binding. Finally, a
transcriptional regulator accumulates in the nucleus. The transcriptional regulator then binds directly to DNA as a transcription factor, or synergizes with another
transcription factor to regulate gene expression [19]. In this thesis, I refer to the
network of protein interactions that transmits signal from ligand-receptor dynamics
into gene transcription as the “core pathway” (Figure 1.1). As the number of ligands
and receptors vary significantly across organisms, this thesis focuses on analysis of
the core pathway.
The complexity of the core pathway varies significantly between pathways. In the
Notch pathway, Notch acts as both the transmembrane receptor and, after being cleaved and imported to the nucleus, as the transcriptional regulator [3]. Similarly,
in the Tgfβand JAK/STAT pathways, the transcriptional regulator (Smad and STAT,
respectively), are activated directly at the receptor and then imported [41, 50]. In
contrast, the ERK pathway transduces signal through a kinase cascade, with several
levels of protein activation separating the receptor from the transcriptional regulator
[32].
While the molecular details of each signaling pathway are well understood, it is still
signaling pathway.
Figure 1.1: (A)Signaling pathways transmit inputs from ligand-receptor interaction to a change in output, the level of transcriptional regulator (white circle).
Input-output response is key to understanding signaling pathway function
Signaling pathways have been well-characterized over the last few decades, and the
molecular interactions that govern each pathway are largely identified. In addition,
quantitative assays of reaction rates and protein levels have enabled the construction
of detailed models that capture pathway dynamics [49]. Consequently, the time is
ripe to study the input-output response of these signaling pathways. The analyses performed in this thesis will focus on the core pathway as defined in Figure 1.1, with
the input as ligand-receptor activation, and the output as the level of transcriptional
regulator. Input-output behavior captures how the output of the core pathway
responds to various inputs, e.g. sinusoidal inputs (for frequency response) or
steady-state inputs (for static response). This allows us to abstract the behavior of a signaling
pathway away from the underlying molecular details [15].
Studying input-output response serves several purposes. First, input-output response
output in faithful representation of the input, signal processing involves the
manip-ulation of the input signal. For instance, signal processing includes amplification, filtering, and applying threshholds to the input signal [44]. Each of these signal
processing capabilities may confer benefits to cell signaling. In the next section, I
examine specific examples of input-output response, the mechanism by which they
arise, and the benefits they may confer.
Second, studying input-output response enables a modular approach to tackling
large networks. Modularity underlies many biological processes, and in particular
enables the study of signaling pathways in isolation from other cellular processes. Once we characterize the input-output response of a pathway, however, we can
examine its behavior within larger inter-connected systems [15]. In Chapter 4, I
utilize this modular approach to examine a transcriptional network downstream of
the Wnt pathway. In this case, the output of the core Wnt pathway connects to the
input of the transcriptional network.
In the past several decades, researchers have studied input-output behavior within
many signaling pathways, uncovering a variety of responses to signal. These include
responses within the receptor module, through the core pathway, and at the gene transcriptional level. Below, I discuss several examples of input-output response
in cell signaling, as well as the mechanisms by which the input-output responses
are generated and the benefits they may confer. These responses include
logarith-mic computation, ultrasensitivity, hysteresis, and non-monotonic response to input.
Notably, all of these responses involve nonlinear processing of input and indicate
that a broad array of signaling strategies are employed in biology. By contrast, in
Chapters 2-3, I demonstrate linear input-output response in three distinct signaling
pathways, suggesting that linearity is a pervasive behavior of cell signaling.
Many nonlinear input-output responses are found in in cell signaling
Logarithmic computations can arise from protein allostery. For an allosteric
pro-tein, the protein’s active site is regulated by a distal effector [36]. Allostery is widespread, appearing in signaling, metabolism, and cell-cycle regulation[10]. The
thermodynamic basis for conformational selection in allosteric proteins can be
cap-tured by the Moneaud-Wyman-Changeaux (MWC) model [36]. In this model, a
protein can switch between two or more states through conformational change. For
protein kinases, this conformation change often occurs at the substrate binding site.
from an active kinase to inactive. In particular, the inactive and active states are in
thermodynamic equilibrium, while chemoattractant binding reinforces the inactive
state. Thus, aspartate can provide conformational selection of CheA, with bound
receptor complex less likely to transition to the active state than unbound receptor
complex [30].
How does the architecture of MWC proteins affect input-output response? The
conformational selection provided by one or more effectors responds nonlinearly, since each effector further decreases the probability of conformational switching.
As shown by Olsman and Goentoro, this architecture is capable of producing
log-arithmic sensitivity to ligand [37]. As a result, the MWC model produces linear
changes in receptor activity in response to logarithmic changes in effector
concen-tration. Interestingly, this relates to Weber’s law of sensory detection that describes
systems that are sensitive to relative changes in signal [37]. Indeed, logarithmic
sens-ing by the allosteric Tar receptor produces Weber’s law detection in the bacterial
chemotaxis network [46].
Cascades of protein kinases, in which each kinase activates a subsequent kinase,
can produce highly ultrasensitive response to input. Ultrasensitivity is defined
by Goldbeter and Koshland as an input-output response that requires less than
an 81-fold increase in input to drive the output from 10% to 90% of maximum
[21]. Generally, an ultrasensitive response is one that is sigmoidal, having an
S-shaped response profile. Sigmoidal response arises through cooperativity in
allosteric proteins, enzyme saturation for two-state kinase/phosphatase substrates,
and multi-site distributive phosphorylation (one site phosphorylated per
enzyme-substrate collision). Protein cascades amplify the sigmoidal response of each layer, producing extremely sharp response to stimulus [26].
Ultrasensitivity was demonstrated for the ERK pathway response to progesterone
inXenopus oocytes [16]. The ERK pathway is activated through a kinase cascade consisting MAPKKK (e.g. Raf-1, B-Raf, Mos), MAPKK (e.g. MEK1, MEK2), and
MAPK (e.g. ERK1, ERK2). Huang and Ferrell demonstrated through modeling
and experiments that that saturation of MEK and ERK phosphatases, combined with
distributive multi-site phosphorylation, produces ultrasensitive response to stimulus
response of the ERK pathway serves two purposes. First, within the responsive
(steep) region of the input-output curve, small changes in signal are amplified to large changes in output. This effect is enhanced by the concentration of each kinase
within the ERK cascade: the first kinase is expressed at nanomolar concentration,
while the latter kinases are expressed at micromolar concentrations, causing a
1000-fold increase in signal amplification [43]. Second, for inputs outside the responsive
region of the input-output curve, ultrasensitivity produces all-or-none response.
Small inputs produce no output, while large inputs produce maximal output, yielding
a sharp, threshhold response to input [16].
Positive feedback, in which system’s output feeds back and reinforces the state of
system, can generate hysteretic response to input [33]. Positive feedback can be
achieved either through a cycle of activation, or a cycle of inactivation
(double-negative feedback). This topology can create a bistable response to input, meaning
that an input can produce two distinct, stable outputs. The output not only depends
on the current input, but the history of the system as well. As a result, if an increase
in input shifts the system from a low-output to high-output state, a similar decrease
in input may not be sufficient to bring the system back to the low-output state. A
much larger decrease in input may be needed to return the system to its original
low-output state. This input lag is referred to as hysteresis, and was first used to describe the behavior of magnetic materials [12].
In the Sonic Hedgehog (Ssh) pathway, there is evidence of hysteretic response to
Ssh ligand. In developing mouse limbs, both current and previous exposure to Ssh
determined digit identity, indicating a history-dependence to Ssh signaling [23].
Similarly, Ssh target genes continue to be expressed even after decrease in ligand
level [6, 27]. Bistability and hysteresis were initially characterized as arising from
a positive feedback from Gli transcription factors activating their own expression. This was thought to reinforce the activity of Gli transcription factors even after
Ssh signaling had been removed. However, further evidence supports a model in
which hysteresis in Ssh signaling arises from the gene regulatory network governing
Ssh target genes, downstream of the Ssh pathway [6, 11]. In this model, there
is mutual repression between genes expressed under high Ssh signaling, such as
Nkx2.2, and genes expressed in the absence of Ssh, such as Pax6. This double-negative produces an effective positive feedback in Ssh target gene expression, and
a hysteretic transcriptional response to Ssh. In this context, bistability can generate
Lastly, the incoherent feed-forward loop (IFFL), a paradoxical system that both
ac-tivates and inhibits its output, can produce non-monotonic response to input [28].
The IFFL is a recurrent motif in cell biology, appearing in signaling pathways,
transcriptional networks, and immune regulation [1]. For instance, in the galactose
system inE. coli, cAMP-responsive CRP has two roles in regulating the transcrip-tion of the galE gene. First, it directly binds to the promoter region and recruits RNA polymerase. Second, it upregulates a repressor galS, which represses the transcription of thegalE gene. Thus, CRP has both a positive and negative effect ongalE transcription. This IFFL architecture can produce numerous input-output responses, depending on parameters and timescales [24].
In the case of the galE transcriptional circuit, Kaplan et al. demonstrated that the IFFL increasesgalEexpression over a range of low cAMP levels, while decreasing galEexpression for higher cAMP levels. This is a type of non-monotonic response, in which the output increases over one interval of input while decreasing over another
interval. In the gal IFFL circuit, non-monotonic response to input is generated by
differential binding to the galE and galS promoters. When cAMP-activated CRP is at low levels, CRP binds strongly to the galE promoter and only weakly to the galS promoter, leading to galE expression. However, higher levels of activated CRP drive binding onto thegalSpromoter, upregulating the repressor ofgalE and decreasinggalE expression. Thus, the IFFL motif can act as a bi-phasic amplitude filter, filtering out low and high inputs and only responding to intermediate cAMP
inputs [28].
Do signaling pathways exhibit linear input-output response?
While nonlinear input-output response is utilized in many signaling contexts, there
is evidence that linear signal transmission may be a widespread behavior of cell
signaling. Linear input-output response entails that each frequency component of
the input signal be faithfully transmitted into output, such that only the amplitude and phase are affected. For static inputs, this means that the output is equal to the
input scaled by some multiple, or gain G. There are several reasons to expect linear
response in cell signaling.
One benefit of linearity is superposition, a technique employed in engineered linear
systems. By definition, a linear system satisfies the properties of homogeneity and
scaled output. Additivity is satisfied if the output for two combined inputs is the
summed output for the two inputs alone. Therefore, a linear system can transmit multiple signals simultaneously without distortion, a property referred to as
super-position [44]. Supersuper-position is what enables a car radio to tune to a single radio
station, and for many houses to share the same telephone line. By the same merits
we find for linearity in engineered systems, we might expect to find linearity in
biological systems as well. I propose that linearity could increase the number of
signaling events transmitted through the limited set of pathways in cells. Multiple
ligand-receptor complexes often feed into one pathway (e.g. all growth factors into
the ERK pathway [29]), and so superposition could allow several ligands to activate
the pathway at once, with gene regulatory networks then deconvolving the pathway output into the response from each ligand alone.
Second, input-output linearity increases the information capacity of a signaling
path-way as compared to nonlinear input-output responses [51]. Noise is an inescapable
aspect of signal transmission and limits the number of inputs that can be
distin-guished by measuring output. For nonlinear input-output responses, the pathway
compresses inputs where the response slope is shallow and amplifies noise when the
response slope is steep, further reducing the number of distinguishable inputs. In
contrast, information loss due to noise is minimized for linear input-output response, maximizing the number of distinguishable inputs. In this context, linearity is also
referred to as “dose response alignment,” meaning that the dose response curves of
bound receptor and downstream output are aligned [51].
Dose response alignment was observed in several hormone signaling pathways
[2, 13], though the mechanisms for dose-alignment are unknown. Dose response
alignment was observed for the MAPK Fus3 in the yeast pheromone response system
as well, using a feedback mechanism not conserved in metazoan MAPK/ERK signal-ing [4, 51]. There is also evidence of linearity between ligand and the time-integrated
activity of the epidermal growth factor and erythropoietin receptor modules [7, 38].
Motivated by this, I studied multiple metazoan signaling pathways to determine
whether linearity is a more widespread strategy of cell signaling. Specifically, I
chose the Wnt, ERK and Tgfβ pathways for two reasons: one, these signaling
pathways represent three of the seven classes of early developmental signaling
pathways, and two, their core pathways are characterized by detailed mathematical
Western blots.
In Chapter 2, I demonstrate that despite the distinct architectures of the Wnt, ERK,
and Tgfβpathways, these three highly-conserved developmental signaling pathways
operate using linear signal transmission. I show that linearity arises in the Wnt
pathway due to a futile cycle ofβ-catenin synthesis and degradation, a kinase cascade coupled to negative feedback in the ERK pathway, and rapid nucleocytoplasmic
shutting of Smad complex in the Tgfβ pathway. In Chapter 3, I validate these findings with direct measurements of input-output response in the Wnt and ERK
pathway using quantitative Western blot. In the Wnt pathway, experiments indicate
thatβ-catenin accumulates linearly with active Wnt co-receptor LRP and that this linearity persists throughout the dynamic range of LRP activation. In the ERK
pathway, experiments indicate that doubly-phosphorylated ERK increases linearly
with EGF dose, until saturation of doubly-phosphorylated ERK. I also demonstrate
that specific perturbations can reduce the range of linear response of each pathway.
Finally, in Chapter 4, I explore an additional benefit of linearity in the context of
the Wnt pathway. Modeling the Wnt pathway, I find that linearity produces robust
fold-changes inβ-catenin with respect to parameter variations. Therefore, this thesis demonstrates that linearity is a widespread property of cell signaling, and introduces
BIBLIOGRAPHY
[1] Uri Alon. An introduction to systems biology: design principles of biological circuits. CRC press, 2006. ISBN 1584886420.
[2] Syed M Amir, Terry F Carraway, Leonard D Kohn, and Roger J Winand. The binding of thyrotropin to isolated bovine thyroid plasma membranes. Journal of Biological Chemistry, 248(11):4092–4100, 1973.
[3] Emma R Andersson, Rickard Sandberg, and Urban Lendahl. Notch signaling: simplicity in design, versatility in function.Development, 138(17):3593–3612, 2011.
[4] Steven S. Andrews, William J. Peria, C. Yu Richard, Alejandro Colman-Lerner, and Roger Brent. Push-pull and feedback mechanisms can align signaling system outputs with inputs. Cell systems, 3(5):444–455. e2, 2016. ISSN 2405-4712.
[5] Geoffroy Andrieux, Laurent Fattet, Michel Le Borgne, Ruth Rimokh, and Nathalie Théret. Dynamic regulation of tgf-b signaling by tif1γ: a computa-tional approach. PloS one, 7(3):e33761, 2012. ISSN 1932-6203.
[6] Nikolaos Balaskas, Ana Ribeiro, Jasmina Panovska, Eric Dessaud, Noriaki Sasai, Karen M Page, James Briscoe, and Vanessa Ribes. Gene regulatory logic for reading the sonic hedgehog signaling gradient in the vertebrate neural tube. Cell, 148(1):273–284, 2012.
[7] Verena Becker, Marcel Schilling, Julie Bachmann, Ute Baumann, Andreas Raue, Thomas Maiwald, Jens Timmer, and Ursula Klingmüller. Covering a broad dynamic range: information processing at the erythropoietin receptor. Science, 328(5984):1404–1408, 2010. ISSN 0036-8075.
[8] Eva Bianconi, Allison Piovesan, Federica Facchin, Alina Beraudi, Raffaella Casadei, Flavia Frabetti, Lorenza Vitale, Maria Chiara Pelleri, Simone Tassani, Francesco Piva, et al. An estimation of the number of cells in the human body. Annals of human biology, 40(6):463–471, 2013.
[9] Sean B Carroll. Chance and necessity: the evolution of morphological com-plexity and diversity. Nature, 409(6823):1102, 2001.
[10] Jean-Pierre Changeux. Allostery and the monod-wyman-changeux model after 50 years. Annual review of biophysics, 41:103–133, 2012.
to ‘transcriptional interpretation of shh morphogen signaling: computational modeling validates empirically established models’. Development, 143(10): 1640–1643, 2016.
[13] Pedro Cuatrecasas. Insulin-receptor interactions in adipose tissue cells: di-rect measurement and properties. Proceedings of the National Academy of Sciences, 68(6):1264–1268, 1971.
[14] Klaus-Michael Debatin. Apoptosis pathways in cancer and cancer therapy. Cancer Immunology, Immunotherapy, 53(3):153–159, 2004.
[15] Domitilla Del Vecchio and Richard M Murray.Biomolecular feedback systems. Princeton University Press Princeton, NJ, 2015.
[16] James E. Ferrell and Eric M. Machleder. The biochemical basis of an all-or-none cell fate switch in xenopus oocytes. Science, 280(5365):895–898, 1998. ISSN 0036-8075.
[17] Christopher L. Frick, Clare Yarka, Harry Nunns, and Lea Goentoro. Sensing relative signal in the tgf-β/smad pathway.Proceedings of the National Academy of Sciences, page 201611428, 2017. ISSN 0027-8424.
[18] Raphaela Fritsche-Guenther, Franziska Witzel, Anja Sieber, Ricarda Herr, Nadine Schmidt, Sandra Braun, Tilman Brummer, Christine Sers, and Nils Blüthgen. Strong negative feedback from erk to raf confers robustness to mapk signalling. Molecular systems biology, 7(1):489, 2011. ISSN 1744-4292. [19] John Gerhart. 1998 warkany lecture: signaling pathways in development.
Teratology, 60(4):226–239, 1999. ISSN 0040-3709.
[20] Lea Goentoro and Marc W. Kirschner. Evidence that fold-change, and not absolute level, of β-catenin dictates wnt signaling. Molecular cell, 36(5): 872–884, 2009. ISSN 1097-2765.
[21] Albert Goldbeter and Daniel E Koshland. An amplified sensitivity arising from covalent modification in biological systems.Proceedings of the National Academy of Sciences, 78(11):6840–6844, 1981.
[22] Vinicio González-Pérez, Bernhard Schmierer, Caroline S. Hill, and Richard P. Sear. Studying smad2 intranuclear diffusion dynamics by mathematical mod-elling of frap experiments. Integrative Biology, 3(3):197–207, 2011.
[24] Yuval Hart and Uri Alon. The utility of paradoxical components in biological circuits. Molecular cell, 49(2):213–221, 2013.
[25] Ana R. Hernández, Allon M. Klein, and Marc W. Kirschner. Kinetic responses ofβ-catenin specify the sites of wnt control. Science, 338(6112):1337–1340, 2012. ISSN 0036-8075.
[26] Chi-Ying Huang and James E. Ferrell. Ultrasensitivity in the mitogen-activated protein kinase cascade. Proceedings of the National Academy of Sciences, 93 (19):10078–10083, 1996. ISSN 0027-8424.
[27] Jan Philipp Junker, Kevin A Peterson, Yuichi Nishi, Junhao Mao, Andrew P McMahon, and Alexander van Oudenaarden. A predictive model of bifunc-tional transcription factor signaling during embryonic tissue patterning. De-velopmental cell, 31(4):448–460, 2014.
[28] Shai Kaplan, Anat Bren, Erez Dekel, and Uri Alon. The incoherent feed-forward loop can generate non-monotonic input functions for genes.Molecular systems biology, 4(1):203, 2008.
[29] Menachem Katz, Ido Amit, and Yosef Yarden. Regulation of mapks by growth factors and receptor tyrosine kinases. Biochimica et Biophysica Acta (BBA)-Molecular Cell Research, 1773(8):1161–1176, 2007.
[30] Juan E Keymer, Robert G Endres, Monica Skoge, Yigal Meir, and Ned S Wingreen. Chemosensing in escherichia coli: two regimes of two-state recep-tors. Proceedings of the National Academy of Sciences, 103(6):1786–1791, 2006.
[31] Edda Klipp and Wolfram Liebermeister. Mathematical modeling of intracel-lular signaling pathways. BMC neuroscience, 7(1):S10, 2006.
[32] Walter Kolch. Coordinating erk/mapk signalling through scaffolds and in-hibitors. Nature reviews Molecular cell biology, 6(11):827–837, 2005. ISSN 1471-0072.
[33] Karen Lai, Matthew J Robertson, and David V Schaffer. The sonic hedgehog signaling system as a bistable genetic switch. Biophysical Journal, 86(5): 2748–2757, 2004.
[34] Pamela J Lanford, Yu Lan, Rulang Jiang, Claire Lindsell, Gerry Weinmaster, Thomas Gridley, and Matthew W Kelley. Notch signalling pathway mediates hair cell development in mammalian cochlea. Nature genetics, 21(3):289, 1999.
[37] Noah Olsman and Lea Goentoro. Allosteric proteins as logarithmic sensors. Proceedings of the National Academy of Sciences, 113(30):E4423–E4430, 2016. ISSN 0027-8424.
[38] Diego A. Oyarzún, Jo L. Bramhall, Fernando López-Caamal, Frances M. Richards, Duncan I. Jodrell, and Ben-Fillippo Krippendorff. The egfr demon-strates linear signal transmission. Integrative Biology, 6(8):736–742, 2014. [39] Norbert Perrimon, Chrysoula Pitsouli, and Ben-Zion Shilo. Signaling
mech-anisms controlling cell fate and embryonic patterning. Cold Spring Harbor perspectives in biology, 4(8):a005975, 2012.
[40] André Pires-daSilva and Ralf J. Sommer. The evolution of signalling pathways in animal development. Nature Reviews Genetics, 4(1):39–49, 2003. ISSN 1471-0056.
[41] Jason S Rawlings, Kristin M Rosler, and Douglas A Harrison. The jak/stat signaling pathway. Journal of cell science, 117(8):1281–1283, 2004.
[42] Bernhard Schmierer, Alexander L. Tournier, Paul A. Bates, and Caroline S. Hill. Mathematical modeling identifies smad nucleocytoplasmic shuttling as a dynamic signal-interpreting system. Proceedings of the National Academy of Sciences, 105(18):6608–6613, 2008. ISSN 0027-8424.
[43] Birgit Schoeberl, Claudia Eichler-Jonsson, Ernst Dieter Gilles, and Gertraud Müller. Computational modeling of the dynamics of the map kinase cascade activated by surface and internalized egf receptors. Nature biotechnology, 20 (4):370–375, 2002. ISSN 1087-0156.
[44] Steven Smith. Digital signal processing: a practical guide for engineers and scientists. Elsevier, 2013.
[45] O. E. Sturm, R. Orton, J. Grindlay, M. Birtwistle, V. Vyshemirsky, D. Gilbert, M. Calder, A. Pitt, B. Kholodenko, and W. Kolch. The mammalian mapk/erk pathway exhibits properties of a negative feedback amplifier.Science signaling, 3(153):ra90, 2010. ISSN 1937-9145.
[46] Yuhai Tu, Thomas S Shimizu, and Howard C Berg. Modeling the chemotac-tic response of escherichia coli to time-varying stimuli. Proceedings of the National Academy of Sciences, 105(39):14855–14860, 2008.
[48] Junjie Wang, Lisa Tucker-Kellogg, Inn Chuan Ng, Ruirui Jia, P. S. Thiagarajan, Jacob K. White, and Hanry Yu. The self-limiting dynamics of tgf-βsignaling in silico and in vitro, with negative feedback through ppm1a upregulation. PLoS computational biology, 10(6):e1003573, 2014. ISSN 1553-7358. [49] Joseph A Wayman and Jeffrey D Varner. Biological systems modeling of
metabolic and signaling networks.Current Opinion in Chemical Engineering, 2(4):365–372, 2013.
[50] Mary Y. Wu and Caroline S. Hill. Tgf-βsuperfamily signaling in embryonic development and homeostasis. Developmental cell, 16(3):329–343, 2009. ISSN 1534-5807.
LINEARITY IN CELL SIGNALING PATHWAYS: ANALYTICS
2.1 Introduction
Insights into the versatility of signaling pathways may be gleaned from pathway
architectures. As discussed in Chapter 1, studies over the past several decades have
revealed many signaling capabilities that arise from distinct pathway architectures,
e.g., logarithmic response [35], all-or-none response [13, 21], hysteresis [5, 7, 36],
and non-monotonic response [23]. Alternatively, analysis of pathway architectures
may also reveal shared signaling capabilities that emerge from distinct architectures,
pointing to a fundamental property that pathways have converged upon despite
their separate evolutionary trajectories. In this study, we sought to identify shared
properties between conserved signaling pathways.
To approach this question, we use established math models of signaling pathways.
As the number of known signaling pathway components and interactions continues
to grow, our intuition becomes less capable of understanding the myriad interactions
that occur with each signaling event. Conceptual models of linear signaling cascades
become quickly muddied by feedbacks, cross-talk, retroactivity, and other nonlinear
effects [9, 14, 46]. To this end, mathematical models are a necessary tool in
making progress in the study of signaling pathways [2]. Mathematical models can
incorporate large sets of known interactions and provide testable predictions for the unknown. In our case, we can use analytical tools to approach these pathways to
uncover dominant architectures within the pathway and how this influences pathway
behavior.
We examined three signaling pathways, the canonical Wnt, ERK, and Tgfβ
path-ways, since the architectures of the three pathways are captured by mathematical
models that have been refined by years of experiments [28, 40, 44]. These models
capture the salient features of each pathway and include biochemical details such as
synthesis, degradation, binding, dissociation, and post-translational modifications. In all the models, biochemical parameters have been directly measured or fitted
to kinetic measurements from cell, embryo, or extract systems. Although by no
means complete, the mathematical models have track records of success in
Wnt model [28] predicted robustness in fold-change response [17] and the
differen-tial roles of the two scaffolds in the pathway [28]; the ERK model [12, 21, 41, 44] captures the ultrasensitivity in the phosphorylation cascade [21]; and the Tgfβmodel
[40] reveals the roles of nucleocytoplasmic shuttling in transducing the duration and
intensity of ligand stimulation [40].
The Wnt, ERK, and Tgfβpathways transmit input using different core transmission
architecture (Figure 2.1A-C). In the Wnt pathway, signal transmission is
character-ized by a futile cycle of synthesis and rapid degradation [20, 24, 37]. Ligand-receptor input diminishes the degradation arm of this cycle, leading to accumulation of β-catenin output [24, 34, 43]. In the ERK pathway, signal transmission is characterized
by a cascade of phosphorylation events coupled to feedbacks, leading to an increase
in phosphorylated ERK output [4, 25, 27, 50]. Finally, signal transmission in the
Tgfβ pathway is characterized by continual nucleocytoplasmic protein shuttling
[22, 32, 33, 39, 48]. Ligand-receptor input effectively increases the rate of nuclear
import, leading to an increase in output, known as the nuclear Smad complex [40].
Figure 2.1: The core pathway for each metazoan signaling pathway is defined by distinct architectural features. In the Wnt pathway (A), the output is regulated by a futile cycle of continual synthesis and rapid degradation. In the ERK pathway
(B), the output is regulated by a kinase cascade coupled to negative feedback. In the Tgfβpathway(C), the output is regulated through continual nucleocytoplasmic shuttling.
We studied these mathematical models to identify what, if any, behaviors converge
across pathways. The Wnt [28], ERK [44], and Tgfβ[40] models consist of 7, 26, and
10 coupled, nonlinear ODEs, respectively, with 22, 46, and 13 parameters. Because
of their large sizes, they are typically solved numerically to simulate experimental
observations and generate new predictions. However, for the questions posed here,
we found that numerical simulations are not sufficient. Rather, we needed analytics
to uncover exactly how the pathway behaviors depend on the underlying biochemical
taxis network [49], and robustness in the bacterial osmolarity network [42] and in
the Wnt pathway [17]. While an analytical solution was previously derived for
the Wnt pathway [17], analytical treatment of the Tgfβand ERK pathways has not
been attempted due to the complex, nonlinear equations involved. To address this
problem, we employed various analytical techniques, including graph theory-based
variable elimination and dimensional analysis, to derive analytical or semi-analytical
solutions to the steady-state output of each pathway. Our analysis, along with
sub-sequent experimental verification, reveals a striking convergence across the Wnt,
Tgfβ, and ERK pathways: cells operate in the parameter regime where the complex, nonlinear interactions in each pathway give rise to linear signal transmission. Below,
we describe our analysis of each pathway and the unifying behavior that emerges
from all three pathways.
2.2 Results
Mathematical analysis reveals linear signal transmission in the canonical Wnt
pathway
In the Wnt pathway, cells sense ligand-receptor input by monitoringβ-catenin protein [6, 24, 30, 34, 43]. β-catenin is continually synthesized and rapidly degraded by a large destruction complex, comprised of multiple proteins including APC, Axin,
and GSK3β. The destruction complex binds and phosphorylatesβ-catenin, tagging it for degradation by the ubiquitin/proteosome machinery [24, 43]. Wnt ligands,
through binding to Frizzled and LRP receptors, inhibit the destruction complex,
leading to accumulation of β-catenin. β-catenin then regulates the expression of broad target genes [34, 43].
The model of the Wnt pathway (Figure 2.2A) was published in 2003 by a
collab-oration between the Kirschner and Heinrich labs [28]. The Wnt model consists
of 7 nonlinear differential equations and 22 parameters. Applying dimensional
analysis, we previously derived the analytical solution toβ-catenin concentration at steady-state [17]:
[βcat]ss = K17 ·
1−γ+α/u
2
s
(1+ 4γ (1−γ+α/u)2
−1
!
(2.1)
α= k4k6k9v14·GSK3tot · APCtot
k5k−6K7K8k13k15
γ = v12
k13K17
(2.3)
where the input function u = u(W nt) is the rate of inhibition of the destruction
complex via Dishevelled, a function of ligand-receptor activation. As illustrated
in Figure 2.2A, Kis are equilibrium dissociation constants, kis are rate constants,
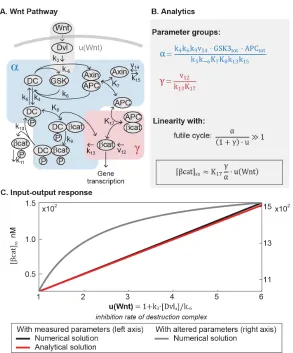
Figure 2.2: Mathematical analysis reveals linear signal transmission in the Wnt pathway. (A)Network diagram of the Wnt pathway. (B)The parameter groups and input-output relationship that were derived in this study. Parameter groups and input function are color-coded to the corresponding reactions in the network diagram. Parameters that do not appear in the parameter groups drop out due to irreversible reaction steps (such as k10 andk11). (C)The input-output relationship of the Wnt pathway. The output isβ-catenin, and the input functionu(W nt)is the rate by which Dishevelled inhibits the destruction complex upon Wnt ligand activation, wherek3 and k−6 are defined in the figure, and [Dvl]a is the concentration Wnt-activated Dishevelled.
Equation 2.1 demonstrates that, in general, β-catenin concentration is a nonlinear function of the input u. Many parameters of the model were directly measured in
Xenopus extracts, and the remaining calculated from measurements in the same
system. In this study, we examined how the analytical solution (Equation 2.1)
behaves with these measured parameters. The measured parameters indicate that
means that non-Axin dependent degradation is minimal, andα/u γ means that the positive feedback from sequestration by APC is minimal. Indeed, the rapid action of the destruction complex in the Wnt pathway is a recurring observation
across biological systems [20, 24, 37]. Withα/u 1+γ, Equation 2.1 simplifies to
[βcat]ss ≈K17
γ
αu (2.4)
with detailed derivations presented in the SI. Therefore, within physiologically relevant parameter values, the steady-stateβ-catenin concentration becomes a linear function of the input u (red line, Figure 2.2C). The linear input-output relationship
holds for the entire dynamic range of the model, until the system saturates at maximal
stimulation (u ∼ 6.0). We confirmed that the numerical solution of the full model matches the analytical solution in Equation 2.4 (blue line, Figure 2.2C), and that
the response becomes nonlinear when α is decreased, breaking the requirement
α/u 1+γ (grey line, Figure 2.2C).
Mathematical analysis reveals linear signal transmission in the MAPK/ERK
pathway
The unexpected linearity that emerges from the model of the Wnt pathway prompted us to wonder if such simplicity may be found in other pathways. Strikingly, we
ob-served the same linearity in the ERK and Tgfβ pathways. In the ERK pathway
(Figure 2.3A), ligand-receptor input is transmitted via a cascade of protein
phos-phorylation [25, 50]. In particular, ligand-receptor interactions activate Ras, which
leads to membrane recruitment and phosphorylation of Raf. Phosphorylated Raf
subsequently doubly-phosphorylates MEK, which in turn doubly-phosphorylates
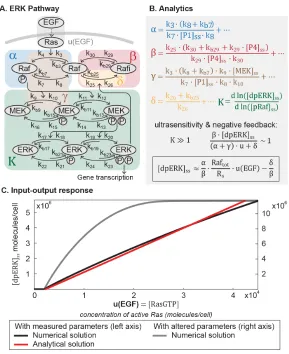
Figure 2.3: Mathematical analysis reveals linear signal transmission in the ERK pathway. (A) Network diagram of the ERK pathway. (B) The parameter groups and input-output relationship that were derived in this study. Parameter groups and input function are color-coded to the corresponding reactions in the network diagram. Parameters that do not appear in the parameter groups are negligible (as indicated by ellipses). (C)The input-output relationship of the ERK pathway. The output is dpERK, and the input function u is the concentration of EGF-activated Ras (Ras-GTP).
Doubly-phosphorylated ERK (dpERK) is a transcriptional regulator that affects a
broad array of genes [50]. The multi-step topology of the kinase cascade, combined
with distributive phosphorylation of each kinase, gives rise to ultrasensitivity – first
demonstrated in the seminal work by the Ferrell lab [13, 21]. In other contexts, the
pathway also exhibits a graded response [1, 8, 31, 47] that is thought to arise from
the incorporation of negative feedbacks [27, 38], one of which is the inhibition of Raf by dpERK through hyper-phosphorylation of serine residues [10, 18, 44].
[13, 15, 21, 41, 44]. The model, which captures ultrasensitivity and Raf feedback,
consists of 26 differential equations and 46 parameters. To derive an analytical ex-pression for the ERK pathway, we used a variable elimination technique developed
for networks of mass action kinetics [11]. The technique utilizes an algebraic
frame-work, linear elimination of variables, and mass conservation laws to parameterize
steady-state in terms of core variables (described in SI). We derived an analytical
relationship between the steady-state output of the pathway (dpERK) and the input
to the phosphorylation cascadeu:
[dpE RK]ss = α
β ·
Ra ftot [pRa f]ss
−1− γ
α
·u− δ
β (2.5)
α= k3· (k8+kb7)
k7· [P1]ss ·k8 +
. . . (2.6)
β = k25· (k30+kb29+k29· [P4]ss)
k29· [P4]ss·k30 +
. . . (2.7)
γ = k3· (k8+kb7) ·k9· [M E K]ss
k7· [P1]ss·k8· k10 +
. . . (2.8)
δ = k26+kb25
k26 +
. . . (2.9)
Detailed derivations of Equation 2.5 are presented in the SI. The inputu =u(EGF)
in Equation 2.5 is the concentration of active Ras, which is activated via GTP loading
at the ligand-receptor complex [25]. The parameter groupsα,β,γ, andδin Equation 2.5 are defined in Eqs. 2.6-2.9, where the ellipses indicate additional small terms
(expanded in SI). The relative magnitudes of α, β, γ, and δ indicate how the Raf pool partitions during signaling (Eqs. S3.3, 11-13). The dimensionless groupα·u
relates to the amount of free, phosphorylated Raf (α, blue-shaded in Figure 2.3A),
β· [dpE RK]ss describes the amount of Raf inhibited through negative feedback by dpERK (β, red-shaded in Figure 2.3A),δrelates to the amount of unphosphorylated (δ, blue-shaded in Figure 2.3A), andγ ·urelates to the amount of phosphorylated Raf bound to other proteins (e.g., to MEK, brown-shaded in Figure 2.3A). Equation
2.5 is not a closed solution, as it includes the term[pRa f]ss, and there are variables
included in parameter groups α, β, γ. We confirmed that the parameter groups remain constant over the course of signaling (within 10%, Figure S2.1), justifying
treating the latter variables as parameters.
Next, we considered how the analytical expression (Equation 2.5) behaves within
(α+γ)·u+δ. Second, as has been observed in multiple contexts [13, 21, 41, 44], ERK phosphorylation is ultrasensitive to the amount of pRaf (the ultrasensitive cascade is
shaded green in Figure 2.3A). DenotingKas the relative change of[dpE RK]sswith
respect to[pRa f]ss, ultrasensitivity entails thatK 1. In this range, small changes
in pRaf level have very large effects on dpERK level (e.g., in model simulations, a
30% change in pRaf level results in a 900% change in dpERK level, Figure S2.1).
We find analytically that in the parameter regime whereβ·[dpE RK]ss ∼ (α+γ)·u+δ
andK 1, the negative feedback holds the level of pRaf constant ([pRa f]ss ≈ Rs,
details in SI). With these two features, strong negative feedback and ultrasensitivity, dpERK becomes a linear function of the inputu:
[dpE RK]ss ≈
α β ·
Ra ftot
Rs
·u− δ
β (2.10)
The full derivation is given in the SI, and includes a toy model to illustrate the
intu-ition for how ultrasensitivity combines with negative feedback to produce linearity. Equation 2.10 is plotted in Figure 2.3C (red line). We confirmed that the numerical
solution of the full model matches the analytics in Equation 2.10 and becomes
non-linear when the negative feedback is weakened (grey line, Figure 2.3C). Although
the analytical expression describes up until 50% of ERK activation, we verified
numerically that the predicted linearity extends to 93% of ERK activation (Figure
S2.2).
The linearity derived here applies across different dynamic ERK responses. The
model we analyzed gives a sustained dpERK response. In some contexts, however,
the ERK pathway shows a pulsatile response, which has been attributed to receptor
desensitization [41]. Using a larger model that includes details of receptor desensi-tization [41], we numerically verified that the linearity holds for pulsatile responses,
i.e. the peak level of dpERK increases linearly with the peak level of u (Figure
S2.1).
Mathematical analysis reveals linear signal transmission in the Tgf-βpathway
Finally, we examined signal transduction within the Tgfβ pathway (Figure 2.4A).
In the Tgfβpathway, input from ligand-receptor interactions is transmitted by the
Smad proteins. There are several classes of Smad proteins, including the
receptor-regulated Smads (R-Smads) and the common Smad (co-Smad or Smad4) [32].
to the co-Smad and shuttle into the nucleus and regulate broad target genes. In
the nucleus, the Smad complex dissociates and R-Smads are constitutively de-phosphorylated and shuttled out to the cytoplasm, where the cycle of
phosphoryla-tion and complex formaphosphoryla-tion begins again [40]. This dynamic translocaphosphoryla-tion in and
out of the nucleus forms a continual nucleocytoplasmic shuttling of Smads, a known
integral feature of the Tgfβpathway [22, 33, 39, 48].
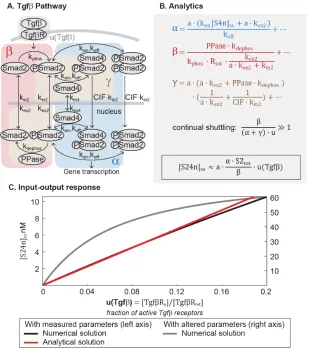
Figure 2.4: Mathematical analysis reveals linear signal transmission in the Tgf-β pathway. (A)Network diagram of the Tgfβsignaling pathway, modified from ref. [40]. (B)The parameter groups and input-output relationship that were analytically derived in this study. Parameter groups and input function are color-coded to the corresponding reactions in the network diagram. Parameters that do not appear in the parameter groups are negligible (as indicated by ellipses). (C)The input-output relationship of the Tgfβ pathway. The output is nuclear Smad complex, and the input functionuis the fraction of Tgfβ-activated receptors.
The Tgfβ model [40] was published in 2008 by the Hill lab, and consists of 10
R-[11], we derived an analytical expression of the steady-state concentration of Smad
complex in the nucleus:
[S24n]ss =a·
α·u
(α+γ) ·u+ β ·S2tot (2.11)
α= a· (kon[S4n]ss+a·kex2)
ko f f +
. . . (2.12)
β = PPase·kdephos
kphos·Rtot· a·kexkex2+2kin2
+. . . (2.13)
γ =a· a· kex2+PPase· kdephos
1
a·kex2 + 1
C I F ·kin2
+. . . (2.14)
In Equation 2.11, the input functionu = u(Tgfβ)is the active fraction of Tgfβ re-ceptors. The parameter a is the nucleocytoplasmic volume ratio. The dimensionless
parameter groups α, β, and γ in Equation 2.11 are defined in Equation 2.12-2.14, where the ellipses indicate additional small terms (expanded in SI). α, β, and γ describe how the Smad2 pool partitions during signaling (Eqs. S4.2, 8, 9): α· u
relates to the amount of nuclear Smad complex (α, blue-shaded in Figure 2.4A, cap-tures the parameters related to complex formation and translocation to the nucleus),
β relates to the amount of free, unphosphorylated Smad2 (β, red-shaded in Figure 2.4A, captures the parameters related to complex dissociation and translocation to
the cytoplasm), andγ ·uloosely relates to the remaining Smad2 pool (γ is brown-shaded in Figure 2.4A). Phosphorylated Smad2 quickly forms complex [26], so β essentially corresponds to total monomeric Smad2. Finally, Equation 2.11 is not a
closed solution, since variable[S4n]ssappears inα. We numerically tested that it is constant within 2% for non-saturating inputs (Figure S2.3), justifying treating it as
a parameter.
As in the Wnt and ERK pathways, the analytical expression for nuclear Smad
complex (Equation 2.11) allows us to see that the behavior dramatically simplifies
with parameters observed in experiment. We consider the case for non-saturating
inputs (u∼ .1). Protein concentrations in the Tgfβmodel were measured in human keratinocyte cells and the rate constants fitted to kinetic data measured in the cells
[40]. With the measured parameters, we find that β ∼ 46, α · u ∼ 1.5, and
rapidly dephosphorylated and exported. Dynamic Smad2 translocation maintains
monomeric Smad2 in excess to Smad complex (β (α+γ) ·u). and forms the continual nucleocytoplasmic shuttling that is characteristic of the Tgfβ pathway.
Even under maximal Tgfβstimulation, it has been estimated that phosphorylated
Smad2 comprises only 36% of the Smad2 pool [16, 39]. Withβ (α+γ) ·u, the first term in the denominator of Equation 2.11 is small, and concentration of nuclear
Smad complex becomes a linear function of input:
[S24n]ss ≈ a· α·S2tot
β ·u (2.15)
Equation 2.15 is plotted in Figure 2.4C (red line), and we confirmed that numerical
simulations recapitulate Equation 2.15 (blue line, Figure 2.4C). Although the
ana-lytical solution is valid only for small values of u, we numerically verified that the
predicted linearity holds for the entire range of input u (from 0 to 1, Figure S2.2). We confirmed that the pathway becomes nonlinear when the R-Smad phosphatase
is inhibited such that β ∼ (α+γ) ·u (grey line, Figure 2.4C). While the model analyzed here gives a sustained Smad response, we verified numerically that the
linearity holds for a larger model that includes receptor desensitization and gives a
pulsatile Smad response (Figure S2.3) [45].
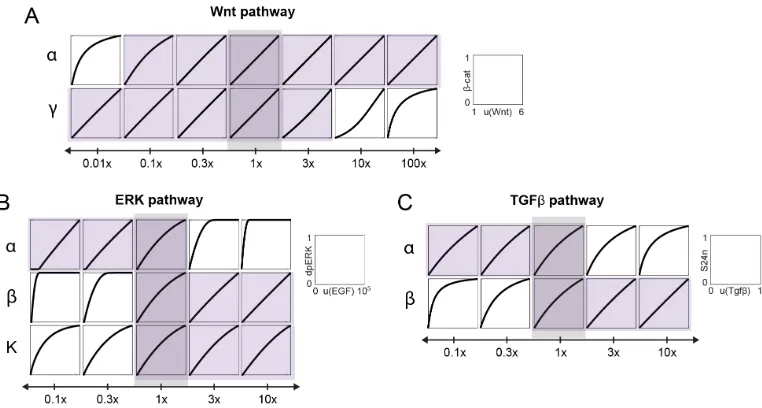
Linearity in the Wnt, MAPK/ERK, and Tgfβ pathways occurs across wide parameter range
Our study suggests that the canonical Wnt pathway, the ERK pathway, and the Tgfβ
pathway have converged upon a shared strategy of linear signal transmission. We
would then like to explore how wide a range of parameters this linearity occurs
across. To explore this, we varied several parameter groups for each signaling pathway: αandγfor the Wnt pathway,α, β, andKfor the ERK pathway, andαand
β for the Tgfβpathway. In the ERK and Tgfβpathways, the remaining parameter groups are not able to be varied independently, since they share many parameters
with other groups. After varying the parameter groups, we numerically calculated
the input-output response and assessed its linearity using the L1-norm. We find that
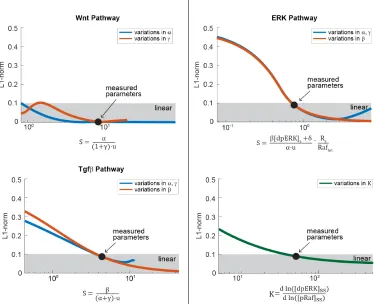
Next, we validated the relationship between linearity and the requirements for
lin-earity derived in the previous sections. We restated each requirement in terms of a scaling term S, such that linearity occurs when S >> 1 for the Wnt and Tgfβ pathways, and S > 1 for the ERK pathway. For the Wnt pathway, linearity occurs whereα/u 1γ, giving us the scaling term
S= α
(1+γ) ·u (2.16)
For the ERK pathway, the feedback must be strong enough to maintain the response
in the linear regime. We can express this in terms of the scaling term:
S= β[dpE RK]ss+δ
α·u · Rs
Ra ftot
(2.17)
We also tested the requirement of ultrasensitivity (K >>1) for linearity, by varying parameters in the kinase cascade to increase or decrease the sensitivity of the ERK
cascade. For the Tgfβpathway, linearity requires that β (α+γ) ·u. We rewrite this in terms of the scaling term:
S= β
(α+γ) ·u (2.18)
We then varied each scaling term by altering the value of the underlying parameter
groups. As in the previous section, we assessed the linearity of the input-output
response using the L1-norm. We find that linearity occurs over a large range ofS
(Figure 2.6). Interestingly, the ERK and Tgfβpathway operate close to the edge of
this linear regime. This could indicate that these pathways are capable of switching
Figure 2.6: The requirements for linear signal transmission in the Wnt, Tgfβ, and ERK pathways. In each plot, we varied S, defined in the equation shown on the x-axis, and simulated the input-output curve over the dynamic range of the model. The parameters in the equations are as defined in the main text. For the ERK and Tgfβpathways,αandγare linked in such a way that they could not easily be varied independently. Linearity was assessed using the L-1 norm, which ranges from 0 to 0.5, with L-1 norm < 0.1 indicating linearity. L1-norm analysis was performed over the full dynamic range of the system, i.e.,u(W nt) = 1- 6,u(E RK) = 0 to 110,000 molecules of Ras-GTP, which gave 90% activation of [dpE RK]ss in unperturbed cells, andu(Tgfβ)=0 to 1.
2.3 Discussion
In this chapter, we examined models of three signaling pathways to determine
their input-output response. Surprisingly, we found that despite their dissimilar
architectures, all three pathways converge upon a shared signaling strategy: linear
signal transmission. We also showed that linearity holds for steady-state response
as well as transient response in the ERK and Tgfβpathways, and that the linearity holds for a wide range of parameters.
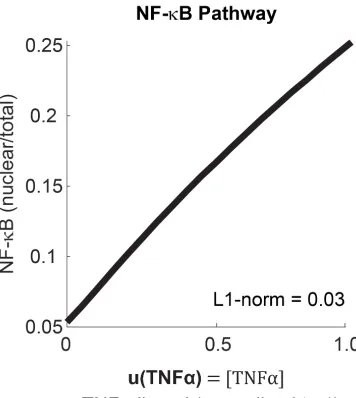
pathways – we would like to know whether linearity arises in other signaling
path-ways as well. Specifically, we analyze the NF-κB since there is an established math model that captures the biochemical reactions of the pathway [3, 19, 29]. However,
we cannot perform similar steady-state analysis as for the other pathways, due to
the dynamic nature of the pathway: notably, the NF-κB pathway exhibits strong
os-cillatory response to stimulus due to a slow transcriptional feedback [19]. Instead,
we employ numerical simulations of a well-established NF-κB model [3] over the
range of nuclear NF-κB translocation observed in human epithelial cells [29]. From
this, we indeed find that the peak of the nuclear NF-κB pulse correlates linearly with
ligand concentration (Figure 2.7).
Figure 2.7: Numerical simulation of the input-output relationship of the NF-κB pathway. We used the model first built by Hoffman et al. in 2002 [19] and later revised by Ashall et al. in 2009 [3]. The parameters in the model have been measured or fitted to single-cell dynamics in multiple cell types. We simulated the model here over a physiologically-observed dynamic range, i.e., Lee et al., 2014 [29] observed in HeLa cells that at saturating ligand dose (10 ng/mL TNFα, set to 1 in the model), 25% of NF-κB pool is nuclear. Linearity is assessed using the L1-norm, where L1-norm <1 indicates linear relationship (see Method).
While mathematical analysis provides strong insight into mechanisms of cell
signal-ing, further experimental evidence can improve our understanding of linear signal
transmission. Models are useful in providing qualitative predictions, but it is also
important to perform quantitative measurements of cell signaling behavior.
Figure S2.1: Model simulations for the ERK pathway. (A) Parameter groups
in the ERK model are constant to within 10%, over the physiologically relevant
range ofu considered here, justifying the inclusion of variables into the parameter
groups. (B-C)The dpERK output is an ultrasensitive function of both free and total
phosphorylated Raf. The valuesEsandRsare illustrated in(B)and are defined in SI
Section 3. (D-F)Numerical simulation of pulsatile response in the ERK pathway.
(D)A pulse of input, RasGTP, is generated by EGF addition in an ERK model that
includes details of receptor desensitization [41]. Basal activity of Ras is included to ensure constitutive negative feedback [15]. (E) dpERK output also exhibits a
pulsatile response, peaking within 10 minutes. (F)We plot the peak dpERK output
against peak input for a range of physiologically relevant u(EGF) doses, and find
that it matches our steady-state predictions for linear input-output response. (G)
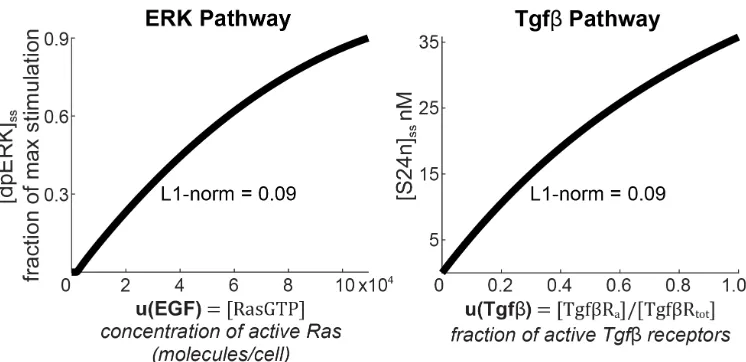
Figure S2.2: The predicted linearity extends throughout the dynamic range of the ERK and Tgfβpathways. (A-B)Numerical simulation of the ERK and Tgfβmodels.
Figure S2.3: Model simulations for the Tgfβpathway. (A)Nuclear Smad4
concen-tration is constant to within 2%, over a physiologically relevant range ofu(Tgfβ) considered here, justifying its inclusion into parameter group al pha. (B-D) Nu-merical simulation of pulsatile response in the Tgfβpathway. (B)A pulse of input,
active Tgfβreceptor, is generated by Tgfβaddition in a model that includes details
of receptor desensitization [45]. (C)S24n output also exhibits a pulsatile response.
(D) We plot the peak S24n output against peak input and find that it matches our
2.5 Supporting Information
Variable Elimination
We use a variable elimination technique from Feliu et al. [11] to derive analytic
expressions for the steady-states of the Tgfβ and ERK pathways. This technique
was developed to handle the complexity of large chemical reaction networks. By
eliminating variables from the steady-state solution, we can express the steady-state
of the system in terms of a smaller subset of variables. This is a useful tool for
analyzing the Tgfβand ERK models, as the steady-state solution consists of a large
set of variables, each with a polynomial equation describing its steady-state.
The technique works as follows: if we can identify a cut set within the reaction
network, we can reduce the system to a set of first-order homogeneous equations
with respect to that cut. This set of equations can then be solved using linear algebra.
A cut is a set of species such that for every reaction involving those species, there is
exactly one reactant and one product that falls within that cut. For example, let us
consider a network of 4 interacting species, A, B, C, and D.
[A]= −k1[A] · [D]2+k3[C]= 0 (2.19)
[B]= k1[A] · [D]2− k2[B]= 0 (2.20)
[C]= k2[B] −k3[C]=0 (2.21)
[D]= −2k1[A] · [D]2+k2[B]+k3[C]=0 (2.22)
which are set to zero at steady-state, and two additional conservation equations:
T1= [A]+[B]+[C] (2.23)
T2= 2[B]+[C]+[D] (2.24)
The variable elimination technique allows us to reduce the steady-state system of
equations by four (three equations for the cut set, and one conservation equation).
We do this by expressing each member of the cut set as a dependent variable of
D, shown below. We utilize the fact that the differential equations for A, B, and C
are first-order and homogeneous with respect to our cut, and rewrite them in matrix
form. We use the subscript “ss” to denote steady-state:
© «
−k1[D]2ss 0 k3
k1[D]2ss −k2 0
0 k2 −k3
ª ® ® ® ¬ © «
[A]ss
[B]ss
[C]ss
ª ® ® ® ¬
=0 (2.25)
Feliu and Wiuf [11] provide a proof of why a cut set guarantees that we can rewrite
the corresponding equations in matrix form. It can be understood intuitively from the
fact that a cut contains exactly one reactant of each reaction, and therefore each rate
is first-order with respect to the cut. Homogeneity also follows from this, since there
are no rate terms that do not include members of the cut. For a complex model, there
is no guarantee that we can derive closed-form analytical solutions for steady-state.
The matrix formulation and variable elimination technique immediately provides us
with a set of solvable variables. The solution to the matrix equation above is:
[A]ss =c·k2k3 (2.26)
[C]ss =c·k1k2D2ss (2.28)
c is a scaling factor not constrained by the matrix equation. With the use of the
conservation equation S1.5, we can calculate c and express the steady state of all
three species solely in terms of the parameters of the network, and [D]ss. For
instance, the solution for[C]ssis below.
[C]ss = k1k2[D] 2 ss
k2k3+k1[D]2ss· (k2+k3)
T1 (2.29)
The solutions for[A]ss,[B]ss, and[C]ssderived from the variable elimination
tech-nique still depend on [D]ss. If we plug in the solutions for the cut species, we
can obtain polynomial equations for the remaining species (in this case[D]ss), but
closed form expressions are not necessarily obtainable. In all the cases analyzed in
this paper, variables that appear in the analytical solutions for the cut set happen to
be approximately constant across a wide range of input values, as they are present in
excess relative to other species. Finally, each parameter group is physically mean-ingful. For instance, k2k3, k1k3[D]2ss, and k1k2[D]2ss represent the un-normalized
fraction of T1 that exists as A, B, and C, respectively. The normalization factor
for these fractions isc/T1, or in this case, simply the sum of all parameter groups.
This provides an intuitive way of analyzing how parameter groups affect the overall
distribution ofT1. For instance, increasing the value ofk1will increase the amount
ofT1that exists as B and C, while necessarily decreasing the amount of A (assuming
[D]ss does not change significantly)
Wnt Model
We analyzed a mathematical model of the canonical Wnt pathway built by Lee et
al. [28]. The model is illustrated in Figure 2.2A, and consists of 7 ODEs and 22
parameters.
Solving the Wnt model at steady-state
We previously derived an expression forβ-catenin in steady-state [17]:
[βcat]ss =K17
1−γ+α/u(W nt) 2
s
1+ 4γ
(1−γ+α/u(W nt))2 −1
!
(2.30)
where the parameters are dimensionless groups of the binding rate constants and
protein concentrations:
α= k4·k6·k9·v14·GSK3tot · APCtot
k5·k−6cdotK7·K8·k13·k15
u(W nt)=1+ k3·Dvltot
k−6
· k1·W nt
k2+ k1·W nt
(2.33)
The input function u = u(W nt) corresponds to the rate at which Wnt stimulation
inhibits the destruction complex, normalized byk−6. The value of Wnt ranges from 0 to 1 in the model. Please refer to Goentoro et al. [17] for the physical intuition of
each parameter group.
Derivation of Linear Behavior
We calculate the value of the parameter groups, as well as the value of the input
function at saturating Wnt stimulation:
α=66 (2.34)
γ =1.4 (2.35)
u(W nt =1)=6.0 (2.36)
Within the parameter regime measured in cells, the analytical expression for β-catenin dramatically simplifies. We can perform the following first-order Taylor
expansion:
√
1+ ≈1+ 1
2, 1 (2.37)
= 4γ
(1−γ+α/u)2 (2.38)
This holds true for α/u γ. Furthermore, we can make the approximation 1− γ+α/u ≈ α/uas long as α/u 1 also holds. We can encompass these two inequalities withinα/u 1+γ. The equation simplifies to:
[βcat]ss ≈K17
γ
αu (2.39)
ERK Model
We analyzed a mathematical model built by Huang et al. [21] and revised by Sturm
et al. [44]. The model is illustrated in Figure 2.3A and contains 26 ODEs and 46
parameters. We changed two parameters from the original model. k25characterizes
the negative feedback from dpERK to unphosphorylated Raf, andk27characterizes

![Figure S2.1: Model simulations for the ERK pathway.(A)in the ERK model are constant to within 10%, over the physiologically relevantrange ofgroups.Section 3.(D)includes details of receptor desensitization [41]](https://thumb-us.123doks.com/thumbv2/123dok_us/1118633.1141072/38.612.137.477.104.428/simulations-constant-physiologically-relevantrange-section-includes-receptor-desensitization.webp)
![Figure S2.3: Model simulations for the Tgfβ(D)active Tgfof receptor desensitization [45].considered here, justifying its inclusion into parameter groupmerical simulation of pulsatile response in the Tgf pathway](https://thumb-us.123doks.com/thumbv2/123dok_us/1118633.1141072/40.612.112.495.96.468/simulations-desensitization-considered-justifying-parameter-groupmerical-simulation-pulsatile.webp)