Clinical Epidemiology
Dove
press
O R I G I N A L R E S E A R C H
open access to scientific and medical research
Open Access Full Text Article
How do patients with diabetes report their
comorbidities? Comparison with administrative
data
Jonas Hoffmann1,*
Burkhard Haastert2,*
Manuela Brüne1
Matthias Kaltheuner3
Alexander Begun1
Nadja Chernyak4
Andrea Icks1,4,5
1Institute of Health Services Research and Health Economics, German Diabetes Center, Düsseldorf, Germany; 2mediStatistica, Neuenrade, Germany; 3Specialized Diabetes Practice Leverkusen, Leverkusen, Germany; 4Faculty of Medicine, Centre for Health and Society, Institute of Health Services Research and Health Economics, Heinrich-Heine University Düsseldorf, Düsseldorf, Germany; 5German Center for Diabetes Research, Ingolstädter Neuherberg, Germany
*These authors contributed equally to this work
Aims:Patients with diabetes are probably often unaware of their comorbidities. We estimated agreement between self-reported comorbidities and administrative data.
Methods:In a random sample of 464 diabetes patients, data from a questionnaire asking about the presence of 14 comorbidities closely related to diabetes were individually linked with statu-tory health insurance data.
Results:Specificities were >97%, except cardiac insufficiency (94.5%), eye diseases (93.8%), peripheral arterial disease (92.6%), hypertension (90.9%), and peripheral neuropathy (85.8%). Sensitivities were <60%, except amputation (100%), hypertension (83.1%), and myocardial infarction (67.2%). A few positive predictive values were >90% (hypertension, myocardial infarction, and eye disease), and six were below 70%. Six negative predictive values were >90%, and two <70% (hypertension and eye disease). Total agreement was between 42.7% (eye disease) and 100% (dialysis and amputation). Overall, substantial agreement was observed for three morbidities (kappa 0.61–0.80: hypertension, myocardial infarction, and amputation). Moderate agreement (kappa 0.41–0.60) was estimated for angina pectoris, heart failure, stroke, peripheral neuropathy, and kidney disease. Factors associated with agreement were the number of comorbidities, diabetes duration, age, sex, and education.
Conclusions:Myocardial infarction and amputation were well reported by patients as comor-bidities; eye diseases and foot ulceration rather poorly, particularly in older, male, or less educated patients. Patient information needs improving.
Keywords: diabetes comorbidities, self-report, agreement, patient information
Introduction
The prevalence of diabetes mellitus has increased substantially and in 2015 reached 8.8%, which corresponds to 415 million patients globally. Diabetes is a major cause of morbidity and mortality and is, in economic terms, extremely costly.1
One of the largest problems in diabetes is the high risk of diabetes-associated comorbidities, such as foot ulceration, retinopathy, chronic kidney disease, and car-diovascular diseases. These complications crucially affect a patient’s health-related quality of life, health care utilization, health care costs, and life expectancy.1–6 However,
patients are probably often unaware of their comorbidities.7 For instance, 32% of people
with diabetes do not realize that heart disease is a common complication of diabetes.7
Seventy-seven percent of people diagnosed with diabetes and peripheral neuropathy were unaware of their condition.8 This is of high relevance for several reasons: 1)
Knowledge about comorbidities is crucial for effective self-management.9
Accord-ing to Duggan and Bates10, diabetic patients have a substantial need for information,
Correspondence: Andrea Icks Faculty of Medicine, Centre for Health and Society, Institute of Health Services Research and Health Economics, Heinrich-Heine University Düsseldorf, Moorenstr. 59, 40225 Düsseldorf, Germany
Tel +49 211 811 9780 Fax +49 211 811 9778
Email andrea.icks@uni-duesseldorf.de
Journal name: Clinical Epidemiology Article Designation: ORIGINAL RESEARCH Year: 2018
Volume: 10
Running head verso: Hoffmann et al
Running head recto: Diabetes-related comorbidities in self-reported and administrative data DOI: http://dx.doi.org/10.2147/CLEP.S135872
Clinical Epidemiology downloaded from https://www.dovepress.com/ by 118.70.13.36 on 20-Aug-2020
For personal use only.
Dovepress
Hoffmann et al
but a large proportion of patients with diabetes have stated that they are not well informed about the disease.11 Hence,
more effort should be made to provide diabetic patients with effective information. 2) In most observational as well as interventional or health economic studies, comorbidity has to be assessed as a relevant outcome or confounder. Very often, data concerning comorbidities are assessed by asking patients, that is, it is self-reported. Incomplete knowledge about their own comorbidities would result in invalid data.
A number of studies analyzed the agreement between self-reported and routine data-based comorbidities in different patient populations, and found it to differ largely, depending on the comorbidity and patients’ characteristics.12–15 However,
in patients with diabetes, no study has as yet investigated the level of agreement between different data sources reporting diabetes-associated comorbidities.
The aim of our study was 1) to estimate the agreement between patients’ self-reported and health insurance data with regard to comorbidity, and 2) to evaluate the factors associated with the level of agreement.
Methods
Study design
We performed an observational study. Comorbidity data were obtained using a written questionnaire and then linked to statutory health insurance (SHI) data in order to examine the agreement between the data sources.
Study population
Patients were recruited in an outpatient clinical center spe-cializing in diabetes treatment. This center treats about 3,500 patients with diabetes in a defined region of Western Germany. We selected all the patients who were members of the pronova health insurance company (pronova BKK), because data from this SHI had been made available for our study. Pronova BKK covers a large proportion of the inhabitants in the study region and about 30% of the patients with diabetes at our clinical study center. Of these patients insured with the pronova BKK, 737 were randomly selected and were contacted by telephone to ask if they would be willing to participate in our study. Five hundred agreed (response 67.8%). Of these 500 patients, two had to be excluded because they were employees of the BKK, and a further 34 because of missing data, resulting in a population of 464 patients for inclusion in the analyses.
Ethical approval for the study was granted by the Ethics Committee, Faculty of Medicine, Heinrich-Heine University Düsseldorf (references 3455 and 3595). All patients have pro-vided written informed consent for participating in this study.
Data sources and variables
Self-report questionnaire
The questionnaire used for the study was developed to con-duct trial economic evaluations of interventions for patients with diabetes.16,17 First, available health care utilization and
comorbidity questionnaires were reviewed and then a new questionnaire more suitable for reflecting the specific aspects of diabetes was elaborated in close cooperation with clinical experts. We conducted interviews with patients from self-help groups and general practitioners in order to evaluate and further improve the questionnaire, using cognitive techniques such as paraphrasing to check whether the questions were consistently understood and could be answered by all the respondents. The instrument has been modified accordingly and published in its final version.18
The questionnaire asks about the presence of comorbidi-ties, taken from a list of 35, within the previous 12 months (“Has a doctor diagnosed the following condition?”). Of these 35 comorbidities, 14 were defined as closely associated with diabetes: hypertension, peripheral arterial disease, angina pectoris, myocardial infarction (MI), heart failure, impaired cerebral blood flow, stroke, transient ischemic attack (TIA), eye diseases, peripheral neuropathy (lower extremity), foot ulcerations, amputations, kidney disease, and dialysis. The exact question and the 35 comorbidities are presented in the Supplementary material.
The assessment of self-reports was conducted between March 2011 and November 2012. Patients received the printed questionnaire during a routine physician visit and filled it out by themselves. After the patients had filled out the questionnaire, it was checked immediately by a member of the study team, and missing or implausible data were clarified.
Besides comorbidities, the questionnaire assessed a number of sociodemographic variables: age, sex, educa-tion (highest school and occupaeduca-tional degree according to Hoffmeyer-Zlotnik and Warner, dichotomized by the cut point ≥5),19 and income (net wage household income,
dichotomized by the cut point >1,250 EUR).20 Furthermore,
the EQ-5D was used to assess health-related quality of life.21
Health insurance data
In Germany, SHIs cover the vast majority of health services (ambulatory services, emergency visits, hospitalization, medication, and so on). All health service data are avail-able for every individual insurant, along with exact dates and diagnoses. Every diagnosis is coded according to the International Statistical Classification of Diseases (ICD10).
Clinical Epidemiology downloaded from https://www.dovepress.com/ by 118.70.13.36 on 20-Aug-2020
Dovepress Diabetes-related comorbidities in self-reported and administrative data
For the present analysis, all SHI data were available from the study population during the 12 months before the assessment of the patients’ comorbidities. Diagnoses concerning the comorbidities of interest were selected by one researcher (JH), and checked in full by a second (HA). The number of chronic diseases (later dichotomized using the cut point >5) was determined by the following rule22: diabetes plus 35
dis-eases from the questionnaire were considered as candidates for chronic diseases. A disease was counted as chronic if the corresponding ICD10 code appears at least in three out of four quarters prior to the patient’s assessment.
Statistical analyses
Description of the study population
The characteristics of the study population were described using means (SD) and proportions as appropriate. Prevalence of diseases from health insurance data and from self-reports were estimated along with 95% CIs.
Agreement between the data sources
We estimated the agreement between self-report and SHI data by using the following probability measures, including 95% CIs: sensitivity (ratio of correctly reported positive SHI data/ all positive SHI), specificity (ratio of correctly reported nega-tive SHI data/all neganega-tive SHI data), posinega-tive predicnega-tive value (PPV) (ratio of positive SHI data/all positives reported by the questionnaire), negative predictive value (NPV) (ratio nega-tive SHI data/all neganega-tives reported by the questionnaire), and total agreement (ratio of correctly reported positive or negative SHI data/total reports or SHI data).
The chance-corrected agreement between self-reported questionnaire data and SHI data was estimated by kappa coefficients.23 The ranges of kappa values were interpreted as
follows24: ≤0.40 poor-to-fair agreement, 0.41–0.60 moderate
agreement, 0.61–0.80 substantial agreement, and 0.81–1.00 excellent agreement.
A stratified analysis of sensitivity, specificity, and total agreement was conducted for each condition according to age (continuous), sex, education level (according to the Hoffmeyer-Zlotnik/Warner Matrix),25 income, general health
(assessed by the visual analog scale of the EQ-5D),21 diabetes
duration (≥10 versus <10 years, extracted from the practice documentation), and number of chronic comorbidities derived by SHI data. Differences across strata were examined by univariate logistic regression (described below). Ampu-tation and dialysis were excluded from stratified analyses because of low prevalence and small differences between insurance data and self-reports.
Logistic regression
Logistic regression models were fitted to estimate associa-tions between the above-mentioned patient characteristics and total agreement between diagnoses from health insur-ance and self-reports for each disease, with the exception of amputations and dialyses. First, unadjusted odds ratios (95% CIs) were estimated from univariate models. Additionally, odds ratios were adjusted by fitting multivariate models, including age (≥65 years), sex, education level (≥5), income (>1,250 EUR), general health (assessed by the visual analog scale of the EQ-5D, >75 versus ≤75), diabetes duration (≥10 versus <10 years), and number of chronic comorbidities (>5) simultaneously.
All analyses were performed using the Statistical Analysis Systems SAS (SAS for Windows running on the X64_8PRO platform, Release 9.4 TS1M3 and TS1M4; SAS Institute Inc., Cary, NC, USA). A two-sided alpha level of 0.05 was considered statistically significant.
Results
Population
The characteristics of the cohort are described in Table 1. The mean age was about 60 years, and 61% were male. Higher
Table 1 Patient characteristics
Variable Proportion/mean (n=464)
Sex
Male (n, %) 281 (60.6)
Female (n, %) 183 (39.4)
Age (years)
<65 (n, %) 277 (59.7)
≥65 (n, %) 187 (40.3)
Age (years), mean±SD (range) 60.1±14.4 (18–89) Diabetes type (3 missing)
Type 1 (n, %) 107 (23.2)
Type 2 (n, %) 354 (76.8)
Diabetes duration (years)
Mean±SD (range) 13.5±10.5 (0–59)
≥10 years (n, %) 278 (59.9)
Equivalized disposable income (EUR, 53 missing)
≤1250 EUR (n, %) 241 (58.6)
>1250 EUR (n, %) 170 (41.4)
Education (%, 7 missing)
Low (n, %) 248 (54.3)
Higher (n, %) 209 (45.7)
EQ-5D-VAS (%, 2 missing)a
≤75 (n, %) 266 (57.6)
>75 (n, %) 196 (42.4)
Number of chronic diseases (%)
≤5 (n, %) 261 (56.3)
>5 (n, %) 203 (43.8)
Notes: aVisual analog scale of the EuroQol quality-of-life questionnaire.
Clinical Epidemiology downloaded from https://www.dovepress.com/ by 118.70.13.36 on 20-Aug-2020
Dovepress
Hoffmann et al
and lower socioeconomic positions were almost equally distributed. The mean diabetes duration was 13.5 years, and about three quarters had type 2 diabetes. More than 40% had more than five comorbidities besides their diabetes. Table 2 presents numbers and prevalence of the assessed comorbidi-ties. Compared with the individuals who did not participate in the study (from the random sample of 737 pronova BKK patients), the percentage of men was slightly, but not signifi-cantly, higher in the responders. The age distribution using 5-year grouping was similar in responders and nonresponders (data not shown).
Agreement
The agreement measures of the different comorbidities are presented in Table 3. High specificities above 97% were in
the majority; exceptions (<97%) were cardiac insufficiency (94.5%), eye diseases (93.8%), peripheral arterial disease (92.6%), hypertension (90.9%), and peripheral neuropathy (85.8%). Sensitivities were below 60% for 10 comorbidities, above 60%, only amputation (100%), hypertension (83.1%), and MI (67.2%) were above 60%. Depending on prevalence (Table 1), specificities and sensitivities can be transformed into estimates of PPVs and NPVs (Table 2). Only a few PPVs were above 90% (hypertension, MI, and eye disease). On the other hand, six PPVs were below 70%. Six NPVs >90% were observed; only two were below 70% (hypertension and eye diseases). Total agreement was estimated between 42,7% (eye diseases) and about 100 % (dialysis and amputation). However, these results also depend on the prevalence. For instance, total agreement was 96.8% for TIA, but a kappa
Table 2 Disease prevalence in the study population
Comorbidities Prevalence (95% confidence interval)
n (GKV) n (self-reported) GKV Self-documentation
Hypertension 354 304 76.3 (72.2–80.1) 65.5 (61.0–69.8)
Peripheral arterial disease 124 68 26.7 (22.7–31.0) 14.7 (11.6–18.2)
Angina pectoris 134 56 28.9 (24.8–33.2) 12.1 (9.2–15.4)
Myocardial infarction 58 43 12.5 (9.6–15.9) 9.3 (6.8–12.3)
Heart failure 79 57 17.0 (13.7–20.8) 12.3 (9.4–15.6)
Impaired cerebral blood flow 57 11 12.3 (9.4–15.6) 2.4 (1.2–4.2)
Stroke/apoplexy 42 19 9.1 (6.6–12.0) 4.1 (2.5–6.3)
Transient ischemic attack 7 10 1.5 (0.6–3.1) 2.2 (1.0–3.9)
Eye diseases 368 114 79.3 (75.3–82.9) 24.6 (20.7–28.7)
Peripheral neuropathy (leg) 210 157 45.3 (40.7–49.9) 33.8 (29.5–38.3)
Foot ulceration 58 29 12.5 (9.6–15.9) 6.3 (4.2–8.9)
Lower-extremity amputation (legs) 8 13 1.7 (0.7–3.4) 2.8 (1.5–4.7)
Kidney disease 130 61 28.0 (24.0–32.3) 13.1 (10.2–16.6)
Dialysis 0 0 0.0 (0.0–0.8) 0.0 (0.0–0.8)
Note: GKV, Statutory health insurance.
Table 3 Sensitivity, specificity, PPV, NPV, kappa, and total agreement
Disease Sensitivity (%) (95% CI)
Specificity (%)
(95% CI)
PPV (%) (95% CI)
NPV (%) (95% CI)
Kappa (95% CI) Total agreement (%) (95% CI)
Hypertension 83.1 (78.7–86.8) 90.9 (83.9–95.6) 96.7 (94.0–98.4) 62.5 (54.5–70.0) 0.64 (0.56–0.71) 84.9 (81.3–88.0) Peripheral arterial disease 34.7 (26.4–43.7) 92.6 (89.3–95.2) 63.2 (50.7–74.6) 79.5 (75.2–83.4) 0.32 (0.22–0.42) 77.2 (73.1–80.9) Angina pectoris 37.3 (29.1–46.1) 98.2 (96.1–99.3) 89.3 (78.1–96.0) 79.4 (75.2–83.2) 0.43 (0.34–0.52) 80.6 (76.7–84.1) Myocardial infarction 67.2 (53.7–79.0) 99.0 (97.5–99.7) 90.7 (77.9–97.4) 95.5 (93.0–97.3) 0.75 (0.65–0.84) 95.0 (92.7–96.8) Heart failure 45.6 (34.3–57.2) 94.5 (91.8–96.6) 63.2 (49.3–75.6) 89.4 (86.0–92.2) 0.45 (0.34–0.56) 86.2 (82.7–89.2)
Impaired cerebral blood flow 12.3 (5.1–23.7) 99.0 (97.5–99.7) 63.6 (30.8–89.1) 89.0 (85.7–91.7) 0.17 (0.05–0.30) 88.4 (85.1–91.1)
Stroke/apoplexy 38.1 (23.6–54.4) 99.3 (97.9–99.9) 84.2 (60.4–96.6) 94.2 (91.6–96.1) 0.50 (0.34–0.65) 93.8 (91.1–95.8) Transient ischemic attack 14.3 (0.4–57.9) 98.0 (96.3–99.1) 10.0 (0.3–44.5) 98.7 (97.1–99.5) 0.10 (–0.11–0.31) 96.8 (94.7–98.2) Eye diseases 29.3 (24.7–34.3) 93.8 (86.9–97.7) 94.7 (88.9–98.0) 25.7 (21.2–30.6) 0.12 (0.08–0.16) 42.7 (38.1–47.3) Peripheral neuropathy (leg) 57.6 (50.6–64.4) 85.8 (80.9–89.9) 77.1 (69.7–83.4) 71.0 (65.6–76.0) 0.44 (0.36–0.52) 73.1 (68.8–77.0) Foot ulcerations 32.8 (21.0–46.3) 97.5 (95.5–98.8) 65.5 (45.7–82.1) 91.0 (87.9–93.5) 0.39 (0.25–0.52) 89.4 (86.3–92.1) Lower-extremity amputation 100.0 (63.1–100.0) 98.9 (97.5–99.6) 61.5 (31.6–86.1) 100.0 (99.2–100.0) 0.76 (0.55–0.96) 98.9 (97.5–99.6) Kidney disease 40.0 (31.5–49.0) 97.3 (94.9–98.8) 85.2 (73.8–93.0) 80.6 (76.4–84.4) 0.45 (0.35–0.54) 81.3 (77.4–84.7)
Dialysis – 100.0 (99.2–100.0) – 100.0 (99.2–100.0) – 100.0 (99.2–100.0)
Abbreviations: NPV, negative predictive value; PPV, positive predictive value.
Clinical Epidemiology downloaded from https://www.dovepress.com/ by 118.70.13.36 on 20-Aug-2020
Dovepress Diabetes-related comorbidities in self-reported and administrative data
of 0.10 corresponds only to poor agreement (sensitivity 14.3%, prevalence 1.5%). Overall, substantial agreement was observed for three comorbidities, corresponding to kappa 0.61–0.80: hypertension, MI, amputation. A moder-ate agreement was estimmoder-ated for five comorbidities (kappa 0.41–0.60: angina pectoris, heart failure, stroke, peripheral neuropathy, kidney disease).
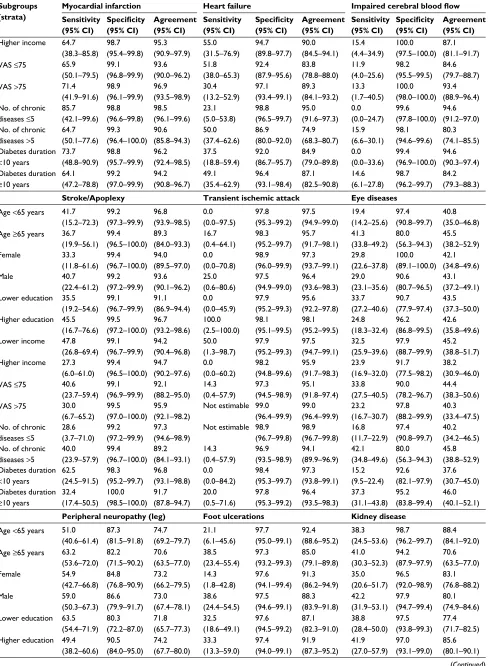
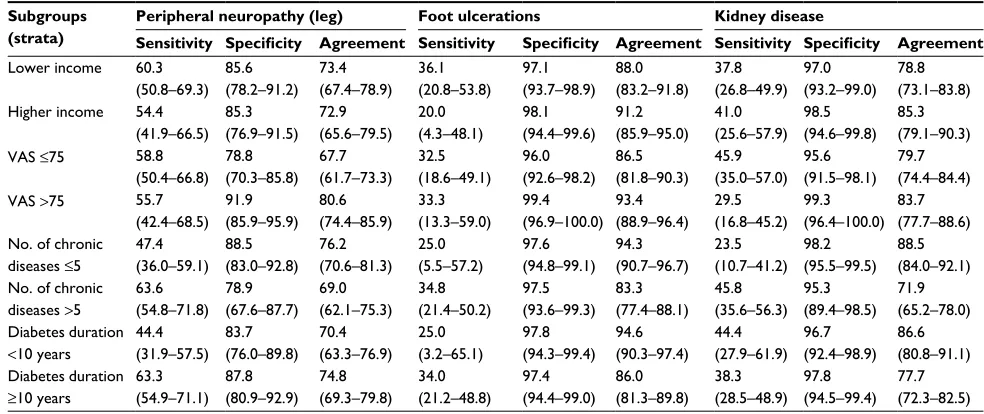
Table 4 Sensitivity, specificity, and total agreement stratified by patient characteristics
Subgroups (strata)
Hypertension Peripheral arterial disease Angina pectoris Sensitivity (95% CI) Specificity (95% CI) Agreement (95% CI) Sensitivity (95% CI) Specificity (95% CI) Agreement (95% CI) Sensitivity (95% CI) Specificity (95% CI) Agreement (95% CI)
Age <65 years 84.3 (78.1–89.3) 91.9 (84.7–96.4) 87.0 (82.5–90.7) 25.0 (12.7–41.2) 93.7 (89.8–96.4) 83.8 (78.9–87.9) 34.8 (21.4–50.2) 99.1 (96.9–99.9) 88.4 (84.1–92.0) Age ≥65 years 81.8
(75.3–87.2) 81.8 (48.2–97.7) 81.8 (75.5–87.1) 39.3 (28.8–50.5) 90.3 (82.9–95.2) 67.4 (60.2–74.0) 38.6 (28.4–49.6) 96.0 (90.0–98.9) 69.0 (61.8–75.5) Female 83.5 (76.2–89.2) 93.2 (81.3–98.6) 85.8 (79.9–90.5) 26.8 (14.2–42.9) 93.0 (87.4–96.6) 78.1 (71.4–83.9) 31.7 (18.1–48.1) 97.9 (94.0–99.6) 83.1 (76.8–88.2) Male 82.8 (77.1–87.6) 89.4 (79.4–95.6) 84.3 (79.6–88.4) 38.6 (28.1–49.9) 92.4 (87.8–95.7) 76.5 (71.1–81.3) 39.8 (29.8–50.5) 98.4 (95.4–99.7) 79.0 (73.8–83.6) Lower education 82.3
(76.6–87.2) 81.8 (64.5–93.0) 82.3 (76.9–86.8) 40.5 (29.9–51.7) 89.6 (83.9–93.8) 73.0 (67.0–78.4) 35.6 (26.4–45.8) 96.6 (92.2–98.9) 71.8 (65.7–77.3) Higher education 83.8
(76.5–89.6) 95.9 (88.5–99.1) 88.0 (82.9–92.1) 23.1 (11.1–39.3) 95.9 (91.7–98.3) 82.3 (76.4–87.2) 42.4 (25.5–60.8) 100.0 (97.9–100.0) 90.9 (86.2–94.4) Lower income 82.4
(76.1–87.5) 87.0 (75.1–94.6) 83.4 (78.1–87.9) 33.3 (22.2–46.0) 89.7 (84.2–93.8) 74.3 (68.3–79.7) 41.9 (30.5–53.9) 98.2 (94.8–99.6) 80.9 (75.4–85.7) Higher income 82.4
(74.6–88.6) 93.3 (81.7–98.6) 85.3 (79.1–90.3) 33.3 (19.6–49.5) 96.1 (91.1–98.7) 80.6 (73.8–86.2) 39.5 (25.0–55.6) 98.4 (94.4–99.8) 83.5 (77.1–88.8) VAS ≤75 83.5
(78.0–88.1) 92.9 (80.5–98.5) 85.0 (80.1–89.0) 37.1 (27.1–48.0) 87.6 (81.8–92.0) 70.7 (64.8–76.1) 45.3 (35.0–55.8) 97.7 (94.1–99.4) 78.9 (73.5–83.7) VAS >75 82.8
(75.1–88.9) 89.7 (79.9–95.8) 85.2 (79.4–89.9) 29.4 (15.1–47.5) 98.1 (94.7–99.6) 86.2 (80.6–90.7) 17.9 (7.5–33.5) 98.7 (95.5–99.8) 82.7 (76.6–87.7) No. of chronic
diseases ≤5
85.1 (78.4–90.3) 90.7 (83.5–95.4) 87.4 (82.7–91.1) 38.2 (22.2–56.4) 95.6 (92.0–97.9) 88.1 (83.6–91.8) 32.1 (15.9–52.4) 99.6 (97.6–100.0) 92.3 (88.4–95.3) No. of chronic
diseases >5
81.5 (75.4–86.6) 100.0 (29.2–100.0) 81.8 (75.8–86.8) 33.3 (23.7–44.1) 86.7 (79.1–92.4) 63.1 (56.0–69.7) 38.7 (29.4–48.6) 94.8 (88.4–98.3) 65.5 (58.5–72.0) Diabetes duration
<10 years
84.2 (76.9–90.0) 92.5 (81.8–97.9) 86.6 (80.8–91.1) 35.0 (15.4–59.2) 93.4 (88.5–96.6) 87.1 (81.4–91.6) 51.2 (35.1–67.1) 100.0 (97.5–100.0) 89.2 (83.9–93.3) Diabetes duration
≥10 years
82.4 (76.7–87.1) 89.5 (78.5–96.0) 83.8 (78.9–87.9) 34.6 (25.6–44.6) 92.0 (86.9–95.5) 70.5 (64.8–75.8) 31.2 (22.0–41.6) 96.8 (93.1–98.8) 74.8 (69.3–79.8)
Myocardial infarction Heart failure Impaired cerebral blood flow
Age <65 years 71.4 (47.8–88.7) 99.2 (97.2–99.9) 97.1 (94.4–98.7) 25.0 (8.7–49.1) 97.3 (94.5–98.9) 92.1 (88.2–95.0) 7.7 (0.2–36.0) 98.9 (96.7–99.8) 94.6 (91.2–96.9) Age ≥65 years 64.9
(47.5–79.8) 98.7 (95.3–99.8) 92.0 (87.1–95.4) 52.5 (39.1–65.7) 89.1 (82.3–93.9) 77.5 (70.9–83.3) 13.6 (5.2–27.4) 99.3 (96.2–100.0) 79.1 (72.6–84.7) Female 76.9 (46.2–95.0) 99.4 (96.8–100.0) 97.8 (94.5–99.4) 51.9 (31.9–71.3) 97.4 (93.6–99.3) 90.7 (85.5–94.5) 4.2 (0.1–21.1) 99.4 (96.5–100.0) 86.9 (81.1–91.4) Male 64.4 (48.8–78.1) 98.7 (96.3–99.7) 93.2 (89.6–95.9) 42.3 (28.7–56.8) 92.6 (88.4–95.6) 83.3 (78.4–87.4) 18.2 (7.0–35.5) 98.8 (96.5–99.7) 89.3 (85.1–92.7) Lower education 61.9
(45.6–76.4) 99.5 (97.3–100.0) 93.1 (89.3–96.0) 44.8 (31.7–58.5) 92.1 (87.3–95.5) 81.0 (75.6–85.7) 13.2 (4.4–28.1) 99.0 (96.6–99.9) 85.9 (80.9–90.0) Higher education 81.3
(54.4–96.0) 98.4 (95.5–99.7) 97.1 (93.9–98.9) 50.0 (27.2–72.8) 96.8 (93.2–98.8) 92.3 (87.9–95.6) 10.5 (1.3–33.1) 98.9 (96.2–99.9) 90.9 (86.2–94.4) Lower income 68.4
(51.3–82.5) 99.5 (97.3–100.0) 94.6 (91.0–97.1) 43.8 (29.5–58.8) 94.3 (90.0–97.1) 84.2 (79.0–88.6) 12.5 (2.7–32.4) 98.2 (95.3–99.5) 89.6 (85.1–93.2) (Continued)
Associations with agreement: results
from stratifications and regression
analysis
Associations of participant characteristics with strengths of agreement between self-reports and health insurance data are shown in Tables 4 and 5. In univariate analyses, higher age,
Clinical Epidemiology downloaded from https://www.dovepress.com/ by 118.70.13.36 on 20-Aug-2020
Dovepress
Hoffmann et al
Table 4 (Continued)
Subgroups (strata)
Myocardial infarction Heart failure Impaired cerebral blood flow
Sensitivity (95% CI) Specificity (95% CI) Agreement (95% CI) Sensitivity (95% CI) Specificity (95% CI) Agreement (95% CI) Sensitivity (95% CI) Specificity (95% CI) Agreement (95% CI)
Higher income 64.7 (38.3–85.8) 98.7 (95.4–99.8) 95.3 (90.9–97.9) 55.0 (31.5–76.9) 94.7 (89.8–97.7) 90.0 (84.5–94.1) 15.4 (4.4–34.9) 100.0 (97.5–100.0) 87.1 (81.1–91.7) VAS ≤75 65.9
(50.1–79.5) 99.1 (96.8–99.9) 93.6 (90.0–96.2) 51.8 (38.0–65.3) 92.4 (87.9–95.6) 83.8 (78.8–88.0) 11.9 (4.0–25.6) 98.2 (95.5–99.5) 84.6 (79.7–88.7) VAS >75 71.4
(41.9–91.6) 98.9 (96.1–99.9) 96.9 (93.5–98.9) 30.4 (13.2–52.9) 97.1 (93.4–99.1) 89.3 (84.1–93.2) 13.3 (1.7–40.5) 100.0 (98.0–100.0) 93.4 (88.9–96.4) No. of chronic
diseases ≤5
85.7 (42.1–99.6) 98.8 (96.6–99.8) 98.5 (96.1–99.6) 23.1 (5.0–53.8) 98.8 (96.5–99.7) 95.0 (91.6–97.3) 0.0 (0.0–24.7) 99.6 (97.8–100.0) 94.6 (91.2–97.0) No. of chronic
diseases >5
64.7 (50.1–77.6) 99.3 (96.4–100.0) 90.6 (85.8–94.3) 50.0 (37.4–62.6) 86.9 (80.0–92.0) 74.9 (68.3–80.7) 15.9 (6.6–30.1) 98.1 (94.6–99.6) 80.3 (74.1–85.5) Diabetes duration
<10 years
73.7 (48.8–90.9) 98.8 (95.7–99.9) 96.2 (92.4–98.5) 37.5 (18.8–59.4) 92.0 (86.7–95.7) 84.9 (79.0–89.8) 0.0 (0.0–33.6) 99.4 (96.9–100.0) 94.6 (90.3–97.4) Diabetes duration
≥10 years
64.1 (47.2–78.8) 99.2 (97.0–99.9) 94.2 (90.8–96.7) 49.1 (35.4–62.9) 96.4 (93.1–98.4) 87.1 (82.5–90.8) 14.6 (6.1–27.8) 98.7 (96.2–99.7) 84.2 (79.3–88.3)
Stroke/Apoplexy Transient ischemic attack Eye diseases
Age <65 years 41.7 (15.2–72.3) 99.2 (97.3–99.9) 96.8 (93.9–98.5) 0.0 (0.0–97.5) 97.8 (95.3–99.2) 97.5 (94.9–99.0) 19.4 (14.2–25.6) 97.4 (90.8–99.7) 40.8 (35.0–46.8) Age ≥65 years 36.7
(19.9–56.1) 99.4 (96.5–100.0) 89.3 (84.0–93.3) 16.7 (0.4–64.1) 98.3 (95.2–99.7) 95.7 (91.7–98.1) 41.3 (33.8–49.2) 80.0 (56.3–94.3) 45.5 (38.2–52.9) Female 33.3 (11.8–61.6) 99.4 (96.7–100.0) 94.0 (89.5–97.0) 0.0 (0.0–70.8) 98.9 (96.0–99.9) 97.3 (93.7–99.1) 29.8 (22.6–37.8) 100.0 (89.1–100.0) 42.1 (34.8–49.6) Male 40.7 (22.4–61.2) 99.2 (97.2–99.9) 93.6 (90.1–96.2) 25.0 (0.6–80.6) 97.5 (94.9–99.0) 96.4 (93.6–98.3) 29.0 (23.1–35.6) 90.6 (80.7–96.5) 43.1 (37.2–49.1) Lower education 35.5
(19.2–54.6) 99.1 (96.7–99.9) 91.1 (86.9–94.4) 0.0 (0.0–45.9) 97.9 (95.2–99.3) 95.6 (92.2–97.8) 33.7 (27.2–40.6) 90.7 (77.9–97.4) 43.5 (37.3–50.0) Higher education 45.5
(16.7–76.6) 99.5 (97.2–100.0) 96.7 (93.2–98.6) 100.0 (2.5–100.0) 98.1 (95.1–99.5) 98.1 (95.2–99.5) 24.8 (18.3–32.4) 96.2 (86.8–99.5) 42.6 (35.8–49.6) Lower income 47.8
(26.8–69.4) 99.1 (96.7–99.9) 94.2 (90.4–96.8) 50.0 (1.3–98.7) 97.9 (95.2–99.3) 97.5 (94.7–99.1) 32.5 (25.9–39.6) 97.9 (88.7–99.9) 45.2 (38.8–51.7) Higher income 27.3
(6.0–61.0) 99.4 (96.5–100.0) 94.7 (90.2–97.6) 0.0 (0.0–60.2) 98.2 (94.8–99.6) 95.9 (91.7–98.3) 23.9 (16.9–32.0) 91.7 (77.5–98.2) 38.2 (30.9–46.0) VAS ≤75 40.6
(23.7–59.4) 99.1 (96.9–99.9) 92.1 (88.2–95.0) 14.3 (0.4–57.9) 97.3 (94.5–98.9) 95.1 (91.8–97.4) 33.8 (27.5–40.5) 90.0 (78.2–96.7) 44.4 (38.3–50.6) VAS >75 30.0
(6.7–65.2) 99.5 (97.0–100.0)
95.9 (92.1–98.2)
Not estimable 99.0 (96.4–99.9) 99.0 (96.4–99.9) 23.2 (16.7–30.7) 97.8 (88.2–99.9) 40.3 (33.4–47.5) No. of chronic
diseases ≤5
28.6 (3.7–71.0) 99.2 (97.2–99.9) 97.3 (94.6–98.9)
Not estimable 98.9 (96.7–99.8) 98.9 (96.7–99.8) 16.8 (11.7–22.9) 97.4 (90.8–99.7) 40.2 (34.2–46.5) No. of chronic
diseases >5
40.0 (23.9–57.9) 99.4 (96.7–100.0) 89.2 (84.1–93.1) 14.3 (0.4–57.9) 96.9 (93.5–98.9) 94.1 (89.9–96.9) 42.1 (34.8–49.6) 80.0 (56.3–94.3) 45.8 (38.8–52.9) Diabetes duration
<10 years
62.5 (24.5–91.5) 98.3 (95.2–99.7) 96.8 (93.1–98.8) 0.0 (0.0–84.2) 98.4 (95.3–99.7) 97.3 (93.8–99.1) 15.2 (9.5–22.4) 92.6 (82.1–97.9) 37.6 (30.7–45.0) Diabetes duration
≥10 years
32.4 (17.4–50.5) 100.0 (98.5–100.0) 91.7 (87.8–94.7) 20.0 (0.5–71.6) 97.8 (95.3–99.2) 96.4 (93.5–98.3) 37.3 (31.1–43.8) 95.2 (83.8–99.4) 46.0 (40.1–52.1)
Peripheral neuropathy (leg) Foot ulcerations Kidney disease
Age <65 years 51.0 (40.6–61.4) 87.3 (81.5–91.8) 74.7 (69.2–79.7) 21.1 (6.1–45.6) 97.7 (95.0–99.1) 92.4 (88.6–95.2) 38.3 (24.5–53.6) 98.7 (96.2–99.7) 88.4 (84.1–92.0) Age ≥65 years 63.2
(53.6–72.0) 82.2 (71.5–90.2) 70.6 (63.5–77.0) 38.5 (23.4–55.4) 97.3 (93.2–99.3) 85.0 (79.1–89.8) 41.0 (30.3–52.3) 94.2 (87.9–97.9) 70.6 (63.5–77.0) Female 54.9 (42.7–66.8) 84.8 (76.8–90.9) 73.2 (66.2–79.5) 14.3 (1.8–42.8) 97.6 (94.1–99.4) 91.3 (86.2–94.9) 35.0 (20.6–51.7) 96.5 (92.0–98.9) 83.1 (76.8–88.2) Male 59.0 (50.3–67.3) 86.6 (79.9–91.7) 73.0 (67.4–78.1) 38.6 (24.4–54.5) 97.5 (94.6–99.1) 88.3 (83.9–91.8) 42.2 (31.9–53.1) 97.9 (94.7–99.4) 80.1 (74.9–84.6) Lower education 63.5
(54.4–71.9) 80.3 (72.2–87.0) 71.8 (65.7–77.3) 32.5 (18.6–49.1) 97.6 (94.5–99.2) 87.1 (82.3–91.0) 38.8 (28.4–50.0) 97.5 (93.8–99.3) 77.4 (71.7–82.5) Higher education 49.4
(38.2–60.6) 90.5 (84.0–95.0) 74.2 (67.7–80.0) 33.3 (13.3–59.0) 97.4 (94.0–99.1) 91.9 (87.3–95.2) 41.9 (27.0–57.9) 97.0 (93.1–99.0) 85.6 (80.1–90.1) (Continued)
Clinical Epidemiology downloaded from https://www.dovepress.com/ by 118.70.13.36 on 20-Aug-2020
Dovepress Diabetes-related comorbidities in self-reported and administrative data
Table 4 (Continued)
Subgroups (strata)
Peripheral neuropathy (leg) Foot ulcerations Kidney disease
Sensitivity Specificity Agreement Sensitivity Specificity Agreement Sensitivity Specificity Agreement
Lower income 60.3 (50.8–69.3)
85.6 (78.2–91.2)
73.4 (67.4–78.9)
36.1 (20.8–53.8)
97.1 (93.7–98.9)
88.0 (83.2–91.8)
37.8 (26.8–49.9)
97.0 (93.2–99.0)
78.8 (73.1–83.8) Higher income 54.4
(41.9–66.5) 85.3 (76.9–91.5)
72.9 (65.6–79.5)
20.0 (4.3–48.1)
98.1 (94.4–99.6)
91.2 (85.9–95.0)
41.0 (25.6–57.9)
98.5 (94.6–99.8)
85.3 (79.1–90.3) VAS ≤75 58.8
(50.4–66.8) 78.8 (70.3–85.8)
67.7 (61.7–73.3)
32.5 (18.6–49.1)
96.0 (92.6–98.2)
86.5 (81.8–90.3)
45.9 (35.0–57.0)
95.6 (91.5–98.1)
79.7 (74.4–84.4) VAS >75 55.7
(42.4–68.5) 91.9 (85.9–95.9)
80.6 (74.4–85.9)
33.3 (13.3–59.0)
99.4 (96.9–100.0)
93.4 (88.9–96.4)
29.5 (16.8–45.2)
99.3 (96.4–100.0)
83.7 (77.7–88.6) No. of chronic
diseases ≤5
47.4 (36.0–59.1)
88.5 (83.0–92.8)
76.2 (70.6–81.3)
25.0 (5.5–57.2)
97.6 (94.8–99.1)
94.3 (90.7–96.7)
23.5 (10.7–41.2)
98.2 (95.5–99.5)
88.5 (84.0–92.1) No. of chronic
diseases >5
63.6 (54.8–71.8)
78.9 (67.6–87.7)
69.0 (62.1–75.3)
34.8 (21.4–50.2)
97.5 (93.6–99.3)
83.3 (77.4–88.1)
45.8 (35.6–56.3)
95.3 (89.4–98.5)
71.9 (65.2–78.0) Diabetes duration
<10 years
44.4 (31.9–57.5)
83.7 (76.0–89.8)
70.4 (63.3–76.9)
25.0 (3.2–65.1)
97.8 (94.3–99.4)
94.6 (90.3–97.4)
44.4 (27.9–61.9)
96.7 (92.4–98.9)
86.6 (80.8–91.1) Diabetes duration
≥10 years
63.3 (54.9–71.1)
87.8 (80.9–92.9)
74.8 (69.3–79.8)
34.0 (21.2–48.8)
97.4 (94.4–99.0)
86.0 (81.3–89.8)
38.3 (28.5–48.9)
97.8 (94.5–99.4)
77.7 (72.3–82.5)
Notes: Non-estimable sensitivities: no diseased patients in the subgroup. Patients with missing values excluded from analyses.
Abbreviation: VAS, visual analog scale.
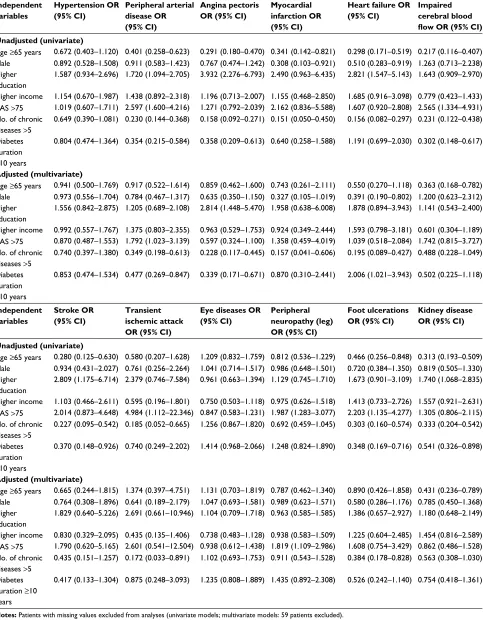
male sex, having more than five chronic comorbidities, and long diabetes duration (≥10 years) were associated with a lower agreement in several comorbidities (exception: higher agreement for heart failure after longer diabetes duration), and higher education and a better quality of life with higher agreement. Additionally, stratified sensitivities and specifici-ties are shown in Table 3. After adjustment in multivariate analyses, only a few significant associations remained. Most associations were seen as having more than five chronic comorbidities. This was associated with a lower agreement for peripheral vascular disease, angina pectoris, MI, heart failure, TIA, and foot ulceration. Further, higher age was associated with lower agreement for impaired cerebral blood flow and kidney disease, male sex with lower agreement for heart failure, and higher education with a higher agreement for angina pectoris.
Discussion
Main findings and possible explanations
To the best of our knowledge, this is the first study dealing with analysis agreement between self-reported diabetes-related comorbidities and health insurance data. We found that the agreement was high for some diabetes-related comorbidities such as MI, amputation, and hypertension; it was moderate for the comorbidities angina pectoris, stroke, peripheral neuropathy in the lower extremities, and kidney disease, and quite low for other comorbidities such as eye diseases and foot ulceration. A higher number of chronic comorbidities, long diabetes duration, and higher age were
associated with lower agreement, and higher education with higher agreement. The exceptional higher agreement for heart failure with longer diabetes duration results at least partly from combined confounding of the other factors, in particular chronic comorbidities.
High agreement was found in cases of MI, amputations, and hypertension. MI and amputations are incisive events in life, whereas patients suffering from hypertension have to cope daily with the disease because of the often-permanent need for medication. All three comorbidities have a clear, specific designation and are well known to the general public, so that differing interpretations of the questions by the study participants are not likely. This observation was found in a number of studies that analyzed agreement between self-reported and routine care data.13
There was a moderate degree of agreement for the comorbidities angina pectoris, stroke, peripheral neuropathy, and kidney disease. The conditions are normally manifested by a gradual process, revealing at first only little or no impairment or symptoms in everyday life. It is possible that the less specifically named diagnosis and the fact that the clinical criteria are less known to the general public might lead the study participants to assume that they are not suf-fering from one of these comorbidities, although this is not shown in the health insurance data, which would explain the low sensitivities for angina pectoris, neuropathy, and kidney disease.
The low sensitivity found for an apoplexy could be because of the fact that the stroke occurred over 12 months
Clinical Epidemiology downloaded from https://www.dovepress.com/ by 118.70.13.36 on 20-Aug-2020
Dovepress
Hoffmann et al
Table 5 Odds ratios with respect to agreement from univariate and multivariate logistic regression models
Independent variables
Hypertension OR (95% CI)
Peripheral arterial disease OR (95% CI)
Angina pectoris OR (95% CI)
Myocardial infarction OR (95% CI)
Heart failure OR (95% CI)
Impaired cerebral blood
flow OR (95% CI)
Unadjusted (univariate)
Age ≥65 years 0.672 (0.403–1.120) 0.401 (0.258–0.623) 0.291 (0.180–0.470) 0.341 (0.142–0.821) 0.298 (0.171–0.519) 0.217 (0.116–0.407) Male 0.892 (0.528–1.508) 0.911 (0.583–1.423) 0.767 (0.474–1.242) 0.308 (0.103–0.921) 0.510 (0.283–0.919) 1.263 (0.713–2.238) Higher
education
1.587 (0.934–2.696) 1.720 (1.094–2.705) 3.932 (2.276–6.793) 2.490 (0.963–6.435) 2.821 (1.547–5.143) 1.643 (0.909–2.970) Higher income 1.154 (0.670–1.987) 1.438 (0.892–2.318) 1.196 (0.713–2.007) 1.155 (0.468–2.850) 1.685 (0.916–3.098) 0.779 (0.423–1.433) VAS >75 1.019 (0.607–1.711) 2.597 (1.600–4.216) 1.271 (0.792–2.039) 2.162 (0.836–5.588) 1.607 (0.920–2.808) 2.565 (1.334–4.931) No. of chronic
diseases >5
0.649 (0.390–1.081) 0.230 (0.144–0.368) 0.158 (0.092–0.271) 0.151 (0.050–0.450) 0.156 (0.082–0.297) 0.231 (0.122–0.438) Diabetes
duration ≥10 years
0.804 (0.474–1.364) 0.354 (0.215–0.584) 0.358 (0.209–0.613) 0.640 (0.258–1.588) 1.191 (0.699–2.030) 0.302 (0.148–0.617)
Adjusted (multivariate)
Age ≥65 years 0.941 (0.500–1.769) 0.917 (0.522–1.614) 0.859 (0.462–1.600) 0.743 (0.261–2.111) 0.550 (0.270–1.118) 0.363 (0.168–0.782) Male 0.973 (0.556–1.704) 0.784 (0.467–1.317) 0.635 (0.350–1.150) 0.327 (0.105–1.019) 0.391 (0.190–0.802) 1.200 (0.623–2.312) Higher
education
1.556 (0.842–2.875) 1.205 (0.689–2.108) 2.814 (1.448–5.470) 1.958 (0.638–6.008) 1.878 (0.894–3.943) 1.141 (0.543–2.400) Higher income 0.992 (0.557–1.767) 1.375 (0.803–2.355) 0.963 (0.529–1.753) 0.924 (0.349–2.444) 1.593 (0.798–3.181) 0.601 (0.304–1.189) VAS >75 0.870 (0.487–1.553) 1.792 (1.023–3.139) 0.597 (0.324–1.100) 1.358 (0.459–4.019) 1.039 (0.518–2.084) 1.742 (0.815–3.727) No. of chronic
diseases >5
0.740 (0.397–1.380) 0.349 (0.198–0.613) 0.228 (0.117–0.445) 0.157 (0.041–0.606) 0.195 (0.089–0.427) 0.488 (0.228–1.049) Diabetes
duration ≥10 years
0.853 (0.474–1.534) 0.477 (0.269–0.847) 0.339 (0.171–0.671) 0.870 (0.310–2.441) 2.006 (1.021–3.943) 0.502 (0.225–1.118)
Independent variables
Stroke OR (95% CI)
Transient ischemic attack OR (95% CI)
Eye diseases OR (95% CI)
Peripheral neuropathy (leg) OR (95% CI)
Foot ulcerations OR (95% CI)
Kidney disease OR (95% CI)
Unadjusted (univariate)
Age ≥65 years 0.280 (0.125–0.630) 0.580 (0.207–1.628) 1.209 (0.832–1.759) 0.812 (0.536–1.229) 0.466 (0.256–0.848) 0.313 (0.193–0.509) Male 0.934 (0.431–2.027) 0.761 (0.256–2.264) 1.041 (0.714–1.517) 0.986 (0.648–1.501) 0.720 (0.384–1.350) 0.819 (0.505–1.330) Higher
education
2.809 (1.175–6.714) 2.379 (0.746–7.584) 0.961 (0.663–1.394) 1.129 (0.745–1.710) 1.673 (0.901–3.109) 1.740 (1.068–2.835) Higher income 1.103 (0.466–2.611) 0.595 (0.196–1.801) 0.750 (0.503–1.118) 0.975 (0.626–1.518) 1.413 (0.733–2.726) 1.557 (0.921–2.631) VAS >75 2.014 (0.873–4.648) 4.984 (1.112–22.346) 0.847 (0.583–1.231) 1.987 (1.283–3.077) 2.203 (1.135–4.277) 1.305 (0.806–2.115) No. of chronic
diseases >5
0.227 (0.095–0.542) 0.185 (0.052–0.665) 1.256 (0.867–1.820) 0.692 (0.459–1.045) 0.303 (0.160–0.574) 0.333 (0.204–0.542) Diabetes
duration ≥10 years
0.370 (0.148–0.926) 0.740 (0.249–2.202) 1.414 (0.968–2.066) 1.248 (0.824–1.890) 0.348 (0.169–0.716) 0.541 (0.326–0.898)
Adjusted (multivariate)
Age ≥65 years 0.665 (0.244–1.815) 1.374 (0.397–4.751) 1.131 (0.703–1.819) 0.787 (0.462–1.340) 0.890 (0.426–1.858) 0.431 (0.236–0.789) Male 0.764 (0.308–1.896) 0.641 (0.189–2.179) 1.047 (0.693–1.581) 0.989 (0.623–1.571) 0.580 (0.286–1.176) 0.785 (0.450–1.368) Higher
education
1.829 (0.640–5.226) 2.691 (0.661–10.946) 1.104 (0.709–1.718) 0.963 (0.585–1.585) 1.386 (0.657–2.927) 1.180 (0.648–2.149) Higher income 0.830 (0.329–2.095) 0.435 (0.135–1.406) 0.738 (0.483–1.128) 0.938 (0.583–1.509) 1.225 (0.604–2.485) 1.454 (0.816–2.589) VAS >75 1.790 (0.620–5.165) 2.601 (0.541–12.504) 0.938 (0.612–1.438) 1.819 (1.109–2.986) 1.608 (0.754–3.429) 0.862 (0.486–1.528) No. of chronic
diseases >5
0.435 (0.151–1.257) 0.172 (0.033–0.891) 1.102 (0.693–1.753) 0.911 (0.543–1.528) 0.384 (0.178–0.828) 0.563 (0.308–1.030) Diabetes
duration ≥10 years
0.417 (0.133–1.304) 0.875 (0.248–3.093) 1.235 (0.808–1.889) 1.435 (0.892–2.308) 0.526 (0.242–1.140) 0.754 (0.418–1.361)
Notes: Patients with missing values excluded from analyses (univariate models; multivariate models: 59 patients excluded).
Abbreviations: OR, odds ratio; VAS, visual analog scale.
Clinical Epidemiology downloaded from https://www.dovepress.com/ by 118.70.13.36 on 20-Aug-2020
Dovepress Diabetes-related comorbidities in self-reported and administrative data
before (the period in question), but that the occurrence was still to be found in the health insurance data.26
The possibility of ambiguous interpretation, unknown clinical criteria, and an asymptomatic progression of the disease, which often shows itself later, may all have contrib-uted to the numerous disagreeing data for the comorbidity of heart failure.
With regard to eye diseases, there was low agreement between the self-reported data and the data from the SHIs. Patients with diabetes are recommended to have their eyes examined regularly.27 It may be assumed that the eye specialist
will make a series of diagnoses that seem to be less illness-relevant for the patient and remain therefore unmentioned by him or her.
The agreement between the self-reported data on foot ulcerations (badly healing ulcers, infections, or wounds on the feet) and the data from the SHIs can be described only as “satisfactory”. Here it is difficult to find a suitable expla-nation. It is difficult to describe diabetic foot ulceration for the patients, and, in particular, there is no specific ICD code. The lowest agreement (corresponding to kappa) between the self-reported data and that from the SHIs was found for impaired cerebral blood flow, TIAs, and eye diseases. Here only a few of the self-reported data could be confirmed by the secondary data and vice versa. The study participants were probably unfamiliar with the definition of a TIA, and diagnoses of TIAs received the ICD code for apoplexy in the secondary data. However, the case numbers were low (n=7).
Regarding factors that may affect agreement, a higher number of comorbidities was particularly associated with lower agreement. Further, a higher age and male sex were associated with lower agreement, whereas agreement was higher in more highly educated patients. A lower agreement with higher age and a higher number of comorbidities has been found in several other studies.13–15,28–32
Limitations and strengths
Limitations
Several limitations have to be considered: 1) This study is based on data collected from patients from a single practice specializing in diabetes, and from one single SHI. Patients from specialized practices are more likely to have an unfavor-able progression of their illness, which requires specialized treatment. For this reason the results cannot be applied to the whole diabetic population. 2) As is common to other studies, the health insurance data regarding the diagnosis of an indi-vidual participant are defined as “closer to the truth” when compared with the self-reported data provided by the same participant. Thus, the individual data concerning sensitivity,
specificity, NPVs, and PPVs of a comorbidity were calculated according to the health insurance data. However, the health insurance data are also susceptible to errors, not least because the financial compensation for the physicians depends greatly on the diagnoses billed. 3) Another of this study’s limitations is the lack of a standardized translation of the self-reported data into ICD codes. However, the translation of the comorbidities into ICD codes was checked according to the dual-control principle with the assistance of a physi-cian who was familiar with the method. However, a certain amount of subjectivity could not be ruled out. For some of the comorbidities, for example impaired cerebral blood flow, it remains questionable as to how far they can be translated into ICD codes corresponding to those used by physicians. 4) Some events like amputation or MI may have occurred >12 months before and yet still be documented in the SHI data. In this case, the patient’s self-report would be correct. This could explain the low sensitivity for MI in our data. 5) In some comorbidities, only a few cases were observed, which implies imprecise estimates and low power in regression analyses (in particular for TIA, amputations, and dialysis). In these cases descriptive results should be in the primary focus, and estimates from multiple regression (Table 5) should be interpreted with great caution. 6) Finally, we restricted the regression analyses to one outcome to obtain a manageable number of results. We chose “agreement” because a main focus was to investigate the use of self-reports for epidemio-logic studies. Furthermore, “agreement” was often used in other publications.12,13
Strengths
1) When making the self-report in the questionnaire, the study participant was always able to call on one of the study assistants for help, if necessary. This means that a positive influence on the correctness and completeness of the statements made by a study participant can be expected. 2) In contrast to other studies, patients who had not reported comorbidities were also included in the analysis, reducing bias from underreporting. 3) Finally, the SHI data were subjected to detailed plausibility and com-pleteness checks. Altogether, high data quality can be assumed.
Implications of the study findings and
conclusions
Our study has important implications. First, patients’ awareness of their own diabetes-related comorbidities, which is urgently needed for effective self-management, seems to be limited. Patients with diabetes have a substantial need for information, but a large proportion of patients with diabetes have stated that they are not well informed about the disease. Hence,
Clinical Epidemiology downloaded from https://www.dovepress.com/ by 118.70.13.36 on 20-Aug-2020
Dovepress
Hoffmann et al
more effort should be made to provide diabetic patients with effective information. Second, when we use self-reported data to adjust for comorbidity in observational studies, we have to take into consideration that the validity of the data is limited.
Acknowledgments
We would like to thank Prof. Harald Abholz for his valuable support in the project. We also thank all patients for their participation in the study.
Disclosure
The authors report no conflicts of interest in this work.
References
1. IDF Diabetes Atlas 2015. 7th ed. Available from: http://www.diabete-satlas.org/. Accessed February 08, 2018.
2. Icks A, Dickhaus T, Hörmann A, et al. Differences in trends in estimated incidence of myocardial infarction in non-diabetic and diabetic people: Monitoring Trends and Determinants on Cardiovascular Diseases (MONICA)/Cooperative Health Research in the Region of Augsburg (KORA) registry. Diabetologia. 2009;52(9):1836–1841.
3. Icks A, Haastert B, Gandjour A, et al. Costs of dialysis–a regional popu-lation-based analysis. Nephrol Dial Transplant. 2010;25(5):1647–1652. 4. Icks A, Scheer M, Morbach S, et al. (2011). Time-dependent impact of
diabetes on mortality in patients after major lower extremity amputa-tion: survival in a population-based 5-year cohort in Germany. Diabetes Care. 2011;34(6):1350–1354.
5. Icks A, Claessen H, Morbach S, Glaeske G, Hoffmann F. Time dependent impact of diabetes on mortality in patients with stroke: survival up to 5 years in a health insurance population cohort in Germany. Diabetes Care. 2012;35(9):1868–1875.
6. Genz J, Scheer M, Trautner C, Zöllner I, Giani G, Icks A. Reduced incidence of blindness in relation to diabetes mellitus in southern Germany? Diabet Med. 2010;27(10):1138–1143.
7. Association of the British Pharmaceutical Industry: The Diabetes Infor-mation Jigsaw. Report investigating Information Access for People with Diabetes; 2006. Available from: http://www.abpi.org.uk/media/1395/ diabetes_jigsaw.pdf. Accessed February 21, 2018.
8. Bongaerts BW, Rathmann W, Heier M, et al. Older subjects with diabetes and prediabetes are frequently unaware of having distal sensorimotor poly-neuropathy: the KORA F4 study. Diabetes Care. 2013;36(5):1141–1146. 9. Ahola AJ, Groop PH. Barriers to self-management of diabetes. Diabet
Med. 2013;30(4):413–420.
10. Duggan C, Bates I. Medicine information needs of patients: the rela-tionships between information needs, diagnosis and disease. Qual Saf Health Care. 2008;17(2):85–89.
11. Peel E, Parry O, Douglas M, and Lawton J. Diagnosis of type 2 diabetes: a qualitative analysis of patients’ emotional reactions and views about information provision. Patient Educ Couns. 2004;53(3): 269–275. 12. Merkin SS, Cavanaugh K, Longenecker JC, Fink NE, Levey AS, Powe
NR. Agreement of self-reported comorbid conditions with medical and physician reports varied by disease among end-stage renal disease patients. J Clin Epidemiol. 2007;60(6):634–642.
13. Okura Y, Urban LH, Mahoney DW, Jacobsen SJ, Rodeheffer RJ. Agree-ment between self-report questionnaires and medical record data was substantial for diabetes, hypertension, myocardial infarction and stroke but not for heart failure. J Clin Epidemiol. 2004;57(10):1096–1103. 14. Simpson CF, Boyd CM, Carlson MC, Griswold ME, Guralnik JM, Fried
LP. Agreement between self-report of disease diagnoses and medical record validation in disabled older women: factors that modify agree-ment. J Am Geriatr Soc. 2004;52(1):123–127.
15. Tisnado DM, Adams JL, Liu H, et al. What is the concordance between the medical record and patient self-report as data sources for ambulatory care? Med Care. 2006;44(2):132–140.
16. Chernyak N, Petrak F, Plack K, et al. Cost-effectiveness analysis of cognitive behaviour therapy for treatment of minor or mild-major depression in elderly patients with type 2 diabetes: study protocol for the economic evaluation alongside the MIND-DIA randomized controlled trial (MIND-DIA CEA). BMC Geriatrics. 2009;9:25.
17. Chernyak N, Kulzer B, Hermanns N, et al. Study protocol: within-trial economic evaluation of diabetes-specific cognitive behaviour therapy in patients with type 2 diabetes and subthreshold depression. BMC Public Health. 2010;10:625.
18. Chernyak N, Ernsting C, Icks A. Pre-test of questions on health-related resource use and expenditure, using behaviour coding and cognitive interviewing techniques. BMC Health Serv Res. 2012;12(1):303. 19. Hoffmeyer-Zlotnik JHP, Warner U. How to survey education for
cross-national comparison: the Hoffmeyer-Zlotnik/Warner-Matrix of education. Metodoloski zvezki. 2007;4(2):117–148.
20. Ahrens W, Bellach BM, Jöckel KH, editors. Messung Soziodemogra-phischer Merkmale in der Epidemiologie [Measurement of sociode-mographic characteristics in epidemiology]. München: MMV Medizin Verlag; 1998.
21. Rabin R, de Charro F. EQ-D5: a measure of health status from the EuroQol Group. Ann Med. 2001;33(5):337–343.
22. Van den Busche H, Schäfer I, Wiese B, et al. A comparative study demonstrated that prevalence figures on multimorbidity in the elderly require cautious interpretion when drawn from a single database. J Clin Epidemiol. 2013;66:209–217.
23. Thompson WD, Walter SD. Reappraisal of the kappa coefficient. J Clin Epidemiol. 1988;41:949–958.
24. Landis JR, Koch GG. The measurement of observer agreement for categorical data. Biometrics. 1977;33:159–174.
25. Schramm A, Kugler J. Analyse der ambulanten Kodierqualität in Sachsen und Thüringen anhand von Routinedaten der AOK PLUS–die Verwendung des Z-Zusatzkennzeichens in der Diagnosedokumentation [Analysis of the outpatient coding quality in Saxony and Thuringia on basis of routine data from the AOK PLUS - the use of the Z indicator in the diagnosis documentation]. Gesundheitswesen. 2012;74-A109. 26. Hammes H-P. Diabetes und Augenerkrankungen. In: Diabetes
DE-Deutsche Diabetes-Hilfe, Hrsg. Deutscher Gesundheitsbericht Dia-betes [Diabetes and eye diseases]. Mainz: Kirchheim Verlag, 2013: 105–113.
27. Skinner KM, Miller DR, Lincoln E, Lee A, Kazis LE. Concordance between respondent self-reports and medical records for chronic conditions. Experience from the Veterans Health Study. J Ambul Care Manage. 2005;28(2):102–100.
28. Haapanen N, Miilunpalo S, Pasanen M, Oja P, Vuori I. Agreement between questionnaire data and medical records of chronic diseases in middle-aged and elderly finish men and women. Am J Epidemiol. 1997;145(8):762–769.
29. Mohangoo AD, van der Linden MW, Schellevis FG, Raat H. Prevalence estimates of asthma or COPD from a health interview survey and from general practitioner registration: what’s the difference? Eur J Public Health. 2006;16(1):101–105.
30. Corser W, Sikorskii A, Olomu A, Stommel M, Proden C, Holmes-Royner M. Concordance between comorbidity data from patient self-report interviews and medical record documentation. BMC Health Serv Res. 2008;8:85.
31. Hansen H, Schäfer I, Schön G, et al. Agreement between self-reported and general practitioner-reported chronic conditions among multimor-bid patients in primary care–results of the MultiCare cohort study. BMC Family Practice. 2014;15(1):39.
32. Diederichs C, Bartels DB, Berger K. Methodische Herausforderungen bei der Auswahl von Erkrankungen für einen standardisierten Multimor-biditätsindex [Methodological challenges in the selection of diseases for a standardized multimorbidity index]. Bundesgesundheitsblatt Gesundheitsforschung Gesundheitsschutz. 2011;54(8):972–978.
Clinical Epidemiology downloaded from https://www.dovepress.com/ by 118.70.13.36 on 20-Aug-2020
Dovepress
Clinical Epidemiology
Publish your work in this journal
Submit your manuscript here: https://www.dovepress.com/clinical-epidemiology-journal
Clinical Epidemiology is an international, peer-reviewed, open access, online journal focusing on disease and drug epidemiology, identifica-tion of risk factors and screening procedures to develop optimal pre-ventative initiatives and programs. Specific topics include: diagnosis, prognosis, treatment, screening, prevention, risk factor modification,
systematic reviews, risk and safety of medical interventions, epidemiol-ogy and biostatistical methods, and evaluation of guidelines, translational medicine, health policies and economic evaluations. The manuscript management system is completely online and includes a very quick and fair peer-review system, which is all easy to use.
Dove
press
Diabetes-related comorbidities in self-reported and administrative data
Supplementary material
Original question and comorbidities in
the patient questionnaire
Please indicate which of these diseases you have or have had in the past 12 months. These are the medical conditions that your doctor has identified with you.
Hypertension (high blood pressure); peripheral arterial occlusive disease (nicknamed “window-shopping disease” in German: pain in the legs or calves while walking, which is why one must stop walking for the pain to subside); circula-tory disorders of the heart (angina pectoris); heart attack; heart failure (cardiac insufficiency); blood circulation disor-der of the brain; stroke; transient ischemic attack (transient bleeding disorder of the brain with stroke-like symptoms); disorders of the eyes (e.g., eye damage, cataract); disorders of
the nerves in the legs (e.g., burning, tingling, or numbness); inflammations, ulcers, or wounds on the feet that are healing badly; amputation of feet/legs; disorders of the kidney (e.g., excretion of protein in the urine); dialysis-compulsory (blood-cleansing); cancer disease (malignant tumor); thyroid disease; gout; chronic (persistent) back pain; inflammatory articular or spinal disease (e.g., arthritis); other joint or spinal disorders; stomach or duodenal ulcer or chronic gastric mucosa inflam-mation; inflammatory disease (e.g., ulcerative colitis, Crohn’s disease); other indications; gallstones; common urinary tract infections (bladder infections); chronic liver inflammation (hepatitis); allergy(s), hay fever; bronchial asthma; chronic bronchitis or chronic obstructive pulmonary disease; anae-mia; chronic skin diseases (e.g., neurodermatitis, psoriasis); migraine; epilepsy; Parkinson’s disease; depression.
Clinical Epidemiology downloaded from https://www.dovepress.com/ by 118.70.13.36 on 20-Aug-2020