International Journal of Research (IJR)
e-ISSN: 2348-6848, p- ISSN: 2348-795X Volume 2, Issue 08, August 2015Available at http://internationaljournalofresearch.org
Probability based color image segmentation using accelerated
particle swarm optimization
Malvika
M.Tech Research Scholar, ECED, Punjabi University, Patiala, Punjab, India
Er. Amandeep Singh Bhandari
Assistant Professor, ECED, Punjabi University, Patiala, Punjab, India EMAIL: [email protected]
Abstract
The paper provides a detailed study of the image segmentation on CAPTCHA images. We planned a fast segmentation method for CAPTCHA images. The technique regards threshold estimation as a search process and employs Accelerated PSO algorithm to optimize it. In order to provide Accelerated PSO algorithm with an efficient fitness function, we integrate the concept of grey number in Grey theory, maximum conditional entropy to get an improved two-dimensional grey entropy. In essence, the fast segmentation speed of our method owes to Accelerated PSO algorithm, which has an outstanding convergence performance. On the other hand, the segmentation quality of our method is benefit from the improved two-dimensional grey entropy, for the fact that noise almost completely disappears. Experimental results indicate that our method is superior to GA based, AFS based and ABC based methods in terms of segmentation accuracy, segmentation time, and Thresholding.
1. Introduction
The word digital image processing generally denotes to processing of a two-dimensional picture by a digital computer[1][2]. In a broader situation, it implies digital processing of any plane data. A digital image is an array of actual numbers signified by a finite number of bits. The advantage of Digital Image Processing approaches is its repeatability, versatility and the preservation of original data precision. The common phases in image
processing are image scanning, storage, enhancing and explanation.
Image processing is a technique to transform an image into digital form and perform some actions on it, in order to acquire an enhanced image or to extract some valuable information from it. It is a kind of signal dispensation in which input is image, like video surround or picture and productivity may be image or features related with that image. Usually Image Processing arrangement contains giving images as two [3] dimensional signals while applying already set signal processing procedures to them.
2. Segmentation
Segmentation means that divides an image into its basic parts or objects. In general, independent segmentation is one of the toughest tasks in digital image processing. A rugged segmentation process brings the process a long way to effective solution of imaging difficulties that require objects to be documented independently.[4] On the other hand, weak or unpredictable segmentation procedures almost always guarantee eventual failure [5].
a. Colour Image Segmentation
International Journal of Research (IJR)
e-ISSN: 2348-6848, p- ISSN: 2348-795X Volume 2, Issue 08, August 2015Available at http://internationaljournalofresearch.org
are significantly different with respect to the same characteristic(s).”
The term image segmentation refers to the partition of an image into a set of regions that cover it. The goal in many tasks is for the regions to represent meaningful areas of the image, such as the crops, urban areas, and forests of a satellite image. In other analysis tasks, the regions might be sets of border pixels grouped into such structures as line segments and circular arc segments in images of 3D industrial objects. Regions may also be defined as groups of pixels having both a border and a particular shape such as a circle or ellipse or polygon. When the interesting regions do not cover the whole image, we can still talk about segmentation, into foreground regions of interest and background regions to be ignored. Segmentation has two objectives. The first objective is to decompose the image into parts for further analysis. In simple cases, the environment might be well enough controlled so that the segmentation process reliably extracts only the parts that need to be analysed further. For example, in the chapter on color, an algorithm was presented for segmenting a human face from a color video image. The segmentation is reliable, provided that the person's clothing or room background does not have the same color components as a human face. In complex cases, such as extracting a complete road network from a greyscale aerial image, the segmentation problem can be very difficult and might require application of a great deal of domain a building knowledge. The second objective of segmentation is to perform a change of representation.[6]
The pixels of the image must be organized into higher-level units that are either more meaningful or more efficient for further analysis (or both). A critical issue is whether or not segmentation can be performed for many different domains using general bottom-up methods that do not use any special domain knowledge.
3.Particle Swarm Optimization (PSO)
Particle Swarm Optimization (PSO) is one of the more recently developed evolutionary technique, and it is based on a suitable model of social interaction between independent agents (particles) and it uses social knowledge in order to find the global maximum or minimum of a generic function. While for the GA, the improvement in the population fitness is assured by pseudo-biological operators, such as selection, crossover and mutation, the main PSO operator is the velocity update that takes into account the best position explored during the iterations, resulting in a migration of the swarm towards the global optimum [7].
In the PSO the so called swarm intelligence (i.e. the experience accumulated during the evolution) is used to search the parameter space by controlling the trajectories of a set of particles according to a swarm-like set of rules. The position of each particle is used to compute the value of the function to be optimized. Consequently every position is a particular solution of the optimization problem. Individual particles traverse the problem hyper-space and are attracted by both the position of their best past performance and the position of the global best performance of the whole swarm. Particles are moved in the domain of the problem with variable speeds and every position they reach represents a particular configuration of the variables set, which is then evaluated in order to get a score [8][9].
International Journal of Research (IJR)
e-ISSN: 2348-6848, p- ISSN: 2348-795X Volume 2, Issue 08, August 2015Available at http://internationaljournalofresearch.org
particle is then stochastically updated following the updating rules based on the attractions of the position 𝑃𝑖 of its personal optimum and the position 𝑃𝑔, which is the global optimum. Remembering that the global optimum is the best fitness value ever reached by all the swarm, equation shows the well-known standard PSO updating rule for particles' velocities:
𝑉𝑖+1 = 𝜔𝑉𝑖 + 𝜑1𝜂1 𝑃𝑖 − 𝑋𝑖 + 𝜑2𝜂2(𝑃𝑔− 𝑋𝑖)
Where 𝜔 is a friction factor that tends to stop the particle and prevents oscillations around the optimal value, effectively speeding up convergence.𝜑1 And 𝜑2 are constants, while 𝜂1 and 𝜂2 are random positive numbers with a uniform distribution between 0 and 1. The presence of random weights in the pull terms generated by the particle's best position 𝑃𝑖 and the global swarm best position causes wide oscillations and a random search in the entire parameter space. Such oscillations are precious whereas they broaden the search of each particle but they have some drawbacks since they can produce continuous oscillation around the optimal point. Such oscillation can be dampened, and so the convergence enhanced, via an effective use of the ω parameter.
a. Accelerated PSO
The standard particle swarm optimization uses both the current global best and the individual best𝑥𝑖. The reason of using the individual best is primarily to increase the diversity in the quality solutions, however, this diversity can be
simulated using some randomness.
Subsequently, there is no compelling reason for using the individual best, unless the optimization problem of interest is highly nonlinear and multimodal. A simplified version which could accelerate the convergence of the algorithm is to use the global best only. Thus, in the accelerated particle swarm optimization (APSO), the velocity vector is generated by a simpler formula
𝑣𝑖𝑡+1 = 𝑣𝑖𝑡 + 𝛼𝜖𝑛 + 𝛽(𝑔∗− 𝑥𝑖𝑡)
Where 𝜖𝑛 is drawn from 𝑁(0, 1) to replace the second term. The update of the position is simply
4. Implementation Accelerated PSO
To initialize the velocity vector
A simplified version which could accelerate the convergence of the algorithm is to use the global best only. Thus, in the accelerated particle swarm optimization (APSO), the velocity vector is generated by a simpler formula
𝑣𝑖𝑡+1 = 𝑣𝑖𝑡 + 𝛼𝜖𝑛 + 𝛽 𝑔∗− 𝑥
𝑖𝑡
Where 𝜖𝑛 is drawn from 𝑁(0, 1) to replace the second term [10].
Update of the position
The update of the position is simply
𝑥𝑖𝑡+1= 𝑥𝑖𝑡 + 𝑣𝑖𝑡+1
In order to increase the convergence even further, we can also write the update of the location in a single step
𝑥𝑖𝑡+1= 𝛽 + 1 𝑥𝑖𝑡 + 𝛽𝑔∗+ 𝛼𝜖
𝑛
This simpler version will give the same order of convergence. Typically, 𝛼 = 0.1𝐿 ∼ 0.5𝐿 Where,𝐿 is the scale of each variable, while
𝛽 = 0.1 ∼ 0.7 is sufficient for most
applications. It is worth pointing out that velocity does not appear, and there is no need to deal with initialization of velocity vectors. Therefore, APSO is much simpler. Comparing with many PSO variants, APSO uses only two parameters, and the mechanism is simple to understand [10].
Reduce the randomness as iterations
This means that we can use a monotonically decreasing function such as
International Journal of Research (IJR)
e-ISSN: 2348-6848, p- ISSN: 2348-795X Volume 2, Issue 08, August 2015Available at http://internationaljournalofresearch.org
Where 𝛼0 ≈ 0.5 ∼ 1the initial value of the randomness parameter, Here is 𝑡 is the number of iterations or time steps. 0 < 𝛾 < 1, is a control parameter. For example, in our implementation, we will use
𝛼 = 0.7𝑡
Where 𝑡 ∈ [0, 𝑡𝑚𝑎𝑥] and 𝑡𝑚𝑎𝑥 is the maximum of iterations [10].
5. Results
In our study, all images are 256×256 with 256 grayscale. To compare the efficiency of our method with others, segmentation methods based on APSO algorithm are used to segment some typical images. Experimental results are given below, covering a captcha image polluted by synthetic noise (composed of Gaussian noise, speckle noise, and salt and pepper noise). In this experiment, for APSO algorithm, the population size is 10, the fixed maximum number of iterations is 10, and the limit times for abandonment is 10, the lower and upper bounds are 0 and 255 respectively.
a. Case #1
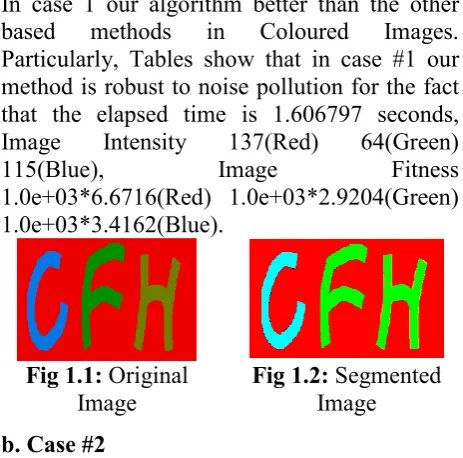
In case 1 our algorithm better than the other
based methods in Coloured Images.
Particularly, Tables show that in case #1 our method is robust to noise pollution for the fact that the elapsed time is 1.606797 seconds, Image Intensity 137(Red) 64(Green)
115(Blue), Image Fitness
1.0e+03*6.6716(Red) 1.0e+03*2.9204(Green) 1.0e+03*3.4162(Blue).
Fig 1.1: Original
Image Fig 1.2: Segmented Image b. Case #2
In case 2 our algorithm better than the other
based methods in Coloured Images.
Particularly, Tables show that in case #2 our
method is robust to noise pollution for the fact that the elapsed time is 1.779483 seconds, Image Intensity 144(Red) 142(Green)
139(Blue), Image Fitness
1.0e+03*3.5258(Red) 1.0e+03*3.5259(Green) 1.0e+03*3.5255(Blue).
Fig 1.3: Original Image
Fig 1.4: Segmented Image
c. Case #3
In case 3our algorithm better than the other
based methods in Coloured Images.
Particularly, Tables show that in case #3 our method is robust to noise pollution for the fact that the elapsed time is 1.542135 seconds, Image Intensity 146(Red) 142(Green)
137(Blue), Image Fitness
1.0e+03*3.8506(Red) 1.0e+03*4.2290(Green) 1.0e+03*4.59008(Blue).
Fig 1.5: Original Image
Fig 1.6: Segmented Image d. Case #4
In case 4our algorithm better than the other
based methods in Coloured Images.
Particularly, Tables show that in case #4 our method is robust to noise pollution for the fact that the elapsed time is 1.541900 seconds, Image Intensity 154(Red) 136(Green)
123(Blue), Image Fitness
International Journal of Research (IJR)
e-ISSN: 2348-6848, p- ISSN: 2348-795X Volume 2, Issue 08, August 2015Available at http://internationaljournalofresearch.org
Fig 1.7: Original Image
Fig 1.8: Segmented Image e. Case #5
In case 5 our algorithm better than the other
based methods in Coloured Images.
Particularly, Tables show that in case #5 our method is robust to noise pollution for the fact that the elapsed time is 1.538803 seconds, Image Intensity 130(Red) 173(Green)
173(Blue), Image Fitness
1.0e+03*2.8865(Red) 1.0e+03*3.2843(Green) 1.0e+03*2.4423(Blue).
Fig 1.9: Original Image
Fig 1.10: Segmented Image
f. Case #6
In case 6 our algorithm better than the other
based methods in Coloured Images.
Particularly, Tables show that in case #6 our method is robust to noise pollution for the fact that the elapsed time is 1.599419 seconds, Image Intensity 139(Red) 122(Green) 73(Blue), Image Fitness 1.0e+03*1.9490(Red) 1.0e+03*2.0872(Green)
1.0e+03*0.7374(Blue).
Fig 1.11: Original
Image Fig 1.12: Segmented Image
g. Case #7
In case 7 our algorithm better than the other
based methods in Coloured Images.
Particularly, Tables show that in case #7 our method is robust to noise pollution for the fact that the elapsed time is 1.614681 seconds, Image Intensity 142(Red) 147(Green)
146(Blue), Image Fitness is
1.0e+03*3.2673(Red) 1.0e+03*2.9067(Green) 1.0e+03*2.9145(Blue). 3.2673
Fig 1.13: Original Image
Fig 1.14: Segmented Image
Table 1.1: Elapsed Time Comparison over various cases
Cases Time Elapsed
Case #1 1.606797
Case #2 1.779483
Case #3 1.542135
Case #4 1.541900
Case #5 1.538803
Case #6 1.599419
Case #7 1.614681
Table 1.2: Image Intensity Values of Various Cases
Cases
Image Intensity
Red Green Blue
Case #1 137 64 115
Case #2 144 142 139
Case #3 146 142 137
Case #4 154 136 123
Case #5 130 173 173
Case #6 139 122 73
International Journal of Research (IJR)
e-ISSN: 2348-6848, p- ISSN: 2348-795X Volume 2, Issue 08, August 2015Available at http://internationaljournalofresearch.org
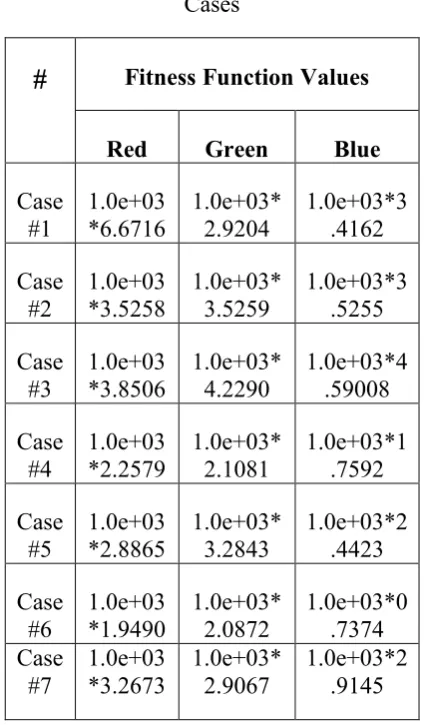
Table 1.3: Fitness Function Values of Various Cases
#
Fitness Function ValuesRed Green Blue
Case #1
1.0e+03 *6.6716
1.0e+03* 2.9204
1.0e+03*3 .4162
Case #2
1.0e+03 *3.5258
1.0e+03* 3.5259
1.0e+03*3 .5255
Case #3
1.0e+03 *3.8506
1.0e+03* 4.2290
1.0e+03*4 .59008
Case #4
1.0e+03 *2.2579
1.0e+03* 2.1081
1.0e+03*1 .7592
Case
#5 1.0e+03*2.8865 1.0e+03*3.2843 1.0e+03*2.4423
Case
#6 1.0e+03*1.9490 1.0e+03*2.0872 1.0e+03*0.7374 Case
#7
1.0e+03 *3.2673
1.0e+03* 2.9067
1.0e+03*2 .9145
ConclusionWe proposed a fast segmentation method on SAR images. The technique regards threshold estimation and employs Accelerated PSO algorithm to optimize it. We integrate the concept of grey number in Grey theory, maximum conditional entropy to get an improved two-dimensional grey entropy. In essence, the fast segmentation speed of our method owes to Accelerated PSO algorithm, which has an outstanding convergence performance. On the other hand, the segmentation quality of our method is benefit from the improved two-dimensional grey entropy,. Experimental results indicate that our method is superior to GA based, AFS based and ABC based methods in terms of segmentation accuracy, segmentation time, and Thresholding.
References
[1] A. K. Jain, “Fundamentals Of Digital Image Processing -,” in Prentice-Hall, 1989.
[2] R. C. G. Woods and A. Wesley, “Digital Image Processing,” 1992.
[3] KMM, “Design and Fabrication of Color Scanner,” Indian Journal of Technology,, vol. 15, 1997.
[4] L. Zhang and Q. Ji, “A Bayesian Network Model for Automatic and Interactive Image Segmentation,” Image Processing, IEEE Transactions on, vol. 20, no. 9, pp. 2582-2593, Sept 2011.
[5] E. R. Dougherty, R. A. Lotufo and T. I. S. for Optical Engineering SPIE, Hands-on morphological image processing, vol. 71, SPIE press Bellingham, 2003.
International Journal of Research (IJR)
e-ISSN: 2348-6848, p- ISSN: 2348-795X Volume 2, Issue 08, August 2015Available at http://internationaljournalofresearch.org
[7] E. Dumic, S. Grgic and M. Grgic, “Improved image quality measure through particle swarm optimization,” in Systems, Signals and Image Processing (IWSSIP), 2011 18th International Conference on, 2011.
[8] A. Lahouhou, E. Viennet and A. Beghdadi, “Combining and selecting indicators for image quality assesment,” in Information Technology Interfaces, 2009. ITI '09. Proceedings of the ITI 2009 31st International Conference on, 2009.
[9] Y.-J. Zhang, Advances in image and video segmentation, IGI Global, 2006.