ISSN:2574 -1241
Assessment of the Purity of Isolated Cd3+ T Cell
Populations by A New Molecular Biology Technology:
Impact on the Quantification of Chimerism Monitoring
After Hematopoietic Stem Cell Transplantation
Pedini P
1, Lopasso A
1, Demerle C
1, Velier M
1, Dassa S
1, Kouba N
1, Ferreira V
1, Brunet Nicolino C
3, Simon
S
1, Basire A
1, Chiaroni J
2, Michel G
4, Galambrun C
4and Picard C
1,2*
1HLA laboratory, EFS PACA-Corse
2UMR 7268 ADÉS Aix-Marseille Université /EFS /CNRS, Marseille, France
3Department of Hematology, Hospital de la Conception, INSERM CIC-1409, Assistance Publique-Hôpitaux Marseille (AP-HM), Marseille,
France
4Department of Paediatric Haematology-Oncology, APHM, La Timone Hospital, Aix-Marseille University, France
*Corresponding author: C Picard, HLA laboratory, EFS PACA-Corse, 13005 Marseille, France
DOI:10.26717/BJSTR.2019.23.003972
Received: November 27, 2019
Published: December 16, 2019
Citation: Pedini P, Lopasso A, Demerle C, Velier M, Dassa S, Kouba N, Ferreira V, Bru-net Nicolino C, Simon S, Basire A, Chiaroni J, Michel G, Galambrun C, Picard C. Assess-ment of the Purity of Isolated Cd3+ T Cell Populations by A New Molecular Biology Technology: Impact on the Quantification of Chimerism Monitoring After Hemato-poietic Stem Cell Transplantation. Bi-omed J Sci & Tech Res 23(5)-2019. BJSTR. MS.ID.003972.
ARTICLE INFO Abstract
Chimerism is the key analysis of monitoring after Hematopoietic Stem Cell Transplantation (HSCT). When chimerism is performed on sorted cells, the EFI and ASHI standards recommend documenting the purity of sorted cells populations. The current reference method for analyzing purity of sorting is today the Flow Cytometry (FCM) method, which is relatively expensive and needs a specialized laboratory. In this context, new qPCR Non-T Genomic Kit (Accumol®, Calgary, AB, Canada), based on the quantification by real-time PCR of genomic rearrangements of TCR genes, undergone by T cells during their differentiation seems very interesting for HLA laboratory. In our hands, the qPCR Non-T Genomic Kit is an efficient tool, allowing accurate and reproducible assessment of contamination levels in a CD3+ sorted cell sample. Routine use will help meet EFI/ASHI requirements and improve the follow-up of HSCT recipient at a cost equivalent to that of FCM.
Keywords: Chimerism; T lymphocyte purification; Flow Cytometry; Hematopoietic Stem Cell Transplantation
Abbreviations: HSCT: Hematopoietic Stem Cell Transplantation, GVHD: Graft versus Host Disease, FCM: Flow Cytometry, EFI: European Federation for Immunogenetic, ASHI: American Society of Histocompatibility and Immunogenetic, RQ-PCR: Real-Time PCR Quantitative, TCR: T Cell Receptor, UCS: Ultra-Conserved Sequence, CV: Coefficients of Variation, SD: Standard deviation
Short Communication
Chimerism analysis is an important key for the patient follow-up after Hematopoietic Stem Cell Transplantation (HSCT). It is used to quantify the donor and the recipient part of a cell population issued from blood or bone marrow sample [1]. In follow-up of the residual disease, cell sorting targeted to the cells of the malignant
actually controversial to appreciate early the risk of acute or chronic GVHD and the risk of rejection [3-5]. From the total collected blood, T lymphocytes are isolated through most often at a positive sorting from beads having anti-CD3 antibodies. When performed from sorted cells whatever the method, the European Federation for Immunogenetic (EFI) and American Society of Histocompatibility and Immunogenetic (ASHI) recommends that laboratories check the purity of cell sorting, i.e EFI Standards, Section I4.190 and ASHI Guidelines, Section D.5.3.4.1.8. The current reference method of cell purification is Flow Cytometry (FCM), but this technique requires a specific expertise which is not available in all histocompatibility laboratories. Also, molecular biology could be an alternative method, easier and certainly less expensive.
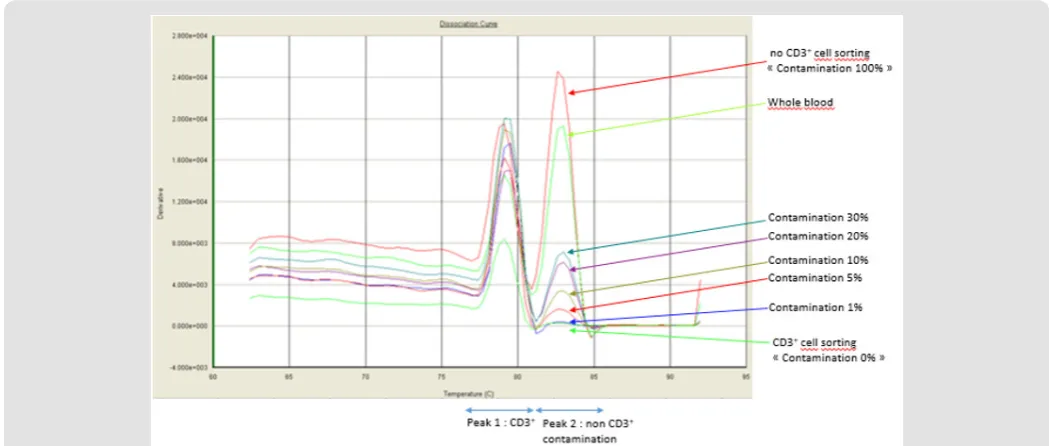
Purity assessment using PCR-based Non-T Genomic Detection Kit (Accumol) has been showed to correlate closely to the purity defined gated cells by FCM [6]. The qPCR Non T Genomic Detection kit (Accumol) has also been developed to detect non-T cell genomic DNA by real-time quantitative PCR (RQ-PCR) in a CD3 + sorted sample. During T cell differentiation, the T Cell Receptor (TCR) undergoes gene rearrangements, including excision of some noncoding domains. The kit makes it possible, on the one hand, to amplify an Ultra-Conserved Sequence (UCS) of the genome found in all cells, and on the other hand a DNA sequence specific for non-T cells, corresponding to the domains excised during the T cell selection in thymus. After amplification in the presence of the Sybrgreen intercalant, a melting curve is produced from the RQ-PCR instruments which makes it possible to identify two peaks corresponding to the two amplified sequences. The first peak at a temperature of 80°C corresponds to the amplification of the UCS and the second peak at a temperature of 83.5°C corresponds to the amplification of specific fragment of the non-T population. The percentage of contamination is then calculated by the ratio of the
height of the non-T specific peak to the UCS peak, based on a revised calibration curve after each new lot of the kit.
The aim of this study is to assess the purity of isolated CD3+ T cell populations by this new molecular biology assay. The CD3 + T cells were purified from 4 ml of whole blood from different donors on beads from the EasySep Human Whole Blood CD3 positive selection kit (Stem Cell technologies, Vancouver, BC, Canada), according to the supplier’s recommendations. The percentage of CD3+ T cells was assessed by FCM using fluorochrome-conjuaged antibodies against CD45 and CD5 (for T cells) or CD45 and CD3 using the tetra CHROME CYTO-STAT kit (Beckman Coulter®). Cells were gated on CD45+ events.
The qPCR Non-T Genomic kit (Accumol) were applied after extraction of the DNA genomic from whole blood and CD3+ cell sorting by the Kurabo QuickGene-610L DNA extraction system (Fujifilm®) following the supplier’s recommendations. Briefly, 19 μl of reagents of the qPCR kit Non T Genomic containing the primers as well as the fluorophores, Sybrgreen and Rox are added to 2 ng of DNA contained in a volume of 1 μl. The amplification and fusion curve were performed by Applied Biosystems™ 7500 Real-Time PCR systems (Thermofisher scientific) in accordance with the Accumol supplier’s temperature and time recommendations.
The first step was to determine the correlation of the results of the qPCR Non T Genomic Detection kit with the results obtained by FCM. A range of CD3 + T cells contaminated with 1, 5, 10, 20, or 30% non-T cells was determined. Contamination was performed at different percentages with male donor non-T cells mixed with female donor T cells to validate contaminations with the Y probe of Q-PCR technique used for the detection of chimerism. (QTRACE ™, JETA molecular®).
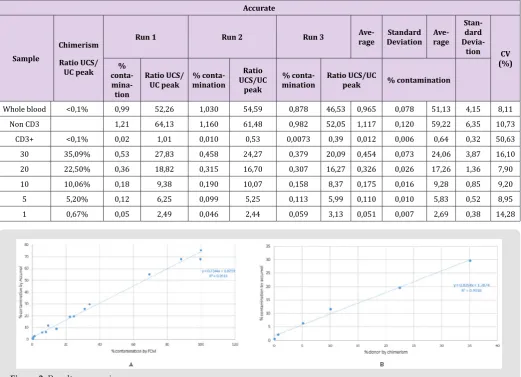
Blood donations were collected in the Etablissement Francais du Sang, in accordance with BSL-2 practices. A medical interview was carried out prior to blood donation to exclude donors with medical contraindications. The purity of the samples sorted before contamination were at least 99.5% fixed by FCM. The results of the range are presented in Figure 1. The values obtained by FCM are correlated to the results of qPCR Non-T Genomic (Accumol) with y = 0.724x+1.879, suggesting that qPCR Non-T Genomic Detection Kit is not affected by the presence of beads on the surface of the sorted cells. The correlation between the two methods is excellent over the entire tested range, with a correlation coefficient of 0.991. Furthermore, the percentage of chimerism for all dilutions were relatively similar that obtained by qPCR Non-T Genomic kit with a correlation coefficient of 0.991, confirming the reliability of kit results. However, the different results show that the new kit overestimate the percentage of non CD3 contaminations below 5%,
determining the sensitivity of qPCR Non-T Genomic Detection Kit near to 5% of contamination. The provider sets this sensitivity to 2% contamination. This study cannot confirm it.
The fidelity of the kit has been also verified from the accurate and reproducibility assays corresponding to 3 tests per point of the non-T cell contamination range. The results are presented in Table 1. The coefficients of variation (CV) are all less than 20% except for the uncontaminated CD3 + sample. Indeed, the absence of contamination results in a very low ratio, on average 0.01, which gives a high artefactual CV. With a 12.94 CV for samples contaminated at near to 1% (0.67% for chimerism and 1,4% for FCM), this technique can be considered to give a reliable result, including small values of contaminations (Figure 2). Despite different calibration curves obtained for each new batch, the reproducibility for values between 1% and 5% was maintained with CVs <25% (Table 2).
Table 1: Accurate (A) and Reproducibility (B) assays performed in the laboratory on a range of CD3 + T cells contaminated with 1, 5, 10, 20, or 30% of non-T cell sorting.
Accurate
Sample
Chimerism Ratio UCS/ UC peak
Run 1 Run 2 Run 3 Ave-rage DeviationStandard Ave-rage Stan-dard
Devia-tion CV (%) %
conta- mina-tion
Ratio UCS/
UC peak % conta-mination
Ratio UCS/UC
peak
%
conta-mination Ratio UCS/UC peak % contamination
Whole blood <0,1% 0,99 52,26 1,030 54,59 0,878 46,53 0,965 0,078 51,13 4,15 8,11
Non CD3 1,21 64,13 1,160 61,48 0,982 52,05 1,117 0,120 59,22 6,35 10,73
CD3+ <0,1% 0,02 1,01 0,010 0,53 0,0073 0,39 0,012 0,006 0,64 0,32 50,63
30 35,09% 0,53 27,83 0,458 24,27 0,379 20,09 0,454 0,073 24,06 3,87 16,10
20 22,50% 0,36 18,82 0,315 16,70 0,307 16,27 0,326 0,026 17,26 1,36 7,90
10 10,06% 0,18 9,38 0,190 10,07 0,158 8,37 0,175 0,016 9,28 0,85 9,20
5 5,20% 0,12 6,25 0,099 5,25 0,113 5,99 0,110 0,010 5,83 0,52 8,95
1 0,67% 0,05 2,49 0,046 2,44 0,059 3,13 0,051 0,007 2,69 0,38 14,28
Figure 2: Results comparison
A. Between the qPCR Non-T Genomic Kit (Accumol) and the FCM in two independent experiments of contaminations range and
Table 2: Reproducibility of percentage of contaminations for three different batches.
FCM Chimerism Accumol
% contamination % donor
% contamination
Batch 1 Batch 2 Batch 3 Average deviationStandard CV (%)
9,6 10,06 11,6 9,9 9,1 11,7 9,1 10,28 1,29 12,6
7,1 5,20 6,4 4,8 5,0 4,4 5,5 5,22 0,77 14,7
1,4 0,67 2,1 3,8 3,0 3,6 3,6 3,22 0,69 21,6
The number of cells available post-sorting can be very low, especially in leukopenia or lymphopenia samples. In practice, because access to a FCM is limited, or because not enough cells can be spared for FCM analysis, a large proportion of laboratories do not perform routine CD3 purity check after cell isolation. Indeed, our HLA laboratory performs FCM only after new batch of CD3 selection kit or when chimerism results on cell purifications are surprising. Contamination rates by qPCR Non-T Genomic kit have been retrospectively determined in 29 CD3+ sorting samples of children allo-HSCT, with 13 lymphopenia (Lymphocytes < 1,5G/L) and 7 lymphocytosis (> 3,9 G/L). All children samples (2015 -2017) were included in the routine chimerism study. Informed consent was obtained from parents/guardians for all samples. The DNA was
conserved at -80°C. Purity of CD3 sorting was previously analyzed by FCM in 8 samples. Of these 8 samples, 7 exceeded 95% purity, and 1 were 50% purity.
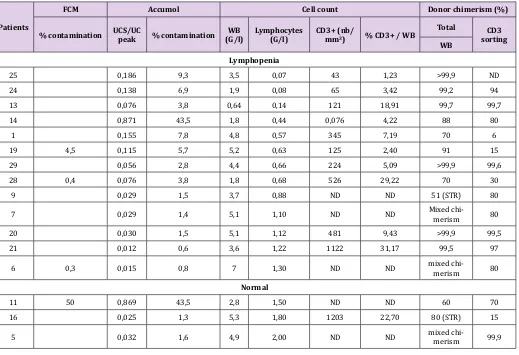
The results obtained on patient samples, are presented in Table 3. They show that the purity of CD3 sorting by FCM are comparable to those of qPCR Non-T Genomic kit. Furthermore, this kit makes it possible to determine purity even when FCM cannot, especially when number of lymphocytes < 0,500 G/L. Finally, it shows that the purity of the sorted cells by EasySep Human Whole Blood CD3 posi-tive selection kit is reliable if the patient has at least 10% of CD3 + T lymphocytes among its total white blood because 5 from 7 samples with < 10% CD3/WB have a rate of contamination of non CD3 > 5%.
Table 3: Retrospective evaluation of the purity of CD3 sorting and its impact on the chimerism result, according to the T lymphocyte and leukocyte count of children patients with cases of lymphopenia and lymphocytosis after HSCT (ND: Not determined).
Patients
FCM Accumol Cell count Donor chimerism (%)
% contamination UCS/UC peak % contamination (G/l)WB Lymphocytes (G/l) CD3+ (nb/mm3) % CD3+ / WB
Total CD3 sorting WB
Lymphopenia
25 0,186 9,3 3,5 0,07 43 1,23 >99,9 ND
24 0,138 6,9 1,9 0,08 65 3,42 99,2 94
13 0,076 3,8 0,64 0,14 121 18,91 99,7 99,7
14 0,871 43,5 1,8 0,44 0,076 4,22 88 80
1 0,155 7,8 4,8 0,57 345 7,19 70 6
19 4,5 0,115 5,7 5,2 0,63 125 2,40 91 15
29 0,056 2,8 4,4 0,66 224 5,09 >99,9 99,6
28 0,4 0,076 3,8 1,8 0,68 526 29,22 70 30
9 0,029 1,5 3,7 0,88 ND ND 51 (STR) 80
7 0,029 1,4 5,1 1,10 ND ND Mixed chi-merism 80
20 0,030 1,5 5,1 1,12 481 9,43 >99,9 99,5
21 0,012 0,6 3,6 1,22 1122 31,17 99,5 97
6 0,3 0,015 0,8 7 1,30 ND ND mixed chi-merism 80
Normal
11 50 0,869 43,5 2,8 1,50 ND ND 60 70
16 0,025 1,3 5,3 1,80 1203 22,70 80 (STR) 15
Submission Link: https://biomedres.us/submit-manuscript.php
Assets of Publishing with us • Global archiving of articles
• Immediate, unrestricted online access • Rigorous Peer Review Process • Authors Retain Copyrights • Unique DOI for all articles
https://biomedres.us/
This work is licensed under Creative Commons Attribution 4.0 License
ISSN: 2574-1241
DOI:10.26717/BJSTR.2019.23.003972 Picard C.Biomed J Sci & Tech Res
15 0,018 0,9 4,6 2,00 1,63 35,43 mixed chi-merism 99,1
10 0,026 1,3 3,2 2,10 1458 45,56 40 (STR) < 2 (STR)
22 0,036 1,8 5,1 2,16 ND ND 99 98
17 0,3 0,029 1,5 6,2 2,30 1732 27,94 45 (STR) 99,8
4 2 0,036 1,8 7,5 2,60 ND ND 44 (STR) 86
8 0,028 1,4 5,9 2,60 1437 24,36 30 99,9
Lymphocytosis
3 0,020 1,0 9,3 3,90 2367 25,47 85 31
26 0,015 0,8 9,3 3,90 2369 25,47 85 31 (STR)
12 0,008 0,4 14 4,80 2671 19,08 47 86
27 0,025 1,3 14 4,80 2671 19,08 47 86
2 1 0,046 2,3 0,13 ND ND ND 80 93
18 0,122 6,1 ND ND ND ND >99,9 >99,9
23 0,2 0,007 0,4 ND ND ND ND 50 93
In our hands, the qPCR non-T Genomic kit seems to be an alternative technology to FCM to determine the percentage of cell purification. The sensitivity of this technique is near to 2-5%, with a good reproducibility of results between 1% and 30% contaminations. Thus, it is therefore an efficient tool, allowing accurate evaluation, even retrospectively, of non-T cell contamination in a sorted CD3 + T cell sample. The study of the patient samples also made it possible to test the kit in the pathological conditions of lymphopenia for which the chimerism results obtained must be interpreted with caution. Finally, its routine use will therefore meet the requirements of the EFI and improve the follow-up of HSCT patients at a cost equivalent to that of FCM.
Acknowledgement
The authors are would like to thank the healthy donors and child patients.
References
1. Elkaim E, Picard C, Galambrun C, Barlogis V, Loundou A, et al. (2014) Peripheral blood cells chimerism after unrelated cord blood
transplantation in children: Kinetics, predictive factors and impact on post-transplant outcome. Br J Haematol 166: 557-565.
2. Cuvelier GD, Rubin TS, Wall DA, Schroeder ML (2016) Long-Term Outcomes of Hematopoietic Stem Cell Transplantation for ZAP70 Deficiency. J Clin Immunol 36: 713-724.
3. Koreth J, Kim HT, Nikiforow S, Milford EL, Armand P, et al. (2014) Donor chimerism early after reduced-intensity conditioning hematopoietic stem cell transplantation predicts relapse and survival. Biol Blood Marrow Transplant 20: 1516-1521.
4. Rupa-Matysek J, Lewandowski K, Nowak W, Sawiński K, Gil L, et al.
(2011) Correlation between the kinetics of CD3+ chimerism and the incidence of graft-versus-host disease in patients undergoing allogeneic hematopoietic stem cell transplantation. Transplant Proc 43: 1915-1923.
5. Mellgren K, Arvidson J, Toporski J, Winiarski, J (2015) Chimerism analysis in clinical practice and its relevance for the detection of graft rejection and malignant relapse in pediatric hematopoietic stem cell transplant patients. Pediatr Transplant 19: 758-766.