ISSN(Online): 2320-9801 ISSN (Print): 2320-9798
I
nternational
J
ournal of
I
nnovative
R
esearch in
C
omputer
and
C
ommunication
E
ngineering
(An ISO 3297: 2007 Certified Organization)Vol. 3, Issue 5, May 2015
Copyright to IJIRCCE DOI: 10.15680/ijircce.2015.0305095 4608
A Better Thresholding Technique For Image
Denoising Based On Wavelet Transform
B.Sudharani
Assistant Professor, Dept. of E.C.E., Sri Venkateswara College of Engineering, Tirupati, Andhrapradesh, India
ABSTRACT:Wavelet transforms enable us to represent signals with a high degree of scarcity. Wavelet thresholding is a signal estimation technique that exploits the capabilities of wavelet transform for signal denoising. The aim of this project was to study various thresholding techniques such as SureShrink, VisuShrink and BayesShrink and determine the best one for image denoising.
KEYWORDS: Wavelet, Thresholding, Denoising, SureShrink, VisuShrink and BayesShrink.
I. INTRODUCTION
In many applications, image denoising is used to produce good estimates of the original image from noisy observations. The restored image should contain less noise than the observations while still keep sharp transitions (i.e. edges). Wavelet transform, due to its excellent localization property, has rapidly become an indispensable signal and image processing tool for a variety of applications, including compression and denoising. Wavelet denoising attempts to remove the noise present in the signal while preserving the signal characteristics, regardless of its frequency content. It involves three steps: a linear forward wavelet transform, nonlinear thresholding step and a linear inverse wavelet transform.
II. RELATED WORK
Wavelet thresholding first proposed by Donoho is a signal estimation technique that exploits the capabilities of wavelet transform for signal denoising. It removes noise by killing coefficients that are insignificant relative to some threshold, and turns out to be simple and effective, depends heavily on the choice of a thresholding parameter and the choice of this threshold determines, to a great extent the efficacy of denoising.
Researchers have developed various techniques for choosing denoising parameters and so far there is no “best” universal threshold determination technique.
The aim of this project was to study various thresholding techniques such as SureShrink, VisuShrink and BayesShrink and determine the best one for image denoising.
III.THRESHOLDING
A. Introduction:
ISSN(Online): 2320-9801 ISSN (Print): 2320-9798
I
nternational
J
ournal of
I
nnovative
R
esearch in
C
omputer
and
C
ommunication
E
ngineering
(An ISO 3297: 2007 Certified Organization)Vol. 3, Issue 5, May 2015
Copyright to IJIRCCE DOI: 10.15680/ijircce.2015.0305095 4609
Figure 1: A Noisy Signal in Time domain and Wavelet Domain. Note the scarcity of coefficients
B. Hard and Soft Thresholding :
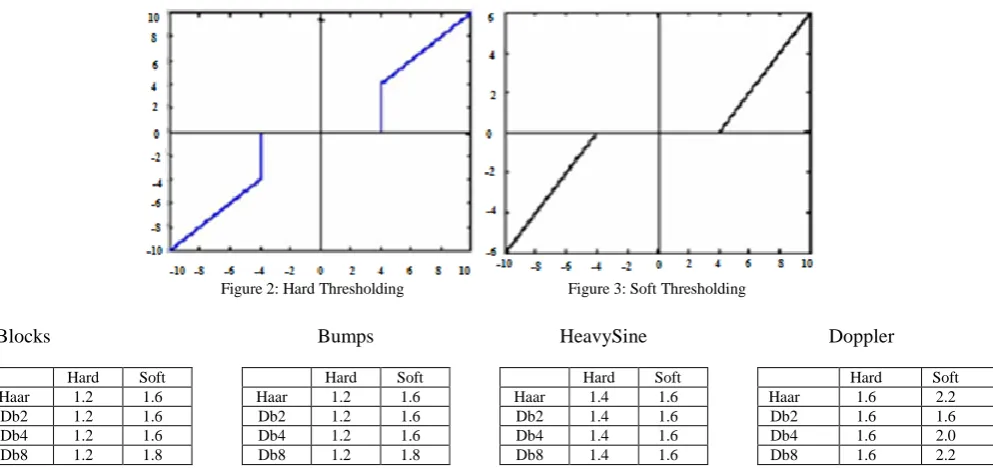
Hard and soft thresholding with threshold¸ are defined as follows: The hard thresholding operator is defined as:
D (U. λ) = U for all |U|>λ=0 otherwise u the soft thresholding operator on the other hand is defined as:D(U, λ) = sgn(U)max(0, |U| - λ)
Figure 2: Hard Thresholding Figure 3: Soft Thresholding
Blocks
Hard Soft Haar 1.2 1.6 Db2 1.2 1.6 Db4 1.2 1.6 Db8 1.2 1.8
Bumps
Hard Soft Haar 1.2 1.6
Db2 1.2 1.6 Db4 1.2 1.6 Db8 1.2 1.8
HeavySine
Hard Soft Haar 1.4 1.6 Db2 1.4 1.6 Db4 1.4 1.6 Db8 1.4 1.6
Doppler
Hard Soft Haar 1.6 2.2 Db2 1.6 1.6 Db4 1.6 2.0 Db8 1.6 2.2
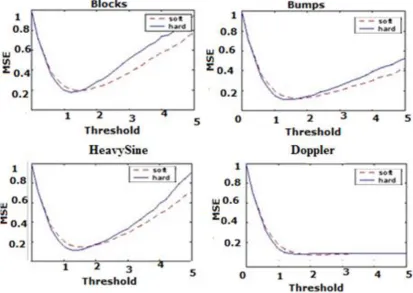
Table1: Best Thresholds empirically found with different denoising schemes, in terms of MSE
C. Comparison with Universal Threshold :
The threshold ¸ λUNIV = 2 𝐼𝑛 𝑁𝜎 (N being the signal length, σ2 being the noise variance) is well known in wavelet
literature as the Universal threshold. It is the optimal threshold in the asymptotic sense and minimizes the cost function of the difference between the function and the soft threshold version of the same in the L2 norm sense (i.e. it minimizes E||YThresh - YOrig||2. In our case, N = 2048, σ = 1 therefore theoretically λUNIV = (2 𝐼𝑛 2048 1 ) = 3.905.As seen from
ISSN(Online): 2320-9801 ISSN (Print): 2320-9798
I
nternational
J
ournal of
I
nnovative
R
esearch in
C
omputer
and
C
ommunication
E
ngineering
(An ISO 3297: 2007 Certified Organization)Vol. 3, Issue 5, May 2015
Copyright to IJIRCCE DOI: 10.15680/ijircce.2015.0305095 4610
of the wavelet used. It therefore seems that the universal threshold is not useful to determine a threshold. However, it is useful for obtain a starting value when nothing is known of the signal condition. One can surmise that the universal threshold may give a better estimate for the soft threshold if the number of samples is larger (since the threshold is optimal in the asymptotic sense).
Figure 4: MSE v/s Threshold values for the four test signals
IV.IMAGE DENOISING USING THRESHOLDING
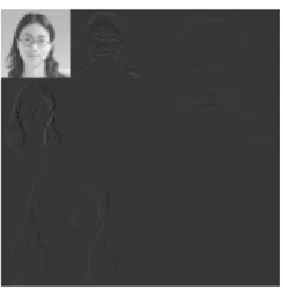
The problem boils down to finding an optimal threshold such that the mean squared error between the signal and its estimate is minimized. The wavelet decomposition of an image is done as follows: In the first level of decomposition, the image is split into 4 sub bands, namely the HH, HL, LH and LL sub bands. The HH subband gives the diagonal details of the image; the HL subband gives the horizontal features while the LH subband represents the vertical structures. The LL subband is the low resolution residual consisting of low frequency components and it is this subband which is further split at higher levels of decomposition. The different methods for denoising we investigate differ only in the selection of the threshold.
The basic procedure remains the same: 1.Calculate the DWT of the image.
ISSN(Online): 2320-9801
ISSN (Print): 2320-9798
I
nternational
J
ournal of
I
nnovative
R
esearch in
C
omputer
and
C
ommunication
E
ngineering
(An ISO 3297: 2007 Certified Organization)
Vol. 3, Issue 5, May 2015
Copyright to IJIRCCE 10.15680/ijircce.2015.0305001 4611
Figure 5: 2D DWT
Soft thresholding is used for all the algorithms due to the following reasons: Soft thresholding has been shown to achieve near minimax rate over a large number of Besov spaces. Moreover, it is also found to yield visually more pleasing images. Hard thresholding is found to introduce artifacts in the recovered images.
Global Thresholding: Threshold Selection by Universal Thresholding:
Universal Threshold:
Original Image Noisy Image
Denoised Image using Haar at level 1 obtained by wavelet coefficient thresholding using global positive HARD threshold
Denoised Image using Haar at level 1 obtained by wavelet coefficient thresholding using global positive SOFT threshold
Figure 6.1
Original Image Noisy image
Denoised Image using Db 5 at level 1 obtained by wavelet coefficients thresholding using global positive Hard threshold
Denoised Image using Db 5 at level 1 obtained by wavelet coefficients thresholding using
global positive Soft threshold
Figure 6.2
We now study three thresholding techniques: VisuShrink, SureShrink and BayesShrink and investigate their performance for denoising on a picture.
A. VisuShrink:
ISSN(Online): 2320-9801
ISSN (Print): 2320-9798
I
nternational
J
ournal of
I
nnovative
R
esearch in
C
omputer
and
C
ommunication
E
ngineering
(An ISO 3297: 2007 Certified Organization)
Vol. 3, Issue 5, May 2015
Copyright to IJIRCCE 10.15680/ijircce.2015.0305001 4612
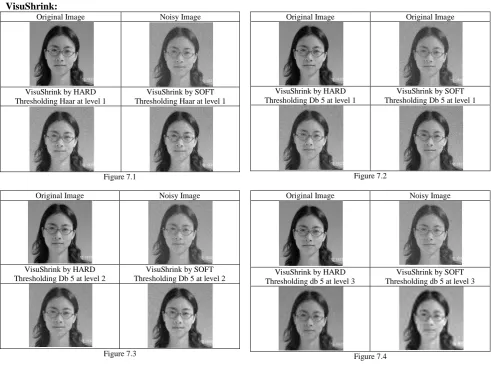
Global Thresholding: Threshold Selection by VisuShrink:
VisuShrink:
Original Image Noisy Image
VisuShrink by HARD Thresholding Haar at level 1
VisuShrink by SOFT Thresholding Haar at level 1
Figure 7.1
Original Image Original Image
VisuShrink by HARD Thresholding Db 5 at level 1
VisuShrink by SOFT Thresholding Db 5 at level 1
Figure 7.2
Original Image Noisy Image
VisuShrink by HARD Thresholding Db 5 at level 2
VisuShrink by SOFT Thresholding Db 5 at level 2
Figure 7.3
Original Image Noisy Image
VisuShrink by HARD Thresholding db 5 at level 3
VisuShrink by SOFT Thresholding db 5 at level 3
Figure 7.4
B. SureShrink:
SureShrink is a thresholding by applying subband adaptive threshold, a separate threshold is computed for each detail subband based upon SURE (Stein‟s Unbiased estimator for Risk), a method for estimating the loss ǁ μ – μ ǁ2in an unbiased fashion. In our case let wavelet coefficients in the jth subband be {Xi: i =1,…, d }, 𝛍 is the soft threshold estimator 𝑋 t= ƞt (Xi) we apply Stein‟s result [1] to get an unbiased estimate of the risk Eǁ μ(t) (x) – μ ǁ2:
SURE (t; X)=d– 2# {i:|Xi|≤t} + 𝑑𝑖=1𝑚𝑖𝑛(|Xt|,t)2
For an observed vector x (in our problem, x is the set of noisy wavelet coefficients in a Subband, we could find the threshold tS that minimizes SURE (t,X), tS= arg min SURE(t,X)
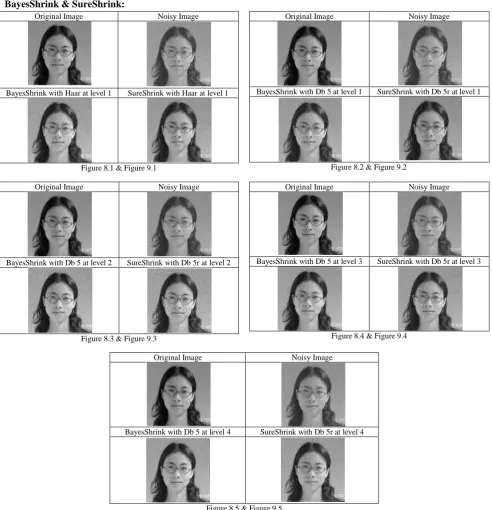
The results obtained for the image on my picture using SureShrink are shown in Figure 8.1-8.5. The „Db5‟ wavelet coefficient was used with 4 levels decomposition. Clearly, the results are much better than VisuShrink. The sharp features of image are retained and the MSE is considerably lower. This because SureShrink is subband adaptive.
C. BayesShrink:
ISSN(Online): 2320-9801
ISSN (Print): 2320-9798
I
nternational
J
ournal of
I
nnovative
R
esearch in
C
omputer
and
C
ommunication
E
ngineering
(An ISO 3297: 2007 Certified Organization)
Vol. 3, Issue 5, May 2015
Copyright to IJIRCCE 10.15680/ijircce.2015.0305001 4613
BayesShrink for my own picture is shown in Figure 9.1-9.5. The „Db5‟ wavelet was used with four levels decomposition. We found that BayesShrink performs better than SureShrink in terms of MSE. The reconstruction using BayesShrink is smoother and more visually appealing than one obtained using SureShrink
Adaptive Thresholding: Threshold Selection by BayesShrink & SureShrink:
BayesShrink & SureShrink:
Original Image Noisy Image
BayesShrink with Haar at level 1 SureShrink with Haar at level 1
Figure 8.1 & Figure 9.1
Original Image Noisy Image
BayesShrink with Db 5 at level 1 SureShrink with Db 5r at level 1
Figure 8.2 & Figure 9.2
Original Image Noisy Image
BayesShrink with Db 5 at level 2 SureShrink with Db 5r at level 2
Figure 8.3 & Figure 9.3
Original Image Noisy Image
BayesShrink with Db 5 at level 3 SureShrink with Db 5r at level 3
Figure 8.4 & Figure 9.4
Original Image Noisy Image
BayesShrink with Db 5 at level 4 SureShrink with Db 5r at level 4
ISSN(Online): 2320-9801
ISSN (Print): 2320-9798
I
nternational
J
ournal of
I
nnovative
R
esearch in
C
omputer
and
C
ommunication
E
ngineering
(An ISO 3297: 2007 Certified Organization)
Vol. 3, Issue 5, May 2015
Copyright to IJIRCCE 10.15680/ijircce.2015.0305001 4614
V. EXPERIMENTAL RESULTS
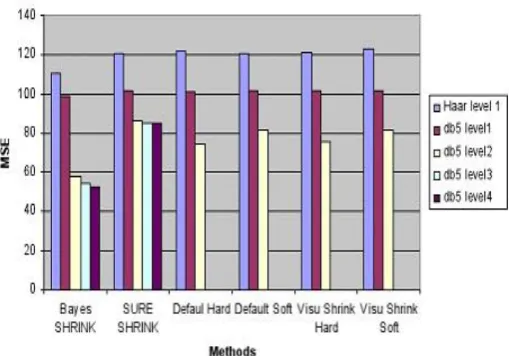
Following are the results of running the denoising algorithms for the methods discussed above on my picture. The denoising is done after adding the Gaussian noise with standard deviation 18 and mean 0 in the original picture. The MSE is calculated and compared for all the methods (see Figure 10). The results are provided as a bar chart in the end as well they are tabulated. The figures and MSE are compared for the global and adaptive thresholding techniques. The results are provided for thresholds selected by VisuShrink hard and soft methods and thresholds selected by default universal threshold for hard and soft thresholding. Similar thing is done with the BayesShrink and SureShrink methods.
Figure 10: Comparison between all the models based on MSE
VI.CONCLUSION AND FUTURE WORK
We have seen that wavelet thresholding is an effective method of denoising noisy signals. We first tested hard and soft
on noisy versions of the standard 1-D signals and found the best threshold. We then investigated many soft thresholding schemes such as VisuShrink, SureShrink and BayesShrink for denoising images. We found that subband adaptive thresholding performs better than a universal thresholding. Among these, BayesShrink gave the best results. This validates the assumption that the GGD is a very good model for the wavelet coefficient distribution in a subband. An important point to note is that although SureShrink performed worse than BayesShrink, it adapts well to sharp discontinuities in the signal. This was not evident in the natural images we used for testing. It would be instructive to compare the performance of these algorithms on artificial images with discontinuities (such as medical images). It would be interesting to try denoising (and Compression) using other special cases of the GGD such as the Laplacian (GGD with β = 1). Most images can be described with a GGD with shape parameter β ranging from 0.5 to 1. So a Laplacian prior may give better results than a Gaussian prior (β = 2) although it may not be as easy to work with.REFERENCES
1. Carl Taswell, The what, how and why of wavelet shrinkage denoising, Computing in science and Engineering, pages 12-19, May/June 2000
2. David L Donoho. De-noising by soft thresholding. IEEE Transactions on Information Theory, 41(3):613–627, May 1995. 3. David L Donoho. Ideal spatial adaptation by wavelet shrinkage. Biometrika
4. Iain M.Johnstone David L Donoho. Adapting to smoothness via wavelet shrinkage. Journal of the Statistical Association, 90(432): 1200–1224, Dec 1995.
5. Maarten Jansen. Noise Reduction by Wavelet Thresholding, volume 161. Springer Verlag,United States of America,1 edition, 2001. 6. Martin Vetterli S Grace Chang, Bin Yu. Adaptive wavelet thresholding for image denoising and compression. IEEE Transactions on
ISSN(Online): 2320-9801
ISSN (Print): 2320-9798
I
nternational
J
ournal of
I
nnovative
R
esearch in
C
omputer
and
C
ommunication
E
ngineering
(An ISO 3297: 2007 Certified Organization)
Vol. 3, Issue 5, May 2015
Copyright to IJIRCCE 10.15680/ijircce.2015.0305001 4615
BIOGRAPHY