Strategies of an Efficient Algorithm PARM to
Generate Association Rules Mining Technique
Based on Spatial Data
Pallavi Rathod, Prof. S. S. Dhande CSE Department, SGBAU Amravati University
SIPNA COET Amravati MH
Abstract—In the Association rule mining, originally proposed form market basket data, has potential applications in many areas. Spatial data, such as remote sensed imagery (RSI) data, is one of the promising application areas. Association Rule mining is one of the most popular data mining techniques which can be defined as extracting the interesting correlation and relation among large volume of transactions. Extracting interesting patterns and rules from spatial data sets, composed of images and associated ground data, can be of importance in precision agriculture, resource discovery, and other areas. However, in most cases, the sizes of the spatial data sets are too large to be mined in a reasonable amount of time using existing algorithms. In this paper, we propose an efficient approach to derive association rules from spatial data using Peano Count Tree (P-tree) structure. P-tree structure provides a lossless and compressed representation of spatial data. Based on P-trees, an efficient association rule mining algorithm with fast support calculation and significant pruning techniques is introduced to improve the efficiency of the rule mining process.
Keywords- Association rule mining, Data mining, Remote sensed imagery (RSI), Spatial data.
I. INTRODUCTION
The task of association rule mining is to find certain association relationships among a set of data items in a database. The association relationships are described in association rules. The task of discovering association rules was first introduced in 1993.Association rule mining, is totally determined for market basket data, has potential applications in many areas. Data mining is the process of extracting hidden patterns from large amounts of data and is increasingly important tool for transforming data into information. Spatial data, such as remote sensed imagery (RSI) data, are one of the most promising areas for association rule mining. With the quantities of RSI data being collected every day from satellites, aerial sensors, telescopes, and other sensor platforms are so huge that much of this data is archived before its value can be found. RSI data are collected in different ways and are organized in different formats. BSQ, BIL, and BIP are three main formats. Association rule mining technique is totally depends on RSI spatial data. An RSI image can be viewed as a 2-D array of pixels. Associated with each pixel are various descriptive attributes, called “bands” in remote-sensing literature. Association rules from spatial data using Peano Count Tree (P-tree) structure. P-tree structure provides a lossless and compressed representation of spatial data. Based on P-trees, an efficient association rule mining
II. REVIEW OF LITERATURE
Association rule mining is one of the important problems in data mining. The initial application of association rule mining was on market basket data. Recently, study on association rule mining has been extended to more areas, such as multimedia data[1] [2][3].Application areas include precision agriculture resource discovery and management; and natural disaster prediction, detection, and mitigation, to mention just a few[4]. Association rule mining is based on image features. In these, the problem is to find associations rules about the size, color, texture, shape of the images, and object identification in images[5]. This paper is different in that we focus on pixel-based association rules. We proposed multiple algorithms using P-trees for different types of data mining tasks. For example, we proposed an approach to derive low-support high-confidence rules. The problem of mining low-support high-confidence rules is very different from the one of mining high-support high confidence rules since most association rule mining algorithms rely on identifying frequent item sets with high support. Our proposed approach used a data cube, called Tuple Count Cube, which was built from P-trees, to generate high-confidence rules[6]. An RSI image can be viewed as a 2-D array of pixels. Associated with each pixel are various descriptive attributes, called “bands” in remote-sensing liter[7]. We have also proposed a P-tree-based algorithm for decision tree induction on spatial data. P-trees facilitate fast calculations needed in the generation of a decision tree, such as the calculation of information gain. P-trees are vertical representation of data, in contrast to traditional horizontal representation. the type of mining we perform on images, i.e., pixel-based mining, is different from traditional spatial data mining in the sense that it does not include the spatial properties in the rules[8]. Pixel-based data analysis is not new in remote-sensing research. For example, pixel-by pixel classification is introduced in to generate ground cover maps based on their multispectral data. It should also be noted that, due to the fact that spatial neighbors tend to be highly similar, large number of association rules might be generated however not all of them are significantly interesting and useful although they might have high support and high confidence[9][10]. Further statistical analysis may be used to test the significance of the rules.
III.REMOTE SENSED IMAGERY(RSI)
An RSI image can be viewed as a 2-D array of pixels. Associated with each pixel are various descriptive attributes, called “bands” in remote-sensing liter[7]. For examples of bands include visible reflectance bands (Blue, Green, and Red), infrared reflectance bands (e.g., NIR, MIR1, MIR2, and TIR), and possibly some bands of data gathered from ground sensors (e.g., yield quantity, yield quality, and soil attributes such as moisture and nitrate levels, etc.). All the values have been scaled to values between 0 and 255 for simplicity. The pixel coordinates in raster order constitute the key attribute. One can view such data as a relational table where each pixel is a tuple and each band is an attribute. Based on some existing experiments, the existing algorithms do not work well for
this type of task due to the complexity and large size of RSI data. Therefore, we propose an efficient model to perform association rule mining on RSI data. We use a bit Sequential (bSQ) format to organize images and the Peano Count Tree (P-tree) structure to represent bSQ files in a spatial-data-mining-ready way. P-trees are lossless representations of the image data, and the histograms are in a recursive quadrant-by-quadrant arrangement. By using P-trees, association rule mining algorithm with fast support calculation and significant pruning techniques is possible. Remote sensing can be defined as the acquisition and recording of information about an object without being in direct contact with that object. Spatial data, such as remote sensed imagery (RSI) data, are one of the most promising areas for association rule mining. With the quantities of RSI data being collected every day from satellites, aerial sensors, telescopes, and other sensor platforms are so huge that much of this data is archived before its value can be found. Application areas include in RSI are precision agriculture, resource discovery and management, and natural disaster prediction, detection, and mitigation. Example: In precision agriculture, association rules can be mined from RSI data to identify crop yield potential, insect and weed infestations, nutrient requirements, flooding damage, and other phenomena. We use an example of the derivation of association rules from RSI data to identify high and low agricultural crop yield potential because RSI is totally depends on association rule mining technique. These high and low agricultural crop yield potential is called as precision agriculture. RSI data are used in mid-growing season to determine additional inputs such as fertilizers, herbicides, etc.
A. RSI Image View
The concept of RSI covers a broad range of methods to include satellites, aerial photography, and ground sensors. A remote sensed image typically contains several bands or columns of reflectance intensities. RSI image can be viewed as a 2-D array of pixels. Associated with each pixel are various descriptive attributes, called “bands” in remote-sensing imagery. Examples of bands include visible reflectance bands such as blue, green, and red reflectance, infrared reflectance bands includes NIR, MIR1, MIR2, and TIR, and possibly some bands of data gathered from ground sensors e.g., yield quantity, yield quality, and soil attributes such as moisture and nitrate levels, etc. The pixel coordinates in raster order constitute the key attribute. One can view such data as a relational table where each pixel is a tuple and each band is an attribute. We proposed the association rule and in this we used the some special type of rule, such as NIR[192, 255]∧Red[0, 63] =>Yield[128, 255], which is Near Infrared reflectance at least 192 and Red reflectance at most 63 implies Yield willbe at least 128 and examples are bushel or acre or some normalized yield measurement. This type of rule expected in association rule.
B. Different RSI Data Formats
the relational format. In BSQ format, each band is stored as a separate file and each individual band uses the same raster order. TM scenes are in BSQ format. The Band Interleaved by Line (BIL) format stores the data in line-major order, i.e., the first row of all bands, followed by the second row of all bands, and so on. SPOT data, which comes from French satellite sensors, are in BIL format that shows in fig(a). Band Interleaved by Pixel (BIP) is a pixel-major format. Standard TIFF images are in BIP format. Spatial data was organized a format, called BSQ. A reflectance value in a band is a number in the range 0–255 and is represented as a byte. We split each band into eight separate files, one for each bit position. Each individual bit file is a bSQ file. bSQ files are related to the “bit planes” in image processing. In Fig.1, shows a simple example with only two data bands in a scene having only four pixels like two rows and two columns.
Fig -1: BSQ, BIP, BIL, and BSQ formats for a two-band2×2 image.
IV.P-TREES
Using Peano Count Tree (P-tree) structure we proposed an efficient approach to derive association rules from spatial data. P-tree structure provides a lossless and compressed representation of spatial data. Based on P-trees, an efficient association rule mining algorithm PARM with fast support calculation and significant pruning techniques is introduced to improve the efficiency of the rule mining process. The P-tree based Association Rule Mining (PARM) algorithm. In this strategies we discovered P-tree structure and P-tree operations.
A. P-Tree Structure Generation
We reorganize each bit file of the bSQ format into a tree structure, called a Peano Count Tree (P-tree). A P-tree is a quadrant wise , Peano-order-run-length compressed, representation of each BSQ file. In this we just divide the entire image into quadrants and record the count of 1 bits for each quadrant, thus forming a quadrant count tree. The P-trees are based on Peano ordering. Peano ordering was selected for several reasons. Compared to raster ordering, Peano ordering has better spatial clustering properties. Peano ordering facilitates compression of the count tree structures due to the probability that neighbouring pixels will be similar. Definition:A basic P-tree Pi, j is a P-tree for the jth bit of the ith band. The complement of basic
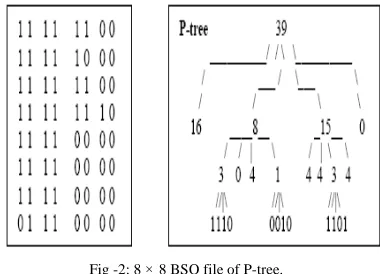
P-tree, Pi, j is denoted as Pi, j’. P-trees have the many features: (1)P-trees contain the count of 1’s for every quadrant of every dimension. (2)The P-tree for any sub quadrant at any level is simply the sub-tree rooted at that sub-quadrant. (3) A P-tree leaf sequence (depth-first) is a partial run-length compressed version of the original bit-band. (4) P-trees can be partially combined to produce upper and lower bounds on all quadrant counts. (5) Basic P-trees can be combined to reproduce the original data. (6) P-trees can be used to smooth data by bottom-up quadrant purification such as bottom-up replacement of mixed counts with their closest pure counts. Example: Fig shows an 8 × 8 BSQ file P-tree. In this example, 39 is the number of 1s in the entire image called root count. The root level is labeled level 0. The numbers 16, 8, 15, and 0 at the next level (level 1) are the 1-bit counts for the four major quadrants in raster order such as upper left, upper right, lower left, lower right. Since the first and last level-1 quadrants are composed entirely of 1 bits called pure-1 quadrant and 0 bits call pure-0 quadrant respectively, subtrees are not needed and these branches terminate. This pattern is continued recursively using the Peano also known as Z-ordering of the four sub-quadrants at each new level and every branch terminates. Since 8-bit data values for each band, there are eight P-trees and one for each bit position. Expanding all sub-trees, including with these for pure quadrants, the leaf sequence always in the Peano ordering of the image. The P-trees are always based on Peano ordering. Peano ordering was selected for several reasons and compared to raster ordering. Peano ordering was propose a better spatial clustering properties.
Fig -2: 8 × 8 BSQ file of P-tree.
B. P-Tree Variations
Fig -3: PM-tree of an 8*8 bSQ file
C. And, Or & Complement P-Tree Operations
There are three basic P-tree operations: complement, AND and OR. Each basic P-tree has a natural complement. The complement of a basic P-tree can be directly constructed from the P-tree by simply complementing the counts at each level shown in the fig5. The complement of basic P-tree Pi ,j is denoted as P’ i, j. Thus the complement of a P-tree provides the 0-bit counts for each quadrant. Fig.4 also shows AND/OR operations. AND is a very important and frequently used operation for P-trees. The AND operation is just the pixelwise
AND of bits from BSQ files or their complement files. For example, a pure-1 P-tree with any P-tree X will result in X to AND, a pure-0 P-tree with any P-tree will result in a pure-0 P-tree to AND, two non-pure P-trees will result in a non-pure P-tree unless all of the four subquants result in pure-0 quadrants. OR operation can be performed as similar as in AND operation. Among the three operations, AND is the most important. Besides basic operations, a P-tree can have other operations, such as XOR. XOR is an exclusive OR operation which gives the difference of two P-trees.
Fig -4: P-tree operations (Complement, AND, and OR).
V. AN EFFICIENT PARM ALGORITHM AND TECHNIQUES
For RSI data, we can formulate the association rule mining model. Let I be the set of all items and T be the set of all transactions. I = {(b, v)|b = band, v =value(1-bit, 2-bit, . . . ,or 8-bit)}, T = {pixels}.Admissible Itemsets also known as Asets are itemsets of the form, Int1 × Int2
×· · ·×Intn = Pii=1...n Inti, where Inti is an interval of values in Bandi. A k-band Aset also read as k-Aset is an Aset in which k of the Inti intervals are restricted i.e. in k of the bands the intervals are not all of [0, 255].We also use
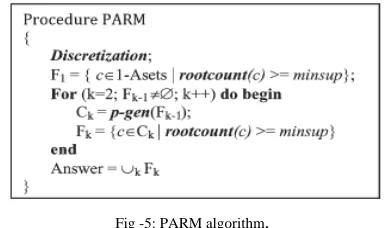
the notation [a, b]i for the interval [a,b] in band i. For example, [00, 10]2 indicates the interval [00, 10] which is [0, 191] in decimal in band 2.The root count of an Aset is the root count of its P-tree. The users may be interested in some specific kinds of rules. For an agricultural producer we used precision techniques, there is simple interest in rules of the type, Red > 48 => Green < 134. A physicist might be interested in such colour relationships but a producer is interested in rules with colour antecedents for e.g., yield consequents i.e. observed colour combinations that predict high yield or foretell low yield. Therefore, for precision agriculture applications, it makes sense to restrict our search to those rules that have a consequent in the yield band. We will refered for such rules to rules of interestto be distinct from interesting rules. Of-interest rules can be interesting or not interesting, depending on such measures as support. The candidate k-Asets are those of which (k-1)-Aset subsets are frequent. Next is a pruning technique based on the precision hierarchy. Once we find all the 1-bit frequent k-Asets, we can use the fact that a 2-bit k-Aset cannot be frequent if its enclosing 1-bit k-Aset is infrequent. A 1-bit Aset encloses a 2-bit Aset if, when the endpoints of the 2-bit Aset are shifted right 1-bit position, the 2-bit Aset is a subset of the 1-bit Aset. We proposed an algorithm called PARM algorithm, to mining association rules on RSI data using P-trees shown in Fig.5 PARM algorithm was based on the classic Apriori algorithm. The Apriori algorithm uses a levelwise approach to generate all the frequent itemsets, starting with frequent 1-itemsets.The fact is if an itemset is frequent, all its subset must also be frequent, the Apriori algorithm generates candidate (k + 1)-itemsets from frequent k-1)-itemsets and then calculates the support for each candidate (k + 1)-itemset to form frequent (k + 1)-itemsets. Therefore, in PARM algorithm we try to find all Asets that are frequent and of-interest. We are partitioning the data into intervals performed by the discretization function. Then, we find all frequent 1-Asets by checking the root count of the corresponding P-trees. The candidate k-Asets are those whose (k −1)-Aset subsets are frequent. The essential difference between the PARM algorithm and the Apriori algorithm is how the candidate Asets are counted. In PARM, Asets are counted by performing AND operations on corresponding basic P-trees, while in Apriori, it is done by scanning the entire data.
Fig -5: PARM algorithm.
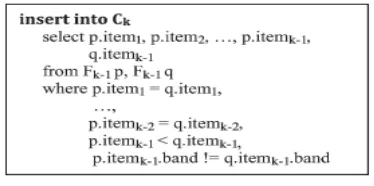
pruning is done. We use band-based pruning in the p-gen function. Since no value can be in multiple intervals in the same way, joining among intervals from the same band can be avoided. For example, even if [00, 01]1 and [11, 11]1 are frequent, there is no need to join them to form a candidate Aset ([00, 00]1 × [11, 11]1). P-gen only joins items from different bands. Two frequent (k −1)-Asets will be joined into a candidate k-Aset only if the first (k −1) items of both Asets are the same. The order of the last item is compared to avoid the generation of the duplicate
candidate Aset.
The join step in the p-gen function is shown in Fig.6. The rootcount function is directly used to calculate Aset counts by ANDing the appropriate basic P-trees instead of scanning the transaction databases. For example, in the Asets, {B1[0, 64),B2[64, 127)}, denoted as [00, 00]1 × [01, 01]2, the count is the root count of P1(00) AND P2(01). This provides fast support calculation and is particularly useful for large data sets.Fig -6: Join step in p-gen function.
There were interest in multi-level rules, which means that the different itemsets in the rule have different precision. Pruning Techniques: This technique is used in the PARM algorithm, several pruning techniques have been applied. Various pruning techniques are formed. 1) Basic Pruning Techniques in Frequent Itemset Mining: a) Band-based pruning. As we mentioned, band-based pruning is used in the p-gen function. Since a value cannot appear in more than one interval simultaneously, we do not need to join intervals from the same band. This band-based pruning technique is easy to implement; however, it improves the performance significantly. b) Consequent constraint pruning. We are only interested in of-interest rules with specified consequence, such as yield. Therefore, we only consider frequent itemsets with item in yield. This saves time by not considering the itemsets without yield even if the itemsets are frequent. This consequent constraint pruning is particularly useful when we are interested in finding the classification rules.
Pruning Technique Rule Generation: Confidence Based Pruning: Almost all the pruning techniques are support-based since support has downward closure property, namely, if an itemset is frequent, all its subsets must also be frequent. Here, we propose a confidence-based pruning technique. Let us look at an example first. Suppose we already have a frequent itemset L={A,B,C} (simplified as ABC); we want
to generate rules with high confidence. We can prove that, if conf(AB =>C ) < minconf then conf(A => BC ) <
minconf and conf(B =>AC ) < minconf Since conf(AB=>C)=sup(ABC)/sup(AB)< minconf, we have conf(A=>BC)=sup(ABC)/sup(A)<sup(ABC)/ sup(AB) < minconf.
VI.SPATIAL DATA CLASSIFICATION
Spatial data sharing and mapping, high-resolution remote sensing, and location-based services, more and more research domains have created or gained access to high-quality geographic data to incorporate spatial information and analysis in various studies. In this we proposed association rule mining technique for spatial data and also forms the spatial data classification. Spatial classification methods extend the general-purpose classification methods to consider not only attributes of the object to be classified but also the attributes of neighbouring objects and their spatial relations. Classification is about grouping data items into classes. Classification is also called supervised classification, as opposed to the unsupervised classification (clustering). ‘‘Supervised” classification needs a training dataset to train (or configure) the classification model, a validation dataset to validate (or optimize) the configuration, and a test dataset to evaluate the performance of the trained model. In the spatial data classification, classification has the many methods such as decision trees, artificial neural networks (ANN), maximum likelihood estimation (MLE), linear discriminant function (LDF),support vector machines (SVM). The task of classification is to assign an object to a class from a given set of classes based on the attribute values of this object. The relevant attributes are extracted by comparing the attribute values of the target objects with the attribute values of their nearest neighbours. The determination of relevant attributes is based on the concepts of the nearest hit and the nearest miss. In spatial classification the attribute values of neighbouring objects may also be relevant for the membership of objects.
VII. PROPOSED WORK AND OBJECTIVES
In this Work, we propose a new model to derive association rules from spatial data, such as RSI. In our model, the bSQ format and P-tree structure are used to organize and represent RSI data. The P-tree structure is a space-efficient lossless data-mining ready structure for spatial data sets. For association rule mining, P-trees facilitate advantages, such as fast support calculation and new pruning techniques. Similarly, P-trees can facilitate the fast calculation of other measurements, such as “interest” and “conviction,” defined in [2], as well as “information gain” in decision tree generation. P-trees have potential applications in areas other than precision agriculture. These areas include flood prediction and monitoring, community and regional planning, virtual archeology, mineral exploration, bioinformatics, VLSI design, and environmental analysis and control. Our future work includes extending P-trees to these and other application areas. Another interesting direction is the application of P-trees on sequential pattern mining. Spatial association rule is a rule indicating certain association relationship among a set of spatial and possibly some non-spatial predicates. Spatial classification methods extend the general-purpose classification methods to consider not only attributes of the object to be classified but also the attributes of neighbouring objects and their spatial relations.
With the quantities of RSI data being collected every day from satellites, aerial sensors, telescopes, and other sensor platforms are so huge that much of this data is archived before its value can be found. We use an example of the derivation of association rules from RSI data to identify high and low agricultural crop yield potential because RSI is totally depends on association rule mining technique. In this we can implement the apriori and param algorithm, in PARM, Asets are counted by performing AND operations on corresponding basic P-trees, while in Apriori, it is done by scanning the entire data. In this included the standard datasets for the association mining of spatial data was used the market basket data.
VIII. APPLICATIONS
The various application areas in which association rules can be applied for extracting useful information from the huge dataset are:
1. Market basket analysis:
A typical and widely used example of association rule mining is market basket analysis. For example, data are collected using barcode scanners in supermarkets. Such’ market basket’ databases consist of a large number of transaction records. Each record lists all items bought by a customer on a single purchase transaction. Managers would be interested to know if certain groups of items are consistently purchased together. They could use this data for adjusting store layouts (placing items optimally with respect to each other), for cross selling, for promotions, for catalog design and to identify customer segments based on buying patterns. Now days every product comes with bar code. The software supporting these barcode based purchasing/ordering systems produces vast amounts of sales data, typically captured in “baskets” (records in which the items purchased by a given consumer at a given time are grouped together). This data was quickly recognized by the business world as having immense potential value in marketing. In particular, commercial organizations are interested in discovering “association rules” that identify patterns of purchases, such that the presence of one item in a basket will imply the presence of one or more additional items. This “market basket analysis” result can then be used to suggest combinations of products for special promotions or sales, devise a more effective store layout, and give insight into brand loyalty and cobranding. Market basket can be defined as collection of items purchased by a customer in a single transaction (e.g. supermarket, web). 2. Precision agriculture:
In Precision agriculture, association rules can be mined from RSI data to identify crop yield potential, insect and weed infestations, nutrient requirements, flooding damage, and other phenomena. In this paper, we use an example of the derivation of association rules from RSI data to identify high and low agricultural crop yield potential.
3. Census data:
Censuses make a huge variety of general statistical information on society available to both researchers and the general public. The information related to population and economic census can be forecasted in planning public services(education, health, transport, funds) as well as in
public business(for setup new factories, shopping malls or banks and even marketing particular products).
4. CRM of credit card business:
Customer Relationship Management(CRM), through which, banks hope to identify the preference of different customer groups, products and services tailored to their liking to enhance the cohesion between credit card customers and the bank, has become a topic of great interest. Shaw mainly describes how to incorporate data mining into the framework of marketing knowledge management. The collective application of association rule techniques reinforces the knowledge management process and allows marketing personnel to know their customers well to provide better quality services. Song, proposed a method to illustrate change of customer behaviour at different time snapshots from customer profiles and sales data. The basic idea is to discover changes from two datasets and generate rules from each dataset to carry out rule matching.
IX.RESULT ANALYSIS AND PERFORMANCE OF PRUNING
TECHNIQUES
We compare our PARM algorithm with the FP-growth algorithm. For fairness, we set our algorithm to find all the frequent itemsets, not just those of interest (e.g., containing Yield). In other words, consequent constraint pruning is not applied for the comparisons, while the performance of consequent constraint pruning is separately given. We obtained identical rules by running FP- growth, and PARM algorithms. The images used were actual RSI images which is in number format. We tested our experiments on four real data sets. We used different image sizes to a maximum of 1320 × 1320 pixels. We only store the basic P-trees for each data set. As mentioned earlier, the cost of constructing basic P-trees is very small, and it is only a one-time cost; therefore, we did not include this cost in our experimental results.
A. Comparison of PARM With FP-Growth Algorithms
We implemented the PARM algorithm for our data sets. FP-growth uses a data structure called frequent pattern tree (FP-tree) to store compressed information about frequent patterns. We use the FP-growth object code and convert the image to the required file format in which each item is identified by an item ID. Our test suggests that FP-growth runs fast for data sets with fewer than 500000 transactions. When the data set size grows larger. This is because FP-growth is a memory-based algorithm.
30%. Table1 shows that FP-growth takes more time for generating the frequent items as compared to PARM algorithm. Also through the generation time and large data sets PARM can fastly mining the task rather than FP-growth.
Sr
no Support records PARM
Time
FP Growth Time
1 10% 28056 0.1 0.13
2 20% 28056 0.03 0.13 3 30% 28056 0.14 0.16 4 40% 28056 0.13 0.14 5 50% 28056 0.14 0.15 6 60% 28056 0.14 0.15 7 70% 28056 0.14 0.16 8 80% 28056 0.09 0.14 9 90% 28056 1.00 0.15
Table -1: Time Generation of PARM & FP-Growth
Graph -1: Scalability with support threshold compared to PARM and FP-growth.
B. Pruning Techniques Analysis
We have discussed various pruning techniques applicable in the PARM algorithm. In this section, the performance analysis of the two basic pruning techniques is given, including band-based pruning and consequent constraint pruning. Confidence-based pruning is only used in the rule generation phase; therefore, they were not individually evaluated. Our tests show that the support calculation using P-trees is the major factor toward the performance improvement of our algorithm. In addition to that, basic pruning techniques also made significant contribution to the performance improvement.
X. CONCLUSIONS AND FUTURE WORK
In this paper, presented the concept of association rule mining from spatial data such as remote sensed imagery (RSI) data ,it is one of the most promising area in the association rules mining and generates the frequent itemsets from large set of spatial data. Also the task of association rule mining is to find certain association relationships among a set of data items in a database. We reorganize each
bit file of the bSQ format into a tree structure, called a Peano Count Tree (P-tree). Using Peano Count Tree (P-tree) structure we proposed an efficient
approach to derive association rules from spatial data and it forms an efficient association rule mining algorithm i.e. PARM algorithm. P-tree structure provides a lossless and compressed representation of spatial data. Based on P-trees, PARM algorithm facilitates fast support calculation and significant pruning techniques is introduced to improve the efficiency of the rule mining process. P-tree can be constructed by performing AND, OR, and Complement operations on basic P-trees
ACKNOWLEDGMENT
I would like to thank Prof. S. S. Dhande and all teacher staffs and my friends and well-wishers who were a constant source of inspiration.
REFERENCES
[1] R. Agrawal and R. Srikant, “Fast algorithms for mining
association rules,” in Proc. Int. Conf. VLDB, 1994, pp. 487– 499.
[2] D. Karpuk, Metadata: From Resource Discovery to Knowledge Management. Westport, CT: Libraries Unlimited, 2006.
[3] Y. Aumann and Y. Lindell, “A statistical theory for quantitative association rules,” J. Intell. Inf. Syst., vol. 20, no. 3, pp. 255–283, May 2003.
[4] S. Brin, R. Motwani, J. D. Ullman, and S. Tsur, “Dynamic itemset counting an implication rules for market basket data,” in Proc. ACM SIGMOD Int. Conf. Manage. Data, 1997, pp. 255–264.
[5] Q. Ding, Q. Ding, and W. Perrizo, “Association rule mining
on remotely sensed images using P-trees,” in Proc. Pacific-Asia Conf. Knowl. Discovery DataMining. Berlin, Germany: Springer-Verlag, May 2002, vol. 2336, pp. 66–79.
[6] Qin Ding, Qiang Ding, and William Perrizo,” PARM—An
Efficient Algorithm to Mine Association Rules From Spatial Data”, IEEE TRANSACTIONS ON SYSTEMS, MAN, AND CYBERNETICS—PART B: CYBERNETICS, VOL. 38, NO. 6, DECEMBER 2008.
[7] Qin Ding,”ASSOCIATION RULE MINING ON REMOTELY
SENSED IMAGERY USING P-TREES”,A Dissertation Submitted to the Graduate Faculty of the North Dakota State University of Agriculture and Applied Science 2010.
[8] N. Hoque, B. Nath, and D. K. Bhattacharyya, “A new
approach on rare association rule mining,” International Journal of Computer Applications, vol. 53, no. 3, pp. 1–6, 2012.
[9] Subhasmita Mahalik 113050073 CSE,” SPATIAL DATA
MINING TECHNIQUES”, Department of Computer Science and Engineering Indian Institute of Technology, Mumbai 2012.
[10] Y. Huang, S. Shekhar, and H. Xiong, “Discovering colocation patterns from spatial data sets: A general approach,” IEEE Trans. Knowl. Data Eng., vol. 16, no. 12, pp. 1472–1485, Dec. 2004.
[11] B. Liu, W. Hsu, and Y. Ma, “Integrating classification and
association rule mining,” in Proc. ACM Int. Conf. KDD, 1998, pp. 27–31.
[12] R. Miller and Y. Yang, “Association rule mining over