3545
An Aerodynamics Analysis of Rear Wing of Formula –
1 car using Eppler E423 as Wing Profile
Piyush chavda
1, Prof. Darshan Ajudia
2,
Department of Mechanical Engineering1, 2, Marwadi Education Foundation, FOPG, Rajkot, Gujarat, India1, 2
Email: M.E student- [email protected], Assistant Professor- [email protected]
Abstract- In racing sport vehicles and Automobiles vehicles, the aerodynamics plays an important role in efficiency of the vehicle and engine performance. To maximize the performance of the vehicle, the aerodynamics forces acting on the automobile vehicle and how to utilize those forces for increasing the performances and stability. The wing or spoiler generally mounted on top of car’s rear end and also positioned under the front bumper. The low pressure zone at back end creates drag force on vehicle, which is overcome by using rear Spoiler. The different designs of rear spoiler used are based on the different type of the automobile vehicles and aerofoil used. In this study, we have chosen formula-1 car spoiler with Eppler E423 aerofoil profile for our analysis purpose. To perform analysis we have used commercial software CREO and AUTOCAD for solid modeling of F1 car wing body. After that for analysis we use CFD tools – ANSYS FLUENT. By this analysis we can find out lift and drag forces, distributions of pressure and velocity. It is found that E423 is suitable for higher speed and producing more negative lift as well as more drag. So possibly we can improve aerodynamics characteristics of Formula -1 or automobile vehicles.
Index Terms- CFD analysis, Co-efficient of drag and lift, Formula 1 rear wing, Eppler E423 Aerofoil, Turbulence Analysis
1. INTRODUCTION
Formula one’s racing event currently known as the FIA Formula One World Championship. Due to increasing nature of competition, changes in regulations, the ever increasing need to cut costs by reduced track testing and, maybe in the future, a freeze on design changes collectively contribute to the need of dependence on computer simulations for various aspects of performance enhancement. The aerodynamic design has two primary functions. First one, the creation of downforce to help improve the cornering force and pushes the car’s tires onto the track. Second one, to minimizing the drag that caused by turbulence and shape of car body or automobile vehicle and trying to slow the car down. Due to high strength-to-weight ratio, fiber-reinforced composites are often more profitable and efficient than conventional materials. The air flow over two different sides of rear wing of aerofoil contour, have to travel different distance by different speed produces pressure difference between sides of aerofoil. This pressure difference generates the downward force to the car. This pressure can make the wing tries to move in the direction of the low pressure called negative lift in this case of aerodynamics. As flow of air over the wing, it’s disturbed by the shape of aerofoil wing causing a drag force. Although this drag force generated due to shape of wing in air flow is generally less than lift or downforce.
2. LITERATURE REVIEW
3546 indicates that the AOA of maximum lift is between 13
and 14 degrees. The Eppler 423 airfoil gave the highest lift coefficients at Re = 1+e6. Xu-xia Hu et al. [7] were numerically researched for Rear spoiler Of Passenger Vehicle, Drag reductions for case 1 - 0.574 and Drag reductions for case 2 – 0.564. Development of aerodynamic in F1 cars now a day, almost all the team uses the advantages of CFD by means some CFD software packages. The results are produced without manufacturing or construction of the required F1 car and its components prototype, which is a main advantage of CFD. Analyze flow around F1 car rear wing with particular wing profile and its drag and lift generation to improve its performance.
Computational fluid dynamics (CFD) is widely used in the field of aerodynamics for design and analysis of aerospace and automobile vehicles. Different rear wing design gives different flow structure around body with respect to various parameters like speed, AOA, height, etc. In this study, we have used Solid modeling software of preparation of model and for meshing purpose ICEM CFD is used. Further, to perform analysis of rear wing of formula one car ANSYS FLUENT 17.2 was used.
3. OBJECTIVES
1. Design of aerodynamic rear wing of formula one’s car with Eppler E423.
2. Analyses the drag coefficient, Cd, lift coefficient, Cl, pressure and velocity variations at different speed for the designed aerofoil.
3. with having 1 camber length height and AOA (ᵒ) ‐2, 0, 2, 6, 10
4. METHODOLOGY
The model of formula one car’s rear wing with Eppler E423 aerofoil is prepared with commercial software using CREO and AUTOCAD. Then various aerofoils with different angle of attack will be made with base model.
Solver - Pressure based solver
Time – steady flow
Turbulence - K- ω model
Solution methods – SIMPLE – Gradient – least square call based – Pressure - second order
– Momentum – second order upwind – Turbulent kinetic energy - Second order
upwind
– Turbulent Dissipation rate – Second order upwind
Initialization- hybrid Initialization
Initialization iteration - 200
Solution iteration – 750
SST k-ω turbulent model is used for these analyses. K-ω includes two extra transport equations to represent turbulent properties. K-ω model is reported to perform better in transitional flows and in flows with adverse pressure gradients. The model is numerically very stable, especially the low- Re version, as it tends to produce converged solutions more rapidly than the k -ε models. K-ω model predicts well near wall So SST K- ω model is selected due to combines the k -ω and K- ɛ turbulence model such that the k-ω is used in the inner region of the boundary layer and switches to the K- ɛ in the free shear flow.
5. PHYSICAL MODEL
As we mention earlier, the physical model of rear wing of formula one car is modeled with help of commercial software CREO and AUTOCAD and the profile of wing is selected as Eppler E423. Which was also generated with help of CREO modeling software as per regulations of 2018 FIA FORMULA 4 TECHNICAL REGULATIONS [8] and Data points are extracted from Eppler E423 data chart. We generated different model on the basis of different AOA.
3547 Figure 2: Side view of Rear wing of Formula 1 car.
Table-1: Dimension of rear wing of Formula 1 car.
Sr. no
Parts Dimensions
1. Chord of aerofoil 235 mm 2. Maximum camber of
aerofoil
22.325 mm
3. Location of Maximum Camber from Leading edge
of aerofoil
97.29 mm
4. Maximum thickness of aerofoil
29.375 mm
5. Height of aerofoil from ground
235 mm (1 c)
6. Height of end Plate 300 mm 7. Width of end plate 250 mm 8. Wide span of Aerofoil 300 mm
6. DOMAIN SET-UP AND MESH GENERATION
[image:3.595.74.293.101.264.2]Domain is main part of analysis problem. In which, we focused region of flow phenomena. We have selected domain area around rear wing to capture proper fluid flow phenomena. The size of domain is
Table-2: Dimension of Domain of rear wing of Formula 1 car.
Sr. No Entity Dimensions
1. Inlet distance from leading Edge
1c (235 mm)
2. Outlet distance from trailing edge
1c (235 mm)
3. Domain 1235mm x
360mm x 360mm ( L x B x H)
Figure- 3: Domain of Rear Wing.
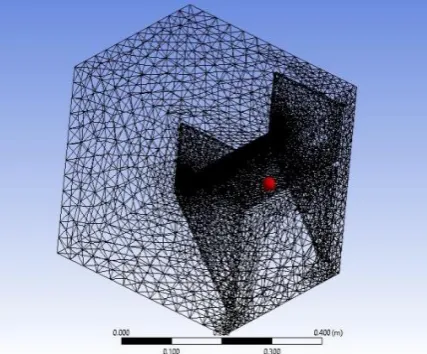
[image:3.595.308.525.372.498.2]The generation of mesh in domain area is done by using ICEM CFD. The generated elements are tetrahedral in nature. The mesh near to wall or periphery of aerofoil should be fine as possible to resolve and capture proper Fluid flow phenomena.
[image:3.595.311.525.526.703.2]Figure- 4: Isometric view of mesh of rear wing.
[image:3.595.72.299.573.675.2]3548
7. GOVERNING EQUATIONS
We consider a steady, 3D incompressible flow in a rectangular domain. All fluid properties are assumed to be constant. We assume no body forces acting on body of rear wing. Under these assumptions, the 3D incompressible Navier- Stokes equations and equations of co-efficient of lift and drag are
7.1 Continuity Equation
0
z
w
y
v
x
u
7.2 Momentum Equations
)
(
2 2 2 2 2 2z
u
y
u
x
u
x
p
g
Dt
Du
x
)
(
2 2 2 2 2 2z
v
y
v
x
v
y
p
g
Dt
Dv
y
)
(
2 2 2 2 2 2z
w
y
w
x
w
z
p
g
Dt
Dw
z
7.3 Navier-Stokes Equations
)
(
)
(
2 2 2 2 2 2z
u
y
u
x
u
x
p
g
z
u
y
u
x
u
u
t
u
x
)
(
)
(
2 2 2 2 2 2z
u
y
u
x
u
y
p
g
z
u
y
u
x
u
u
t
y
)
(
)
(
2 2 2 2 2 2z
u
y
u
x
u
z
p
g
z
u
y
u
x
u
u
t
z
7.4 Lift co-efficient
)
2
(
2A
V
L
Cl
[image:4.595.127.489.119.371.2]3549
)
2
(
2
A
V
D
Cd
[image:5.595.89.519.92.404.2]
Table-4: Grid Dependency Test
S r . N o
Nodes Element s
Cl Cd
1 125522 669595 -0.077042 0.0046470 2 169272 902040 -0.076528 0.0046379 3 248233 1320859 -0.075186 0.0046298 4 358821 1905777 -0.073513 0.0045979
Grid independency test was carried out on rear wing F-1 car model with EPPLER E423 aerofoil for refinement of results. From above 2nd test having minimum percentage changes of Cl and Cd, So we choose 2nd mesh size for further analysis.
8. VALIDATIONS
The various analyses performed on model of
different AOA chosen at two different speeds of
120KMPH and 180 KMPH. Different values of
Cl and Cd are obtained.
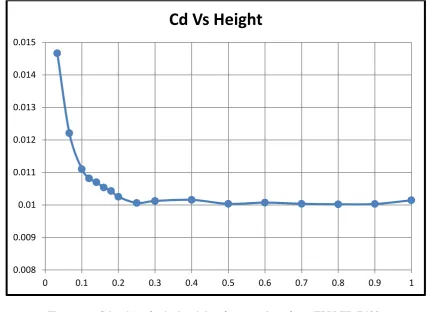
A constant AOA (ᵒ) = 6 is used and the
airfoil analysis are all run at the same speeds with
the same chord lengths as the first study of
validation and Re = 2,95,000. As from above plot
(Figure-5), we get almost same fashion as Grabis,
Michael
el at. [26](Figure-4) Performed but,
there is some change in value of Cd at different
ground clearance. This happens due to we have
done analysis in 3- dimensional geometry.
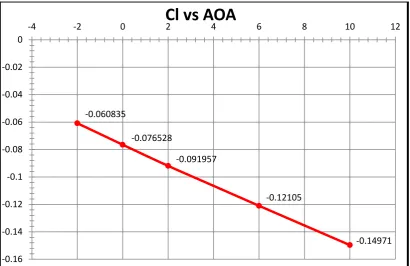
9. RESULTS AND DISCUSSION Results of EPPLER E423 at 120 KMPH
Table-5: Cl and Cd w.r.t Different AOA At 120 KMPH of EPPLER E423
AOA Cl Cd
-2 -0.060835 0.0037507
0 -0.076528 0.0046379
2 -0.091957 0.0057775
6 -0.12105 0.0089413
10 -0.14971 0.013122
Figure – 5: Cd vs h/c of calculated data for rear wing of car (EPPLER E423)
0.0080.009 0.01 0.011 0.012 0.013 0.014 0.015
0 0.1 0.2 0.3 0.4 0.5 0.6 0.7 0.8 0.9 1
[image:5.595.68.292.419.612.2]3550 From calculated data for EPPLER E423
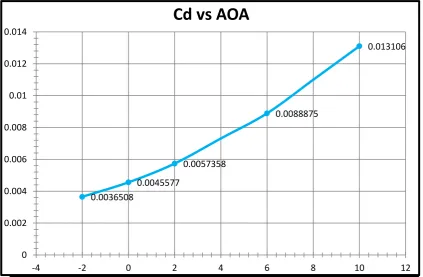
aerofoil at different AOA at 120 KMPH, It shows that there is steady increase in Negative lift of rear wing of F1 car. The fashion is observed in negative co-efficient of lift, Cl w.r.t increase in AOA (ᵒ) -2 to 10. The values of negative Cl are steadily increases from -0.060835 to -0.14971. There is increment in valve of co-efficient of drag, Cd from 0.0037507 to 0.013122, when AOA (ᵒ) are changes from -2 to 10.
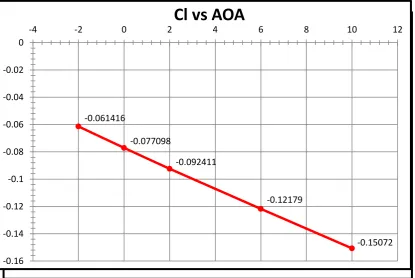
[image:6.595.106.517.102.368.2]Results of EPPLER E423 at 180 KMPH
Table- 6: Cl and Cd w.r.t Different AOA At 180 KMPH of EPPLER E423
AOA Cl Cd
-2 -0.061416 0.0036508
0 -0.077098 0.0045577
2 -0.092411 0.0057358
6 -0.12179 0.0088875
10 -0.15072 0.013106
From calculated data for EPPLER E423 aerofoil at different AOA at 180 KMPH, It shows that there is steady increase in Negative lift of rear wing of F1 car. The fashion is observed in negative co-efficient of lift, Cl w.r.t increase in AOA (ᵒ) -2 to 10. There is also increment in valve of co-efficient of drag, Cd from 0.0036508 to 0.013106, when AOA (ᵒ) are changes from -2 to 10.
Figure – 6: Value of Cl vs. different AOA at 120 KMPH of EPPLER E423 -0.060835
-0.076528
-0.091957
-0.12105
-0.14971
-0.16 -0.14 -0.12 -0.1 -0.08 -0.06 -0.04 -0.02 0
3551 Figure – 7: Value of Cd vs. different AOA at 120 KMPH of EPPLER E423
Figure – 9: Value of Cl vs. different AOA at 180 KMPH of EPPLER E423 0.0037507
0.0046379
0.0057775
0.0089413
0.013122
0 0.002 0.004 0.006 0.008 0.01 0.012 0.014
-4 -2 0 2 4 6 8 10 12
Cd vs AOA
-0.061416
-0.077098
-0.092411
-0.12179
-0.15072
-0.16 -0.14 -0.12 -0.1 -0.08 -0.06 -0.04 -0.02 0
-4 -2 0 2 4 6 8 10 12
3552 Figure – 8: Cd vs. Cl of 120 KMPH of EPPLER E423
[image:8.595.95.519.440.707.2]Figure – 10: Value of Cd vs. different AOA at 180 KMPH of EPPLER E423
Figure – 11: Cd vs. Cl of 180 KMPH of EPPLER E423 -2
0
2
6
10
-0.16 -0.14 -0.12 -0.1 -0.08 -0.06 -0.04 -0.02 0
0 0.001 0.002 0.003 0.004 0.005 0.006 0.007 0.008 0.009 0.01 0.011 0.012 0.013 0.014
Cl vs Cd
0.0036508
0.0045577
0.0057358
0.0088875
0.013106
0 0.002 0.004 0.006 0.008 0.01 0.012 0.014
-4 -2 0 2 4 6 8 10 12
Cd vs AOA
-2
0
2
6
10 -0.16
-0.14 -0.12 -0.1 -0.08 -0.06 -0.04 -0.02 0
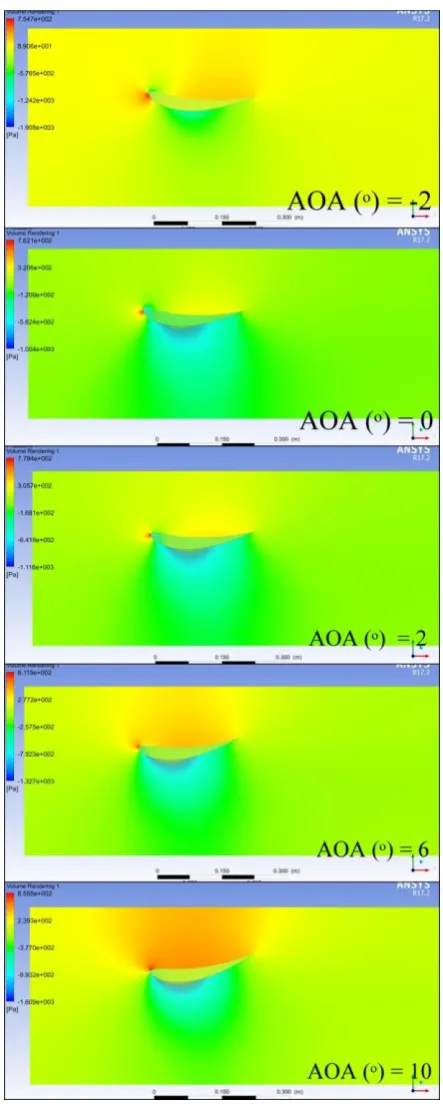
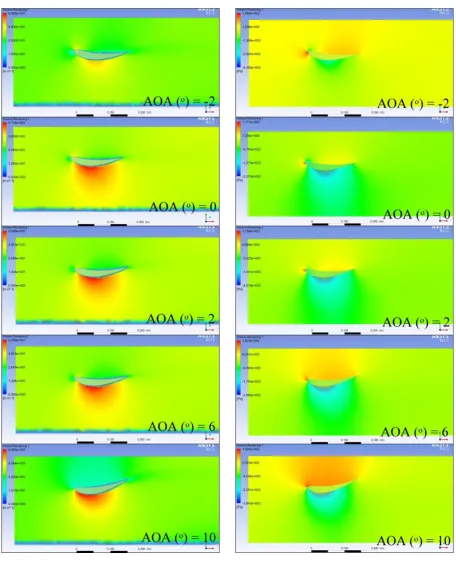
3553 From figure 12 and 14, the stagnation point shifts
bottom to top on leading edge as AOA (ᵒ) changes to -2 to 10. The small lower pressure zone exists at AOA (ᵒ) is equal to -2 and 0. There is big lower pressure zone observed at bottom side of aerofoil, when AOA (ᵒ) changes to -2 to 10. The Spoiler resists the flow of the Fluid passing on the airfoil, which creates the drag force to be increased. The frontal projected area of airfoil to the flow of fluid is gradually increased when AOA (ᵒ) changes from -2 to 10. This fashion observed at both speed of car (120 KMPH, 180 KMPH) for different AOA (ᵒ) = -2 to 10 of Eppler E423 airfoil profile. But EPPLER E423 airfoil generates higher negative lift at 180 KMPH than 120 KMPH and generates lower drag at 180 KMPH than 120 KMPH.
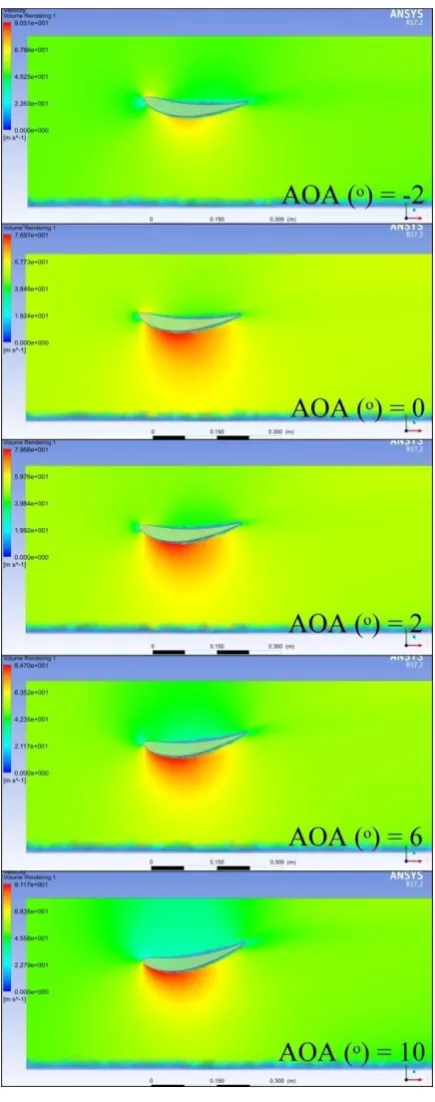
There is two high velocity zone seen in velocity distribution contours. The two high velocity zones are present – smaller and larger. The small high velocity zone is at top side of airfoil and near leading edge (Figure 13 and 15). The size of small high velocity zone exists when AOA (ᵒ) is equal to -2 to 0, the small high velocity zone vanishes at AOA (ᵒ) = 2. The big high velocity zone always present at bottom side of airfoil. There is also two low velocity zone see in velocity distribution contours. The two low velocity zones are present – smaller and larger. The smaller lower velocity zone is present near at leading edge of airfoil and also it shift from bottom side of airfoil to top side of airfoil as AOA (ᵒ) changes to -2 to 10. The small low velocity zone is merges to big low velocity zone at AOA (ᵒ) is equal to 10. The big small velocity zone is seen as AOA (ᵒ) changes to -2 to 10. Also there is low velocity zone found behind the airfoil. It can be seen that the air flow behind the spoiler is being disturbed. This low velocity zone produces drag and negative effect to negative lift of rear wing of car. The growth of low velocity zone behind the airfoil is increases as AOA (ᵒ) changes to -2 to 10. It clearly indicates that the velocity in the lower side increases with increase in AOA. This fashion observed at both speed of car(120 KMPH, 180 KMPH) for different AOA (ᵒ) = -10 to 10 of EPPLER E423 airfoil profile.
EPPLER E423 airfoil produces higher negative lift Cl at higher speed of F1 car.
EPPLER E423 airfoil produces lower drag Cd at higher speed of F1 car.
EPPLER E423 airfoil produces higher lift Cl as AOA is increases.
[image:9.595.306.528.94.648.2] EPPLER E423 airfoil is suitable for higher speed of F1 car due to its produces lower drag Cd as well as higher negative lift Cl.
3554 Figure – 13: Velocity Contours of 120 KMPH of
[image:10.595.72.529.91.653.2]EPPLER E423
3555 Figure – 15: Velocity Contours of 180 KMPH of
EPPLER E423
10.CONCLUSIONS
Computational analysis using ANSYS FLUENT to predict flow around Rear wing of race car has been achieved. 3-D external flows around the rear wing of formula one car were investigated. In this study, three
parameters were taken into consideration, AOA, speed of car, Eppler E423 Aerofoil. By comparing the results of various cases of different AOA and speed of car, we can get information about aerodynamics of Formula one car. The aerodynamic of racing cars can be improved by use of computational fluid dynamics. The set of results and observations included in this paper suggests that CFD can be a very useful tool to support the aerodynamic design of race cars.
REFERENCES
[1] Francesco Mariani, Claudio Poggiani, Francesco Risi, Lorenzo Scappaticci “Formula SAE car racing: Experimental and numerical analysis of the external aerodynamics” ELSEVIER-Energy Procedia,Volume 81, December 2015, Pages 1013-1029
[2] S.M. Rakibul Hassan, Toukir Islam, Mohammad Ali, Md. Quamrul Islam “Numerical Study on Aerodynamic Drag Reduction of Racing Cars” ELSEVIER – Procedia Engineering Volume 90, 2014, Pages 308-313
[3] Sneh Hetawala, Mandar Gophaneb, Ajay B.K.c, Yagnavalkya Mukkamalad “Aerodynamic Study of Formula SAE Car” ELSEVIER - Procedia Engineering Volume 97, 2014, Pages 1198-1207 [4] C.V.Karthick, Bala Murugan, P.A.Nigal Ashik,
P.Raju “CFD Analysis and Optimization of a Car Spoiler” Research India Publications - International Journal of Mechanical Engineering and Research, ISSN 0973-4562 Vol. 5 No.1 (2015)
[5] Wael A. Mokhtar “A Numerical Parametric Study of High-Lift Low Reynolds Number Airfoils” 43rd AIAA Aerospace Sciences Meeting and Exhibit, 10 – 13 January 2005, Reno, Nevada [6] Ravon Venters and Brian Helenbrook “A
numerical investigating of high lift coefficient airfoils near regions of stall” Proceedings of the
ASME 2013 Fluids Engineering Division Summer Meeting, FEDSM2013 July 7-11, 2013, Incline Village, Nevada, USA
[7] Xu-xia Hu, Eric T.T. Wong “A Numerical Study On Rear-spoiler Of Passenger Vehicle” World Academy of Science, Engineering and Technology 57 2011
[8] A.Muthuvel, N. Prakash , J. Godwin John “Numerical Simulation of Drag Reduction in Formula One Cars” International Journal of Engineering Research and Applications (IJERA), March – 2014, ISSN: 2248-9622.
3556 [10] Piyush Chavda, Darshan Ajuida “Computational
Analysis of Aerodynamics Effects of a Rear Wing/Spoiler of Formula –1Car.”International Journal of Engineering Research in Mechanical and Civil Engineering (IJERMCE) Vol 3, Issue 4, April 2018
[11] Grabis, Michael and Agarwal, Ramesh K. “Computational Fluid Dynamics Analysis of High Lift, Single Element, Inverted Airfoils in Ground Effect for an FSAE Car Front Wing”. Mechanical Engineering and Materials Science Independent Study 2017 – 59
APPENDIX
Cl =Co-efficient of Lift
Cd = Co-efficient f drag
AOA = Angle of Attack
ν= The Effective Viscosity or Turbulent eddy viscosity
τ ij = The shear-stress tensor.
P = Pressure of Fluid
u = Velocity of Fluid in x direction.
ρ = Density of Fluid
K = Turbulent Kinetic Energy
ɛ = Rate of dissipation of Kinetic Energy ω = The Specific Rate of Dissipation
d = The Distance from the field point to the nearest wall
![Figure – 4: Cd vs H, data of Grabis, Michael el at. [12]](https://thumb-us.123doks.com/thumbv2/123dok_us/736009.1083395/4.595.127.489.119.371/figure-cd-vs-h-data-grabis-michael-el.webp)