Volume 4, No. 11, Nov-Dec 2013
International Journal of Advanced Research in Computer Science
RESEARCH PAPER
Available Online at www.ijarcs.info
ECG feature extraction and classification for Arrhythmia using wavelet & Scaled
Conjugate-Back Propagation Neural Network
Mangesh Singh Tomar1,Manoj Kumar Bandil2, D B V Singh3
M.tech Student, Measurement and Control Engineering, ITM University Gwalior, India [email protected], [email protected], [email protected]
Abstract— Electrocardiogram (ECG) plays an imperative role in heart disease diagnostics, Arrhythmia is a cardiological disorder with prevalence of the world’s population..The purpose of this research to discusses the electrocardiogram analysis because this problems concerning health issue which encourage the present research. The main objective of our research is to analyze the acquired ECG signals using signal processing tools such as wavelet transform and Neuro classifier, classify them.. Total 62 ECG data subjects were analyzed. These data were grouped in two classes i.e, Normal class, and Arrhythmia class respectively. In order to achieve this we have applied a back-propagation based neural network classifier. DWT coefficients are used to extract the relevant information(statistical feature) from the ECG input data which are Energy, Variance, power Spectrul Density, Mean and Standard Deviation and morphological feature from the ECG input data which are mean and standard deviation of Magnitude of P,Q,R,S,T peak & PQ, QR,RS,ST,PR,QRS interval & RR interval. Then the extracted features data is analyzed and classified using Adaptive Neuro System (ANNS) as a Neuro classifier. The proposed algorithm is implemented and also tested in MATLAB software. The ECG signal are being selected and tested from PhysioNet Database using MIT-BIH Arrhythmia Database, and & Normal Sinus Rhythm (NSR) database. 14 subjects from Normal set and 48 subjects from arrhythmia set were analyzed for feature extraction and classification and data were divided in training, testing and validation of proposed algorithm. The ANNS system successfully classifies the Normal, Arrhythmia signal with the rate of overall accuracy is 98.4%. The analysis system also can achieved the sensitivity up to 100% for normal class and 97.9% for arrhythmia class, respectively for each class tested
Keywords: ECG, Arrhythmia, , Discrete Wavelet Transform (DWT), BPNN, Accuracy
I. INTRODUCTION
Monitoring Heart activity through the electrocardiogram (ECG) has become an important tool in the diagnosis of arrhythmia. Electrocardiogram (ECG) is the electrical manifestation of the contractile activity of the heart that can be recorded fast and automatically. It is a noninvasive diagnostic tool, meaning that ECG signal can be measured without entering the body at all. A natural electrical system causes the heart muscle to contract and pump blood through the heart to the lungs and the rest of the body. An ECG translates the heart electrical activity into line tracings on paper which shown in Figure 1. The spikes and dips in the line tracings are called waves which are P wave, QRS complex, T wave and PR and ST segment a. P wave: When the electrical impulse is conducted from
the SA node towards the AV node and spreads from right to left atrium, the depolarization (contraction) of the atria occurs. The depolarization of atria results the P Wave in the ECG [22].
b. T wave: Ventricular repolarisation results the preceding of ST segment and the T wave.
c. U wave: The origin of U wave is not clear and it is rarely seen. It is probably produced due to the repolarisation of the papillary muscles [14].
d. The PR interval: The PR interval begins with the onset of the P wave (Pi) and ends at the onset of the Q wave (Qi). It represents the duration of the conduction through the atria to the ventricles. Normal measurement for PR interval is 120ms-200ms.
e. QRS complex: The QRS complex consists of three waves, sequentially known as Q, R and S. The rapid depolarization of both the ventricles results this complex. The muscles of the ventricles have large muscle mass than that of atria, hence its amplitude is
much larger than that of P wave.
f. The ST segment: The ST segment represents the time between the ventricular depolarization and the repolarisation. The ST segment begins at the end of the QRS complex (called J point) and ends at the beginning of the T wave. Normally, the ST segment measures 0.12 second or less. The precise end of depolarization (S) is difficult to determine as some of the ventricular cells are beginning to repolarise.
g. The QT interval: The QT interval begins at the onset of the Q wave (Qi) and ends at the endpoint of the T wave (Tt), representing the duration of the ventricular depolarization/repolarisation cycle. The normal QT interval measures about 0.38 second, and varies in males and females and with age. As a general rule, the QT interval should be about 40 percent of the measured R-R interval.
The shapes of the ECG waveforms of different persons are different, so the differences of the waveform can be used to identify the different individual’s characteristic. The ECG signal can varies from person to person due to the differences in position, size anatomy of the heart, age, sex relative body weight and also chest configuration.
to increase the accuracy and sensitivity. Fourier transform analysis provides the signal spectrum or range of frequency amplitudes within the signal; however, Fourier transform only provides the spectral components, not their temporal relationships. Wavelets can provide a time versus frequency representation of the signal and work well on non-stationary data [4-6]. Other algorithms use morphological features [7], heartbeat temporal intervals [8], frequency domain features and multifractal analysis [9]. Autoregressive Modeling [10], RBF Neural Networks [11], selforganizing map [12], and fuzzy c-means clustering techniques [13].
[image:2.595.38.275.204.372.2]
Figure 1 Normal ECG Waveform
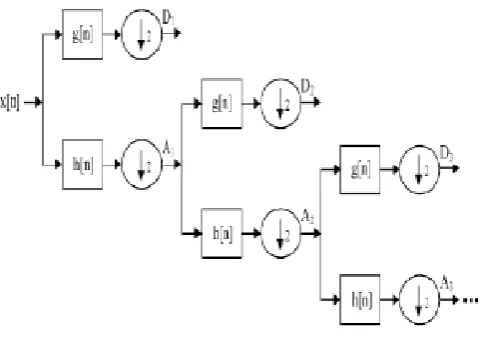
[image:2.595.39.279.603.772.2]a. Wavelet Transform- The discrete wavelet transform (DWT) is quite an effective tool for Time-Frequency analysis of signals. Wavelet transform can be defined as a spectral estimation technique in which any general function can be expressed as a sum of an infinite series of wavelets. in dwt the time-scale representation of the signal can be achieved using digital filtering techniques. The approach for the multi-resolution decomposition of a signal x(n) is shown in Fig. 2. The DWT is computed by successive low pass and high pass filtering of the signal x (n). Each step consists of two digital filters and two down samplers by 2. The high pass filter g[] is the discrete mother wavelet and the low pass filter h[.] is its mirror version. At each level the down sampled outputs of the high pass filter produce the detail coefficients and that of low pass filter gives the approximation coefficients. The approximation coefficients are further decomposed and the procedure is continued as shown in figure.2.
Figure 2 Computation process of DWT
The standard equation of Discrete Wavelet Transform is given as-
wm,n x(t), m,n a0m / 2∫ f (t) (a0m (t)− nb0 )dt (1.1) Where sub wavelets is given by-
m,n (t) a0m / 2 (a0m (t)− nb0 ) m, n Z
(1.2)
Where a(k)(l) and d(k)(l) are the approximation coefficients and the detail coefficients at resolution k, respectively. The wavelet transform gives us multi-resolution description of a signal. It addresses the problems of non-stationary signals and hence is particularly suited for feature extraction of ECG signals [15]. At high frequencies it provides a good time resolution and for low frequencies it provides better frequency resolution, this is because the transform is computed using a mother wavelet and different basis functions which are generated from the mother wavelet through scaling and translation operations. Hence it has a varying window size which is broad at low frequencies and narrow at high frequencies, thus providing optimal resolution at all frequencies.
b. Data base- The ECG signals were downloaded and recorded from the PhysioBank database using MIT-BIH Arrhythmia Database which are generally recognized as a standard test bench for the evaluation of arrhythmia detectors and basic research of cardiac dynamics. to investigate the ECG signal by patient monitors in real ICU settings.
Since 1975, our laboratories at Boston's Beth Israel Hospital (now the Beth Israel Deaconess Medical Center) and at MIT have supported our own research into arrhythmia analysis and related subjects. One of the first major products of that effort was the MIT-BIH Arrhythmia Database and Normal Sinus Rhythm (NSR) database, which we completed and began distributing in 1980. The database was the first generally available set of standard test material for evaluation of arrhythmia detectors, and has been used for that purpose as well as for basic research into cardiac dynamics at more than 500 sites worldwide. The MIT/BIH arrhythmia database [21] is used in the study for performance evaluation. The database contains 48 records, each containing two-channel ECG signals for 30 min duration selected from 24-hr recordings of 47 individuals. There are 116,137 numbers of QRS complexes in the database [20].The subjects were taken from, 25 men aged 32 to 89 years, and 22 women aged 23 to 89 years and the records 201 and 202 came from the same male subject. Each recording includes two leads; the modified limb lead II and one of the modified leads V1, V2, V4 or V5. Continuous ECG signals are band pass-filtered at 0.1–100 Hz and then digitized at 360 Hz. And NSR data base is also taken from male & female of different age group and its sampled at 125Hz . Twenty-three of the recordings (numbered in the range of 100–124) are intended to serve as a representative sample of routine clinical recordings and 25 recordings (numbered in the range of 200–234) contain complex ventricular, junctional, and supraventricular arrhythmias. The database contains annotation for both timing information and beat class information verified by independent experts [19].
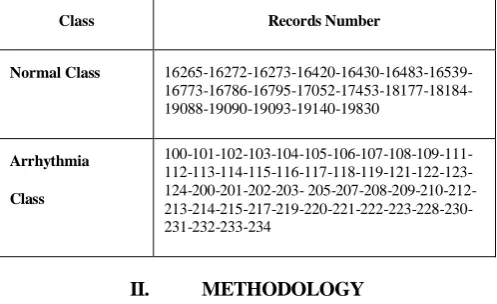
Distribution of records of MIT-BIH NSR & arrhythmia database
Class Records Number
Normal Class
16265-16272-16273-16420-16430-16483-16539- 16773-16786-16795-17052-17453-18177-18184-19088-19090-19093-19140-19830
Arrhythmia
Class
100-101-102-103-104-105-106-107-108-109-111- 112-113-114-115-116-117-118-119-121-122-123-124-200-201-202-203- 205-207-208-209-210-212- 213-214-215-217-219-220-221-222-223-228-230-231-232-233-234
II. METHODOLOGY
[image:3.595.34.283.55.207.2]DWT successfully analyses the multi-resolution signal at different frequency bands, by decomposing the signal into approximation and detail information. The method for frequency band separation for epilepsy detection is implemented in MATLAB 2013a. The flowchart of the proposed methodology for detection of arrhythmia data from normal data in The block diagram of employed method is shown in figure 3. From the figure the whole methodology is divided into three basic parts: Preprocessing, feature extraction and classification. it can be seen that the raw ECG signal is offered for preprocessing. The original ECG signal should be pre-processed with the purpose of removing existed noises of ECG and preparing this processed signal for the next stage. The preprocessing stage further divided into de-noising and Baseline wander removal of ECG signal. The next stage of the proposed model is feature extraction that is preparing the input which best characterize the original signal. Final step of the method is to classify the processed signal into the normal and arrhythmia class.
Figure 3 Steps of Detection of Arrhythmia Using ECG
III. PREPROCESSING
The first stage of ECG signal processing is preprocessing, where it is necessary to eliminate noises from input signals. For pre-processing of the ECG signal, noise
elimination involves different strategies for various noise sources [3]. This pre- process of ECG signal is done before the extracting the feature, can result better extracted features to increase the system efficiency. Preprocessing of ECG signal consists of De-noising of ECG signal and baseline wander removal [16]
IV. FEATURE EXTRACTION
After the noise elimination, (baseline wanders removal) and peak detection it is necessary to extract the feature of the ECG waveform in order to use it in the next stage of ECG signal analysis. The ability to manipulate and compute the data in compressed parameters form is one of the most important application of wavelet transform, are often known as features. Feature extraction is the most important step in pattern recognition. (1) There are several ways to extract the feature of ECG signal. In this work, there are two types of features are extracted of ECG waveforms.
a. Morphological feature of ECG signal b. Wavelet co-efficient based features
Selection of appropriate Feature plays an important role in pattern recognition. The computed DWT coefficients present a compact representation that demonstrates the energy distribution of the signal in time and frequency [17]. In this stage by using daubechies wavelet of order four with level five extracted the statically feature Hence, the calculated approximation and detail wavelet coefficients of the ECG signals were applied as the feature vectors representing the signals. Direct using of wavelet coefficient as inputs to the neural network may increase the neuron numbers in hidden layer which in turn has a harmful impact on network operation. In order to minimize the dimensionality of the extracted feature vectors, the statistics of the wavelet coefficients were utilized.[1] The following statistical features were utilized to represent the time-frequency distribution of the ECG waveforms:
a. Mean of the absolute values of the details and approximation coefficients at each level.
b. Standard deviation of the details and approximation coefficients in each level.
c. Variance values of the details and approximation coefficients at each level.
d. Power Spectral Density of ECG Signal
e. Shanon Entropy(Energy) of Periodogram of ECG Signal
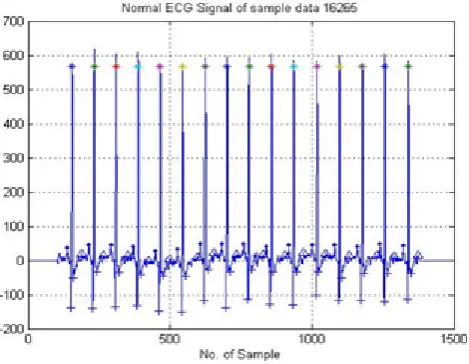
Finally for each of ECG signal(sample) 20 wavelet based feature have been obtained. Apart from statistical feature, the morphological feature of ECG signal is also obtained. These feature , mean and standard deviation of maximum values of P, Q, R, S, T peaks and duration of PQ,QR,RS,ST,QRS,PR,RR interval .hence 24 morphological features obtained Therefore the total 44 feature have been obtained to apply as an input to the neural network.Since the quantities of the feature vector may be quite different, a normalization process is required to standardize all
The following feature which obtained are shown in block dia.
Figure 4 Block dia. for Statistical and morphological features
These signals were analyzed using matlab to
decompose it using DWT with db4 as mother wavelet and the level of decomposition as 5. The MATLAB commands used for the feature extraction are as follows-:
Signal Processing Tool MATLAB Command
Wavelet Decomposition wavedec
Detail Coefficients detcoef
Approximation Coefficients appcoef
Shannon Entropy wentropy
[image:4.595.41.559.290.780.2]PSD using Periodogram periodogram
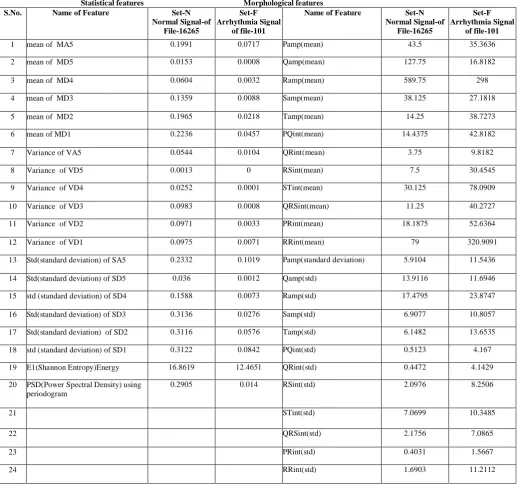
Table 2 List of Statistical (wavelet based) and morphological features for one sample of Each Set
Statistical features Morphological features
S.No. Name of Feature Set-N
Normal Signal-of File-16265
Set-F Arrhythmia Signal
of file-101
Name of Feature Set-N
Normal Signal-of File-16265
Set-F Arrhythmia Signal
of file-101
1 mean of MA5 0.1991 0.0717 Pamp(mean) 43.5 35.3636
2 mean of MD5 0.0153 0.0008 Qamp(mean) 127.75 16.8182
3 mean of MD4 0.0604 0.0032 Ramp(mean) 589.75 298
4 mean of MD3 0.1359 0.0088 Samp(mean) 38.125 27.1818
5 mean of MD2 0.1965 0.0218 Tamp(mean) 14.25 38.7273
6 mean of MD1 0.2236 0.0457 PQint(mean) 14.4375 42.8182
7 Variance of VA5 0.0544 0.0104 QRint(mean) 3.75 9.8182
8 Variance of VD5 0.0013 0 RSint(mean) 7.5 30.4545
9 Variance of VD4 0.0252 0.0001 STint(mean) 30.125 78.0909
10 Variance of VD3 0.0983 0.0008 QRSint(mean) 11.25 40.2727
11 Variance of VD2 0.0971 0.0033 PRint(mean) 18.1875 52.6364
12 Variance of VD1 0.0975 0.0071 RRint(mean) 79 320.9091
13 Std(standard deviation) of SA5 0.2332 0.1019 Pamp(standard deviation) 5.9104 11.5436
14 Std(standard deviation) of SD5 0.036 0.0012 Qamp(std) 13.9116 11.6946
15 std (standard deviation) of SD4 0.1588 0.0073 Ramp(std) 17.4795 23.8747
16 Std(standard deviation) of SD3 0.3136 0.0276 Samp(std) 6.9077 10.8057
17 Std(standard deviation) of SD2 0.3116 0.0576 Tamp(std) 6.1482 13.6535
18 std (standard deviation) of SD1 0.3122 0.0842 PQint(std) 0.5123 4.167
19 E1(Shannon Entropy)Energy 16.8619 12.4651 QRint(std) 0.4472 4.1429
20 PSD(Power Spectral Density) using periodogram
0.2905 0.014 RSint(std) 2.0976 8.2506
21 STint(std) 7.0699 10.3485
22 QRSint(std) 2.1756 7.0865
23 PRint(std) 0.4031 1.5667
The features calculated from the given set of data was collected together to form a feature vector of 44 features for 64 samples of data. After feature extraction we classified the data with neural network classifier to develop an efficient classification algorithm to classify various classes of ECG signal
Figure 5 morphological feature (Max. value P,Q,R,S,T peak)
V. CLASSIFICATION USING NEURAL NETWORK
In our research work we have implemented classification of ECG with help of Scaled Conjugate-Back Propagation Neural Network with hidden layer equal to 10 and initial weights assumed to be zero. For classification of features using neural network we need two important pre-defined parameters which are as follows-[18]
(a). Input Vector (b). Target Vector
a. Input Vector- In our research the feature vector was implemented as input vector. This input vector consists of a matrix of size 44X64 such that rows indicate the features and column indicates number of samples. The overview of input vector is discussed as follows- a) Number of rows = 44 (Representing number of
features of the samples as explained in table ) b) Number of columns=64 (Representing number of
respective samples taken for training, testing and validation of Neural Network Classifier).
i. Set-N-18 Samples (Normal Patients) ii. Set-F-48 Samples (Arrhythmia Patients)
b. Target Vector- In our research the results was implemented as target vector. This target vector consists of a matrix of size 2X64 such that rows indicate the target class and column indicates number of samples to be tested. The overview of target vector is discussed as follows-
a) Number of rows = 2 (Representing number of features of the samples as explained in table ) i. Class 1 – Normal Patient - (1 0)
ii. Class 2 – Arrhythmia Patient - (0 1 )
b) Number of columns=64 (Representing number of respective samples taken for training, testing and validation of Neural Network Classifier).
The overall classification was done using input vector and target vector with scaled conjugate gradient based back
propagation neural network.
In our classification process there are 44 input layers with 10 hidden layer and 2 output neurons for wavelet based and morphological features.
a. Input Neurons = Number of features b. Output Neuron = Number of Target
Classes
VI. RESULTS
Using MATLAB R2013a the overall classification was done using SCGA based Back propagation Neural Network Classifier. The results are shown as follows-
The overall Confusion Matrix for the given neural network is shown below-
Type of Dataset Accuracy
( ECG signal of Normal Patient )) 100% (ECG signal of Arrhythmic Patient )) 97.9%
Overall Accuracy of the Network 98.43%
The overall samples are divided into three categories- i. Training Data-70 % of total dataset.
ii. Testing Data- 15 % of total dataset. iii. Validation Data- 15 % of total dataset.
The Results is illustrated using graphs which are listed below-:
Table: 3
Signal Class Training
Set
Validatio n
Testin g
Total
Normal 1 8 3 3 14
Arrhythmia, 2 36 6 6 48
Total 44 9 9 62
Figure 6 Confusion Matrix for Neural Network
VII. COCNLUSIONS
In our research we have designed a soft computing based expert system for classification of Normal and Arrhythmia ECG signals of 64 samples of data. The overall conclusion can be summarized in following points-:
developed using Statistical and morphological features extraction and Soft Computing based classification tool
b. Total 64 samples of individual patients were analyzed as 18 samples from Normal and Arrhythmia patients.
c. Total 44 features for wavelet and morphological features were selected to develop features input vector for classifier
d. Classification process is carried out using SCGA-Back Propagation Neural Network Classifier. e. Overall efficiency of 98.4 percent is achieved in the classification process
VIII. REFERENCES
[1]. Hari Mohan Rai, Anurag Trivedi “Classification of ECG Waveforms for Abnormalities Detection using DWT and Back Propagation Algorithm” International Journal of Advanced Research in Computer Engineering & Technology Volume 1, Issue 4, June 2012
[2]. Maedeh Kiani Sarkaleh and Asadollah Shahbahrami “Classification of ECG Arrhythmias using discrete wavelet transform and neural networks” IJCSEA Vol.2, No.1, February 2012
[3]. Hari Mohan Rai, Anurag Trivedi, “De-noising of ECG waveforms using multiresolution wavelet transform”, intenational journal of computer application, vol. 45.issue 18, 2012
[4]. K. Minami, H. Nakajima and T. Toyoshima, “Real-Time discrimination of ventricular tachyarrhythmia with fourier-transform neural network”, IEEE Trans. on Biomed. Eng, vol. 46,(1999) pp.179-185.
[5]. I. Romero and L. Serrano, “ECG frequency domain features extraction: A new characteristic for arrhythmias classification”, in Proc.23rd Annual Int. Conf. on Engineering in Medicine and Biology Society,(2001) pp. 2006-2008.
[6]. P. de Chazal, M. O’Dwyer and R. B. Reilly,“A comparison of the ECG classification performance of different feature sets”, IEEE Trans. on Biomed. Eng, vol. 27,(2000) pp. 327-330.
[7]. P. de Chazal, M. O’Dwyer and R. B. Reilly, “Automatic classification of heartbeats using ECG morphology and heartbeat interval features”, IEEE Trans. on Biomed. Eng, vol. 51,(2004) pp. 1196-1206.
[8]. C. Alexakis, H. O. Nyongesa, R. Saatchi, N. D. Harris, C. Davis, C. Emery, R. H. Ireland and S. R. Heller, “Feature extraction and classification of electrocardiogram (ECG) signals related to hypoglycemia”, Proc. Computers in Cardiology, vol. 30, (2003)pp. 537-540. .
[9]. P. Ivanov, M. QDY, R. Bartsch, et al, “Levels of complexity in scaleinvariant neural signals”,Physical Review.(2009)
[10]. N. Srinivasan, D. F. Ge, S. M. Krishnan, et al “AutoregressiveModeling and Classification of Cardiac Arrhythmias”, Proceedings of the Second Joint Conference Houston. TX. USA -October 23-26,2W2
[11]. Hafizah Hussain, Lai Len Fatt, “Efficient ECG Signal Classification Using Sparsely Connected Radial Basis
Function Neural Network”, Proceeding of the 6th WSEAS International Conference on Circuits, Systems, Electronics,Control and Signal Processing, December 2007, pp. 412-416.
[12]. Marcel0 R. Risk, Jamil F. Sobh, J. Philip Saul, “Beat Detection and Classification of ECG Using Self Organizing Maps”, Proceedings - 19th International Conference - IEEEIEMBS Oct. 30 - Nov. 2, 1997 Chicago, IL. USA
[13]. Yuksel Ozbay, Rahime Ceylan, Bekir Karlik, “Integration of type-2 fuzzy clustering and wavelet transform in a neural network based ECG classifier”, Expert Systems with Applications. 38(2011), 1004-1010.
[14]. M. Gabriel Khan. “Rapid ECG Interpretation.” 3rd Edition, Humana Press, New York, ISBN- 978-1-58829-979-6, 2008
[15]. Daubechies, “The wavelet transform, time-frequency localization and signal analysis,”IEEE Trans. on Information Theory, vol. 36, no.5, pp. 961-1005, 1990.
[16]. Michel Misiti, Yves Misiti, Georges Oppenheim, Jean-Michel Poggi, “ Wavelet Toolbox for use with MATLAB” , vol. 1, march 1996
[17]. A. R. Sahab , Y. Mehrzad Gilmalek, “An Automatic Diagnostic Machine for ECG Arrhythmias classification Based on Wavelet Transformation and Neural Networks”, International Journal of Circuits, Systems And Signal Processing, Issue 3, Volume 5, 2011
[18]. S. Haykin, Neural Networks: A Comprehensive Foundation, New York: Macmillan, 1994.
[19]. T.Ince, S. Kiranyaz, and M. Gabbouj, “A generaric and robust system for automated patient-specific classification of ECG signals,” IEEE Trans. Biomed. Eng. vol. 56, pp. 1415-1426, 2009.
[20]. B.U. Kohler, C. Henning, and R. Orglmeister, “The principles of software QRS detection,” IEEE Eng. Med. Biol. Vol. 21, pp. 42–57, 2002
[21]. Http://www.physionet.org/physiobank/database/mitdb
[22]. Http://En.Wikipedia.Org/Wiki/Electrocardiography
Short Bio Data for the Authors
Mr.Mangesh Singh Tomar is M.tech Student in Measurement and Control Engineering at ITM University Gwalior, India. His field of interest & research includes Signal Processing, Soft Computing and Wavelet Analysis
Mr.Manoj Kumar Bandil is working as Associate prof. in Department of Electrical Engg. at Institute Of Information Technology and Management (ITM-GOI), Gwalior, India. His field of interest & research includes Biomedical Instrumentation System, EEG and inclusion of soft computing techniques in biomedical signal processing