Discourse Structure and Performance Analysis:
Beyond the Correlation
Mihai Rotaru
Textkernel B.V.
Amsterdam, The Netherlands
[email protected]
Diane J. Litman
University of Pittsburgh
Pittsburgh, USA
[email protected]
Abstract
This paper is part of our broader investi-gation into the utility of discourse struc-ture for performance analysis. In our pre-vious work, we showed that several in-teraction parameters that use discourse structure predict our performance metric. Here, we take a step forward and show that these correlations are not only a sur-face relationship. We show that redesign-ing the system in light of an interpreta-tion of a correlainterpreta-tion has a positive impact.
1
Introduction
The success of a spoken dialogue system (SDS) depends on a large number of factors and the strategies employed to address them. Some of these factors are intuitive. For example, problems with automated speech recognition can derail a dialogue from the normal course: e.g. non-understandings, misnon-understandings, end-pointing, etc. (e.g. (Bohus, 2007; Raux and Es-kenazi, 2008)). The strategies used to handle or avoid these situations are also important and re-searchers have experimented with many such strategies as there is no clear winner in all con-texts (e.g. (Bohus, 2007; Singh et al., 2002)). However, other factors can only be inferred through empirical analyses.
A principled approach to identifying important factors and strategies to handle them comes from
performance analysis. This approach was pio-neered by the PARADISE framework (Walker et al., 2000). In PARADISE, the SDS behavior is quantified in the form of interaction parameters: e.g. speech recognition performance, number of turns, number of help requests, etc. (Möller, 2005).These parameters are then used in a
multi-variate linear regression to predict a SDS per-formance metric (e.g. task completion, user satis-faction: (Singh et al., 2002)). Finally, SDS redes-ign efforts are informed by the parameters that make it in the regression model.
Conceptually, this equates to investigating two properties of interaction parameters: predictive-ness and informativeness1. Predictiveness looks at the connection between the parameter and sys-tem performance via predictive models (e.g. mul-tivariate linear regression in PARADISE). Once the predictiveness is established, it is important to look at the parameter informativeness. Infor-mally, informativeness looks at how much the parameter can help us improve the system. We already know that the parameter is predictive of performance. But this does not tell us if there is a causal link between the two. In fact, the main drive is not to prove a causal link but to show that the interaction parameter will inform a modi-fication of the system and that this modimodi-fication will improve the system.
This paper is part of our broader investigation into the utility of discourse structure for per-formance analysis. Although each dialogue has an inherent structure called the discourse struc-ture (Grosz and Sidner, 1986), this information has received little attention in performance analysis settings. In our previous work (Rotaru and Litman, 2006), we established the predic-tiveness of several interaction parameters derived from discourse structure. Here we take a step further and demonstrate the informativeness of these parameters.
We show that one of the predictive discourse structure-based parameters (PopUp-Incorrect) informs a promising modification of our system.
1Although this terminology is not yet established in the
We implement this modification and we compare it with the original version of the system through a user study. Our analyses indicate that the modi-fication leads to objective improvements for our system (e.g. performance improvements for cer-tain users but not at the population level and fewer system turns).
2
Background
ITSPOKE (Intelligent Tutoring Spoken Dia-logue System) (Litman et al., 2006) is a speech-enabled version of the text-based Why2-Atlas conceptual physics tutoring system (VanLehn et al., 2007). The interaction between ITSPOKE and users is mediated through a graphical web interface supplemented with a headphone-microphone unit. ITSPOKE first analyzes a user typed essay response to a physics problem for mistakes and omissions. Then it engages in a spoken dialogue to remediate the identified prob-lems. Finally, users revise their essay and ITSPOKE either does another round of tutor-ing/essay revision if needed or moves on to the next problem.
While for most information access SDS per-formance is measured using task completion or user satisfaction, for the tutoring SDS the pri-mary performance metric is learning. To measure learning, users take a knowledge test before and after interacting with ITSPOKE. The Normalized Learning Gain (NLG) is defined as (posttest-pretest)/(1-pretest) and measures the percentage improvement relative to the perfect improve-ment: an NLG of 0.0 means no improvement while an NLG of 1.0 means maximum improve-ment.
2.1 Discourse structure
We use the Grosz & Sidner theory of discourse (Grosz and Sidner, 1986). According to this the-ory, dialogue utterances naturally aggregate into discourse segments, with each segment having an associated purpose or intention. These segments are hierarchically organized forming the dis-course structure hierarchy. This hierarchical as-pect of dialogue has inspired several generic dia-logue management frameworks (e.g. RavenClaw (Bohus, 2007)). We briefly describe our auto-matic annotation of this hierarchy and its use through discourse transitions. A sample example is shown in Appendix 1. For more details see (Rotaru and Litman, 2006).
Since dialogues with ITSPOKE follow a “tu-tor question - user answer - tu“tu-tor response”
for-mat, which is hand-authored beforehand in a hi-erarchical structure, we can easily approximate the discourse structure hierarchy. After the essay analysis, ITSPOKE selects a group of questions which are asked one by one. These questions form the top-level discourse segment (e.g. DS1 in Appendix 1). For incorrect answers to more complex questions (e.g. applying physics laws), ITSPOKE will engage in a remediation subdia-logue that attempts to remediate the student’s lack of knowledge or skills. These subdialogues form the embedded discourse segments (e.g. DS2 in Appendix 2).
We define six discourse transitions in the dis-course structure hierarchy and use them to label each system turn. A NewTopLevel label is used for the first question after an essay submission. If the previous question is at the same level with the current question we label the current question as Advance. The first question in a remediation subdialogue is labeled as Push. After a remedia-tion subdialogue is completed, ITSPOKE will pop up and a heuristic determines whether to ask again the question that triggered the remediation dialogue. Reasking is labeled as a PopUp, while moving on to the next question is labeled as
PopUpAdv. Rejections due to speech problems or timeouts are labeled as SameGoal.
Our transitions partially encode the hierarchi-cal information of discourse structure: they cap-ture the position of each system turn in this hier-archy relative to the previous system turn.
2.2 Discourse structure-based interaction parameters
To derive interaction parameters, we look at
transition–phenomena and transition–transition
the discourse structure we look at consecutive transitions: e.g. Push-Push.
For each bigram we compute 3 interaction pa-rameters: a total (e.g. the number of PopUp-Incorrect events), a percentage (e.g. the number of PopUp-Incorrect relative to the number of turns) and a relative percentage (e.g. the percent-age of times a PopUp is followed by an incorrect answer).
3
Predictiveness
In (Rotaru and Litman, 2006), we demonstrate the predictiveness of several discourse structure-based parameters. Here we summarize the results for parameters derived from the PopUp–Correct and PopUp–Incorrect bigrams (Table 1). These bigrams caught our attention as their predictive-ness has intuitive interpretations and generalizes to other corpora. Predictiveness was measured by looking at correlations (i.e. univariate linear re-gression) between our interaction parameters and learning2. We used a corpus of 95 dialogues from
20 users (2334 user turns). For brevity, we report in Table 1 only the bigram, the best Pearson’s Correlation Coefficient (R) associated with pa-rameters derived from that bigram and the statis-tical significance of this coefficient (p).
R p
PopUp-Correct 0.45 0.05
PopUp-Incorrect -0.46 0.05
Bigram
Table 1. Several discourse structure-based parameters significantly correlated with learning (for complete results see (Rotaru and Litman, 2006))
The two bigrams shed light into user’s learn-ing patterns. In both cases, the student has just finished a remediation subdialogue and the sys-tem is popping up by reasking the original ques-tion again (a PopUp transiques-tion). We find that cor-rect answers after a PopUp are positively corre-lated with learning. In contrast, incorrect answers after a PopUp are negatively correlated with learning. We hypothesize that these correlations indicate whether the user took advantage of the additional learning opportunities offered by the remediation subdialogue. By answering correctly the original system question (PopUp–Correct), the user demonstrates that he/she has absorbed the information from the remediation dialogue. This bigram is an indication of a successful learning event. In contrast, answering the
2As it is commonly done in the tutoring research (e.g.
(Lit-man et al., 2006)), we use partial Pearson’s correlations between our parameters and the posttest score that account for the pretest score.
nal system question incorrectly (PopUp– Incorrect) is an indication of a missed learning opportunity; the more such events happen the less the user learns.
In (Rotaru and Litman, 2006) we also demon-strate that discourse structure is an important source for producing predictive parameters. In-deed, we found that simple correctness parame-ters (e.g. number of incorrect answers) are sur-prisingly not predictive in our domain. In con-trast, parameters that look at correctness at spe-cific places in the discourse structure hierarchy are predictive (e.g. PopUp–Incorrect).
4
Informativeness
We investigate the informativeness of the PopUp–Incorrect bigram as in (Rotaru, 2008) we also show that its predictiveness generalizes to two other corpora. We need 3 things for this: an interpretation of the predictiveness (i.e. an inter-pretation of the correlation), a new system strat-egy derived from this interpretation and a valida-tion of the strategy.
As mentioned in Section 3, our interpretation of the correlation between PopUp–Incorrect events and learning is that these events signal failed learning opportunities. The remediation subdialogue is the failed learning opportunity: the system had a chance to correct user’s lack of knowledge and failed to achieve that. The more such events we see, the lesser the system per-formance.
How can we change the system in light of this interpretation? We propose to give additional explanations after a PopUp–Incorrect event as the new strategy. To arrive at this strategy, we hypothesized why the failed opportunity has oc-curred. The simplest answer is that the user has failed to absorb the information from the reme-diation dialogue. It is possible that the user did not understand the remediation dialogue and/or failed to make the connection between the reme-diation dialogue and the original question. The current ITSPOKE strategy after a PopUp– Incorrect is to give away the correct answer and move on. The negative correlations indicate that this strategy is not working. Thus, maybe it would be better if the system will engage in addi-tional explanations to correct the user. If we can make the user understand, then we transform the failed learning opportunity into a successful learning opportunity. This will be equivalent to a PopUp–Correct event which we have seen is
While other interpretation and hypotheses might also be true, our results (Section 5) show that the new strategy is successful. This validates the interpretation, the strategy and consequently the informativeness of the parameter.
4.1 Modification
To modify the system, we had to implement the new PopUp–Incorrect strategy: provide addi-tional explanations rather than simply giving away the correct answer and moving on. But how to deliver the additional explanations? One way is to engage in an additional subdialogue. How-ever, this was complicated by the fact that we did not know exactly what information to convey and/or what questions to ask. It was crucial that the information and/or the questions were on tar-get due to the extra burden of the new subdia-logue.
Instead, we opted for a different implementa-tion of the strategy: interrupt the conversaimplementa-tion at PopUp–Incorrect events and offer the additional explanations in form of a webpage that the user will read (recall that ITSPOKE uses in addition a graphical web interface – Section 2). Each poten-tial PopUp–Incorrect event had an associated webpage that is displayed whenever the event occurs. Because the information was presented visually, users can choose which part to read, which meant that we did not have to be on target with our explanations. To return to the spoken dialogue, users pressed a button when done read-ing the webpage.
All webpages included several pieces of in-formation we judged to be helpful. We included the tutor question, the correct answer and a text summary of the instruction so far and of the remediation subdialogue. We also presented a graphical representation of the discourse struc-ture, called the Navigation Map. Our previous work (Rotaru and Litman, 2007) shows that users prefer this feature over not having it on many subjective dimensions related to understanding. Additional information not discussed by the sys-tem was also included if applicable: intuitions and examples from real life, the purpose of the question with respect to the current problem and previous problems and/or possible pitfalls. See Appendix 2 for a sample webpage.
The information we included in the PopUp– Incorrect webpages has a “reflective” nature. For example, we summarize and discuss the relevant instruction. We also comment on the connection between the current problem and previous
prob-lems. The value of “reflective” information has been established previously e.g. (Katz et al., 2003).
All webpages and their content were created by one of the authors. All potential places for PopUp–Incorrect events (i.e. system questions) were identified and a webpage was authored for each question. There were 24 such places out of a total of 96 questions the system may ask during the dialogue.
5
Results
There are several ways to demonstrate the suc-cess of the new strategy. First, we can investigate if the correlation between PopUp–Incorrect and learning is broken by the new strategy. Our re-sults (5.2) show that this is true. Second, we can show that the new system outperforms the old system. However, this might not be the best way as the new PopUp–Incorrect strategy directly affects only people with PopUp–Incorrect events. In addition, its effect might depend on how many times it was activated. Indeed, we find no sig-nificant effect of the new strategy in terms of performance at the population level. However, we find that the new strategy does produce a per-formance improvement for users that “needed” it the most: users with more PopUp–Incorrect events (5.3).
We begin by describing the user study and then we proceed with our quantitative evalua-tions.
5.1 User study
To test the effect of the new PopUp–Incorrect strategy, we designed and performed a between-subjects study with 2 conditions. In the control condition (R) we used the regular version of ITSPOKE with the old PopUp–Incorrect strategy (i.e. give the current answer and move on). In the experimental condition (PI), we had the regular version of ITSPOKE with the new PopUp– Incorrect strategy (i.e. give additional informa-tion).
The resulting corpus has 22 R users and 25 PI users and it is balanced for gender. There are 235 dialogues and 3909 user turns. The experiment took 2½ hours per user on average.
5.2 Breaking the correlation
effective-ness of the new PopUp–Incorrect strategy is to show that it breaks down this correlation. In other words, PopUp–Incorrect events no longer signal lower performance. Simple correlation does not guarantee that this is true because corre-lation does not necessarily imply causality.
In our experiment, this translates to showing that that PopUp–Incorrect bigram parameters are still correlated with learning for R students but the correlations are weaker for PI students. Table 2 shows these correlations. As in Table 1, we show only the bigrams for brevity.
R p R p
PopUp-Correct 0.60 0.01 0.18 0.40 PopUp-Incorrect -0.65 0.01 -0.18 0.40 Bigram
R users PI users
Table 2. Correlation with learning in each condition
We find that the connection between user be-havior after a PopUp transition and learning con-tinues to be strong for R users. PopUp–Incorrect events continue to signal lower performance (i.e. a strong significant negative correlation of -0.65). PopUp–Correct events signal increased performance (i.e. a strong significant positive correlation of +0.60). The fact that these correla-tions generalize across experiments/corpora fur-ther strengthens the predictiveness of the PopUp–Incorrect parameters.
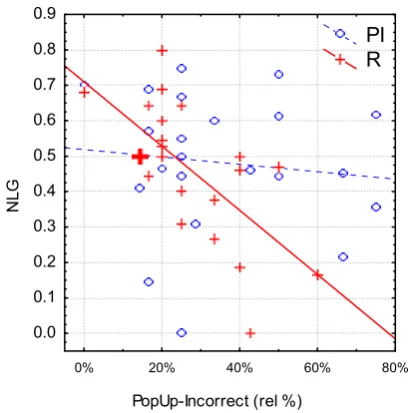
Figure 1. Correlations between a PopUp-Incorrect parameter and NLG
In contrast, for PI users these correlations are much weaker with non-significant correlation coefficients of -0.18 and 0.18 respectively. In other words the new PopUp–Incorrect strategy breaks down the observed correlation: PopUp– Incorrect events are no longer a good indicator of lower performance.
It is interesting to visualize these correlations graphically. Figure 1 shows a scatter plot of the PopUp–Incorrect relative percentage parameter and NLG for each PI and R user. The regression lines for the correlation between PopUp– Incorrect and NLG for PI and R are shown. The graph shows that users with less PopUp– Incorrect events (e.g. less than 30% relative) tend to have a higher NLG (0.5 or higher) regardless of the condition. However, for users with more PopUp–Incorrect events, the behavior depends on the condition: R users (crosses) tend to have lower NLG (0.5 or lower) while PI users (cir-cles) tend to cover the whole NLG spectrum (0.2 to 0.73). Our next analysis will provide objective support for this observation.
5.3 Performance improvements
The simplest way to investigate the effect of the new PopUp–Incorrect strategy is to compare the two systems in terms of performance (i.e. learn-ing). Table 3 shows in the second column the learning (NLG) in each condition. We find that the new strategy provides a small 0.02 perform-ance improvement (0.48 vs. 0.46), but this effect is far from being significant. A one-way ANOVA test finds no significant effect of the condition on the NLG (F(1,45)=0.12, p<0.73).
All Low High
PI 0.48 (0.19) 0.49 (0.21) 0.48 (0.17)
R 0.46 (0.19) 0.56 (0.13) 0.30 (0.18)
PI Split
Table 3. System performance (NLG) in each condi-tion
(averages and standard deviation in parentheses)
There are several factors that contribute to this lack of significance. First, the new PopUp– Incorrect strategy is only activated by users that have PopUp–Incorrect events. Including users without such events in our comparison could weaken the effect of the new strategy. Second, the impact of the new strategy might depend on how many times it was activated. This relates back to our hypothesis that that a PopUp– Incorrect is an instance of a failed learning op-portunity. If this is true and our new PopUp– Incorrect strategy is effective, then we should see a stronger impact on PI users with a higher number of PopUp–Incorrect events compared with the similar R users.
mean split based on the PopUp–Incorrect relative percentage parameter (see the X axis in Figure 1): users with a parameter value less than 30% go into the Low subset (15 PI and 14 R users) while the rest go into the High subset (10 PI and 8 R users).
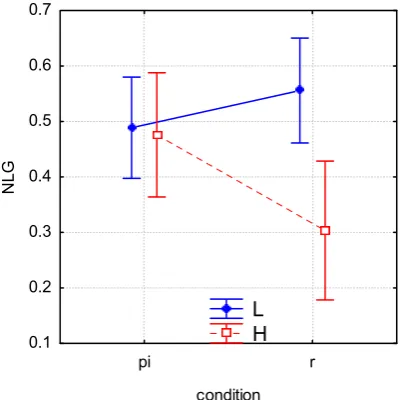
Results are shown in the third and the fourth columns in Table 3. To test the significance of the effect, we run a two-way factorial ANOVA with NLG as the dependent variable and two fac-tors: PISplit (Low vs. High) and Condition (PI vs. R). We find a significant effect of the combi-nation PISplit × Condition (F(1,43)=5.13, p<0.03). This effect and the results of the post-hoc tests are visualized in Figure 2. We find that PI users have a similar NLG regardless of their PopUp–Incorrect behavior while for R, High PI-Split users learn less than Low PIPI-Split users. Posthoc tests indicate that High PISplit R users learn significantly less than Low PISplit R users (p<0.01) and both categories of PI users (p<0.05). In other words, there is an inherent and significant performance gap between R users in the two subsets. The effect of the new PopUp– Incorrect strategy is to bridge this gap and bring High PISplit users to the performance level of the Low PISplit users. This confirms that the new PopUp–Incorrect strategy is effective where it is most needed (i.e. High PISplit users).
pi r
condition 0.1
0.2 0.3 0.4 0.5 0.6 0.7
NL
G
L H
Figure 2. PISplit × Condition effect on NLG (bars represent 95% confidence intervals)
It is interesting to note that Low PISplit R us-ers learn better than both categories of PI users although the differences are not significant. We hypothesize this happens because not all learning issues are signaled by PopUp–Incorrect events: a user might still have low learning even if he/she
does not exhibit any PopUp–Incorrect events. Indeed, there are two PI users with a single PopUp–Incorrect event but with very low learn-ing (NLG of 0.00 and 0.14 respectively). It is very likely that other things went wrong for these users rather than the activation of the new PopUp–Incorrect strategy (e.g. they might have other misconceptions that are not addressed by the remediation subdialogues). In fact, removing these two users results in identical NLG averages for the two low PISplit subsets.
5.4 Dialogue duration
We also wanted to know if the new PopUp– Incorrect strategy has an effect on measures of dialogue duration. The strategy delivers addi-tional explanations which can result in an in-crease in the time users spend with the system (due to reading of the new instruction). Also, when designing tutoring systems researchers strive for learning efficiency: deliver increased learning as fast as possible.
Total time (min)
No. of sys. turns
PI 44.2 (6.2) 86.4 (6.8) R 45.5 (5.7) 90.9 (9.3)
Table 4. Dialogue duration metrics (averages and standard deviation in parentheses)
We look at two shallow dialogue metrics: dia-logue time and number of turns. Table 4 shows that, in fact, the dialogue duration is shorter for PI users on both metrics. A one way ANOVA finds a non-significant effect on dialogue time (F(1,45)=0.57, p<0.45) but a trend effect for number of system turns (F(1,45)=3.72, p<0.06). We hypothesize that 2 factors are at play here. First, the additional information activated by the new PopUp–Incorrect strategy might have a positive effect on users’ correctness for future system questions especially on questions that discuss similar topics. As a result, the system has to correct the user less and, consequently, finish faster. Second, the average total time PI users spend reading the additional information is very small (about 2 minutes) compared to the average dialogue time.
6
Related work
metrics are used to compare multiple (versions of) SDS. But what do these metrics and the re-sulting comparisons tell us about designing SDS? There are several approaches to answering this question, each requiring a different level of su-pervision.
One approach that requires little human super-vision is to use reinforcement learning. In this approach, the dialogue is modeled as a (partially observable) Markov Decision Process (Levin et al., 2000; Young et al., 2007). A reward is given at the end of the dialogue (i.e. the evaluation metric) and the reinforcement learning process propagates back the reward to learn what the best strategy to employ at each step is. Other semi-automatic approaches include machine learning and decision theoretic approaches (Levin and Pieraccini, 2006; Paek and Horvitz, 2004). How-ever, these semi-automatic approaches are feasi-ble only in small and limited domains though recent work has shown how more complex do-mains can be modeled (Young et al., 2007).
An approach that works on more complex domains but requires more human effort is through performance analysis: finding and tack-ling factors that affect the performance (e.g. PARADISE (Walker et al., 2000)). Central to this approach is the quality of the interaction pa-rameters in terms of predicting the performance metric (predictiveness) and informing useful modifications of the system (informativeness). An extensive set of parameters can be found in (Möller, 2005).
Our use of discourse structure for performance analysis extends over previous work in two im-portant aspects. First, we exploit in more detail the hierarchical information in the discourse structure through the domain-independent con-cept of discourse structure transitions. Most pre-vious work does not use this information (e.g. (Möller, 2005)) or, if used, it is flattened (Walker et al., 2001). Also, to our knowledge, previous work has not employed parameters similar to our transition–phenomena (transition–correctness in this paper) and transition–transition bigram pa-rameters. In addition, several of these parameters are predictive (Rotaru and Litman, 2006).
Second, in our work we also look at the in-formativeness while most of the previous work stops at the predictiveness step. A notable excep-tion is the work by (Litman and Pan, 2002). The factor they look at is user’s having multiple speech recognition problems in the dialogue. This factor is well known in the SDS field and it has been shown to be predictive of system
per-formance by previous work (e.g. (Walker et al., 2000)). To test the informativeness of this factor, Litman and Pan propose a modification of the system in which the initiative and confirmation strategies are changed to more conservative set-tings whenever the event is detected. Their re-sults show that the modified version leads to im-provements in terms of system performance (task completion). We extend over their work by look-ing at a factor (PopUp–Incorrect) that was not known to be predictive of performance before-hand. We discover this factor through our em-pirical analyses of existing dialogues and we show that by addressing it (the new PopUp– Incorrect strategy) we also obtain performance improvements (at least for certain users). In addi-tion, we are looking at a performance metric for which significant improvements are harder to obtain with small system changes (e.g. (Graesser et al., 2003)).
7
Conclusions
In this paper we finalize our investigation into the utility of discourse structure for SDS per-formance analysis (at least for our system). We use the discourse structure transition information in combination with other dialogue phenomena to derive a number of interaction parameters (i.e. transition–phenomena and transition–transition). Our previous work (Rotaru and Litman, 2006) has shown that these parameters are predictive of system performance. Here we take a step further and show that one of these parameters (the PopUp–Incorrect bigram) is also informative. From the interpretation of its predictiveness, we inform a promising modification of our system: offer additional explanations after PopUp– Incorrect events. We implement this modifica-tion and we compare it with the original system through a user study. We find that the modifica-tion breaks down the negative correlamodifica-tion be-tween PopUp–Incorrect and system performance. In addition, users that need the modification the most (i.e. users with more PopUp–Incorrect events) show significant improvement in per-formance in the modified system over corre-sponding users in the original system. However, this improvement is not strong enough to gener-ate significant differences at the population level. Even though the additional explanations add ex-tra time to the dialogue, overall we actually see a small reduction in dialogue duration.
for performance analysis. In fact, our other work (Rotaru and Litman, 2007) shows that discourse structure is also useful for other SDS tasks. Sec-ond, to our knowledge, we are the first to show a complete application of the performance analysis methodology. We discover a new set of predic-tive interaction parameters in our system and we show how our system can be improved in light of these findings. Consequently, we validate per-formance analysis as an iterative, “debugging” approach to dialogue design. By analyzing cor-pora collected with an initial version of the sys-tem, we can identify semi-automatically prob-lems in the dialogue design. These probprob-lems in-form a new version of the system which will be tested for performance improvements. In terms of design methodology for tutoring SDS, our re-sults suggest the following design principle: “do not give up but try other approaches”. In our case, we do not give up after a PopUp-Incorrect but give additional explanations.
In the future, we would like to extend our work to other systems and domains. This should be relatively straightforward as the main ingredi-ents, the discourse transitions, are domain inde-pendent.
Acknowledgments
This work is supported by the NSF grants 0328431 and 0428472. We would like to thank the ITSPOKE group.
References
D. Bohus. 2007. Error Awareness and Recovery in Conversational Spoken Language Interfaces. Ph.D. Dissertation, Carnegie Mellon University, School of Computer Science
A. Graesser, K. Moreno, J. Marineau, A. Adcock, A. Olney and N. Person. 2003. AutoTutor improves deep learning of computer literacy: Is it the dialog or the talking head? In Proc. of Artificial Intelli-gence in Education (AIED).
B. Grosz and C. L. Sidner. 1986. Attentions, inten-tions and the structure of discourse. Computational Linguistics, 12(3).
S. Katz, D. Allbritton and J. Connelly. 2003. Going Beyond the Problem Given: How Human Tutors Use Post-Solution Discussions to Support Transfer.
International Journal of Artificial Intelligence in Education (IJAIED), 13.
E. Levin and R. Pieraccini. 2006. Value-based opti-mal decision for dialogue systems. In Proc. of IEEE/ACL Workshop on Spoken Language Tech-nology (SLT).
E. Levin, R. Pieraccini and W. Eckert. 2000. A Sto-chastic Model of Human Machine Interaction for Learning Dialog Strategies. IEEE Transactions on Speech and Audio Processing, 8:1.
D. Litman and S. Pan. 2002. Designing and Evaluat-ing an Adaptive Spoken Dialogue System. User Modeling and User-Adapted Interaction, 12(2/3). D. Litman, C. Rose, K. Forbes-Riley, K. VanLehn, D.
Bhembe and S. Silliman. 2006. Spoken Versus Typed Human and Computer Dialogue Tutoring.
International Journal of Artificial Intelligence in Education, 16.
S. Möller. 2005. Parameters for Quantifying the In-teraction with Spoken Dialogue Telephone Services.
In Proc. of SIGDial.
S. Möller and N. Ward. 2008. A Framework for Model-based Evaluation of Spoken Dialog Systems.
In Proc. of Workshop on Discourse and Dialogue (SIGDial).
T. Paek and E. Horvitz. 2004. Optimizing Automated Call Routing by Integrating Spoken Dialog Models with Queuing Models. In Proc. of HLT-NAACL. A. Raux and M. Eskenazi. 2008. Optimizing
End-pointing Thresholds using Dialogue Features in a Spoken Dialogue System. In Proc. of 9th SIGdial Workshop on Discourse and Dialogue.
M. Rotaru. 2008. Applications of Discourse Structure for Spoken Dialogue Systems. Ph.D. Dissertation, University of Pittsburgh, Department of Computer Science
M. Rotaru and D. Litman. 2006. Exploiting Discourse Structure for Spoken Dialogue Performance Analy-sis. In Proc. of EMNLP.
M. Rotaru and D. Litman. 2007. The Utility of a Graphical Representation of Discourse Structure in Spoken Dialogue Systems. In Proc. of ACL. S. Singh, D. Litman, M. Kearns and M. Walker. 2002.
Optimizing Dialogue Management with Rein-forcement Learning: Experiments with the NJFun System. Journal of Artificial Intelligence Research,
(16).
K. VanLehn, A. C. Graesser, G. T. Jackson, P. Jordan, A. Olney and C. P. Rose. 2007. When are tutorial dialogues more effective than reading? Cognitive Science, 31(1).
M. Walker, D. Litman, C. Kamm and A. Abella. 2000. Towards Developing General Models of Usability with PARADISE. Natural Language Engineering. M. Walker, R. Passonneau and J. Boland. 2001.
Quantitative and Qualitative Evaluation of Darpa Communicator Spoken Dialogue Systems. In Proc. of ACL.
DS 1
TUTOR1: Consider Newton's laws applied to two
objects that move together. What three quantities does Newton's Second Law describe the relationship between?
Student answer1: correct(e.g. force, mass, accel.) TUTOR2: If two bodies are connected so that they move
together and you know the acceleration of the first body, what is the acceleration of the second body?
Student answer2: incorrect(e.g. zero)
TUTOR5: If a force acts on one body such
that it moves, what happens to the second body?
Student answer5: incorrect but rejected (e.g. stays) TUTOR6: Could you please repeat that?
…
DS 2
TUTOR3: If the two bodies always move
together and one body speeds up, what happens to the other?
Student answer3: incorrect(e.g. lags behind) TUTOR4: The second body will speed up too. If
the first body accelerates at a particular rate, will the second body accelerate at an equal or different rate?
Student answer4: correct(e.g. equal)
ESSAY SUBMISSION & ANALYSIS
Appendix 1. Automatic annotation of discourse structure hierarchy and of discourse structure transitions
Discourse structure hierarchy annotation: DS1 is the top level discourse segment. Its purpose is to correct misconceptions in user’s essay and/or to elicit more complete explanations for the essay. DS2 is an embedded discourse segment which corresponds to the remediation subdia-logue for question Tutor2.
Discourse structure transition annotation: Each transition labels the system turn at the tip of the arrow (e.g. Tutor2 is labeled with Advance). Please note that Tutor2 will not be labeled with
Appendix 2. Sample additional instructions webpage
Problem discussed by ITSPOKE: Suppose a man is running in a straight line at constant speed. He throws a pumpkin straight up. Where will it land? Explain.