Volume 9, No. 1, January-February 2018
International Journal of Advanced Research in Computer Science
RESEARCH PAPER
Available Online at www.ijarcs.info
ISSN No. 0976-5697
TWO-PHASE STACKING ENSEMBLE TO EFFECTIVELY HANDLE DATA
IMBALANCES IN CLASSIFICATION PROBLEMS
K.Madasamy
Research Scholar (Part-Time) Department of Computer Applications
Madurai Kamaraj University Madurai-625 021, India.
M.Ramaswami
Associate Professor
Department of Computer Applications Madurai Kamaraj University
Madurai-625 021, India.
Abstract: Increase in generation of real-time data resulted in need of more processing requirements. However, processing of such data has
several challenges associated with it. One of the major challenges in processing real-time data is to handle the implicit data imbalance. This paper proposes a two-phase stacking ensemble method to handle data imbalances more effectively during classification process. The proposed model utilizes multiple classifier algorithms in the first phase to predict data. The predicted data is used as input for the second phase. The second phase is a meta-learner, operating on predictions rather than the actual data. Experiments were conducted on data with varied imbalance levels. Obtained results indicate high efficiency of the proposed model in predicting with imbalanced data. A comparison with state-of-the-art model indicates improved performance.
Keywords: Classification, Data Imbalance, Ensemble Modelling, Meta learning, Stacking
I. INTRODUCTION
Classification is a categorization of data mining domain, which deals with supervised identification of class labels, given a large training dataset. Classifiers learn patterns contained in the given training data to predict unseen data. Classification has several applications in the real-time systems beginning from image, sound and video classification, anomaly detection etc. However, performance of classifiers is usually hindered by several intrinsic properties of data and data distributions. One such major issue contained in several real-time data is data imbalance [1]. Data is considered to be imbalanced if one of its classes exhibits dominance over the other existing classes. i.e., instances of one class are huge in number, while instances in other classes are very less in number. The class which shows high dominance is referred to as the majority class, while the classes with low dominance are designated to as the minority class. This problem has been observed to be very prominent in binary classification problems. However, even in multiclass datasets, this issue was observed to claim high impact in the classification process [2]. Scientific datasets are preprocessed and are balanced, hence this issue cannot be explicitly observed in such datasets. However, in real-time datasets, this is a very prominent issue. Intrusion detection, bank fraud detection, detection of cancer, etc., are some of the domains where normal or legitimate data are huge in number, while the interesting instances represent minority classes, with low number of entries. The ratio between the number of instances in majority class and number of instances in minority classes is called the imbalance ratio. A class is considered to be balanced if it’s imbalance ratio is 1 and when increasing the imbalance ratio leads to increase in the ratio [3].
Issues due to data imbalances are varied. Major issue is that data imbalances tend to bias the prediction process of a classifier, hence making the classifier more reliant towards
predicting the majority classes. Due to the huge number of instances contained in the majority classes, the classifier is overly trained on the majority classes and due to the low instance levels in minority classes, the classifier receives low training in terms of the minority classes. This biased training leads to poor predictions. Although the impact revealed by imbalances in data varies between classifiers, their presence cannot be overlooked [4]. This paper presents an effective two-phase stacking model to effectively handle data imbalances contained in data. The model is applicable and highly effective, irrespective of the imbalance levels, data distributions and the type of data (binary or multiclass).
The rest of the paper is organized as follows. Section II reviews related literatures that describe the current level of research in this flourishing domain. Section III describes our proposed method with a lucid framework. In section IV, we have presented our experiment along with results. Sufficient tables with charts have been provided. The AUC values of our proposed method are being compared with the recent RHSBoost technique [5]. Finally section V concludes the paper.
II. LITERATURE REVIEW
process. Several methods are aimed towards handling imbalances by introducing sampling techniques. Such models include SMOTE by Chawla et al. in [7] and an under-sampling model by Liu et al. in [8]. The best sampling model to be used on imbalanced datasets is itself a research problem with many contributions towards this analysis [9]. An overlap sensitive classifier using support vector machines and k-nearest neighbor algorithms was proposed by Lee et al. in [10]. A dissimilarity based classifier to handle imbalance data was proposed by Zhang et al. in [11]. This is a feature elimination based model that eliminates unnecessary features to enhance the prediction process. This is followed by prototype extraction and then model training to provide better predictions on imbalanced data.
Another mode of dealing with the class imbalance problem is to apply cost sensitive learning. Some recent contributions to this domain include a cost sensitive SVM by Cao et al. in [12], an imbalance handling model by Wang et al. in [13] and a rule based learning model by Napierala et al. in [14]. The impact of varied imbalance levels on datasets and processing them with different categories of classifiers in the preview of big data have been presented by the authors in [24]. The diverse challenges and future direction behind the imbalanced big data classification was studied by Alberto Fernandez et al. [25]. Further the authors discussed the different approaches for performing classification task on imbalanced big data. Ryan Hoens.T et al. [26] have suggested many sampling techniques, application of skew-intensive classifiers, Hybrid techniques and ensemble techniques for dealing with imbalanced datasets. Further, the authors have recommended AUROC and AUPR as an alternative metrics for measuring the performance accuracy of the classifiers. Nura Muhammad Baba et al. [27] have done an extensive review study on current issues in ensemble methods and its applications covering various domains. The author emphasizes the incorporation of optimization algorithms like ACO, GA and PSO along with the ensemble methods would optimize the classification models. Zhongbin Sun et al. [28] have proposed a novel study on ensemble method for classifying 46 highly imbalanced data sets. The authors elaborate that the proposed method does not alter the original class distribution ratio and does not suffer from information loss or unexpected mistakes that may be caused by other conventional methods via increasing the minority class instances or decreasing the majority ones. Further, the authors investigated that the current proposed method out performed well against their previous methods like EMIVSI and other two fuzzy – rule based classification methods namely chi3 – GTS and chi5 – GTS.
Uma et al. [29] presented a study on classifier ensemble design for imbalance data classification through a hybrid approach. The authors have mixed up both data level approach and also by incorporating classifier ensemble techniques to achieve better prediction performance. Area Under ROC Curve(AUC) has been suggested for measuring the performance accuracy. A Comparative analysis of predictive performance of various classifiers for multiclass problem was proposed in [30]. The author suggested that ROC curves are best tool for visualizing various classifiers behaviour.
III. OUR APPROACH
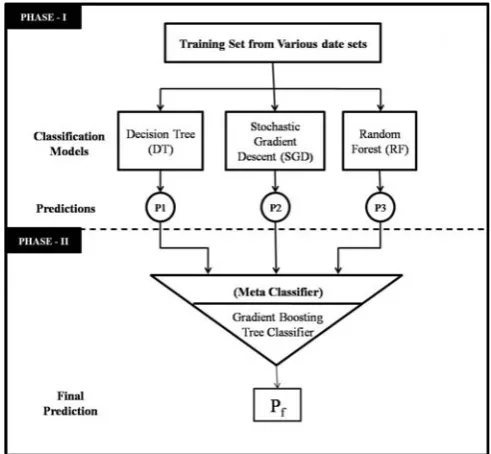
[image:2.595.314.560.183.410.2]Imbalance is one of the major issues affecting the performance of classifiers. However, its effects on every classifier differs. Hence the proposed model incorporates multiple classifiers such that the biases in one model will be compromised by its other counterparts. The proposed two-phase stacking model consists of five major modules namely data preprocessing, data segregation, phase-1 model training, phase-2 model training and prediction. The framework for the proposed model is shown in figure1.
Figure 1. The proposed framework
A. Data Preprocessing
Data is usually laden with issues like missing data and noise. Noisy attributes are identified and imputations are applied on both missing data and noisy instances to obtain data in formats that can be processed by the classifier models. The proposed stacking model handles only numerical data. However, datasets are comprised with varied types of data. Hence normalization is applied to the data to convert all properties to numerical entities. Further, since multi-level data training is to be performed, the class labels are also converted to numerical. This ensures that data provided to the first phase of the model training satisfies the requirements of the classifiers.
B. Data Segregation
The available data is segregated into two components, training and testing data. Data used for training cannot be used for testing, as it will provide biased results. Testing data should be new and unseen data in-order to obtain accurate results. The training and testing data are segregated in the ratio 3:1, such that 75% of the available data are used for training, while 25% of the remaining data is used for testing the performance of the classifier.
C. Phase-1 Model Training
Tree [15, 16] is a tree based classifier that models graphs based on decisions and their possible sequences. Divisions in tree nodes are performed based on entropy. Each branch in a decision tree moves towards an outcome. Each leaf node represents a class label. A path from the root node to a leaf node presents a single classification rule. Stochastic Gradient Descent (SGD) [17, 18] is an incremental learning stochastic approximation algorithm that aims to optimize an objective function. SGD is used mainly for training machine learning models.
Random Forest [19, 20] is a machine learning ensemble model constructed based on Decision Trees. Random Forest is a bagged version of Decision Trees that utilizes multiple unpruned decision trees to create a strong classifier model. Random Forest models are more robust towards data imbalance, as data provided to each decision tree is sampled from the actual data. Hence each base learner decision tree is trained with different data. The Combined predictions were observed to reveal better and enhanced performances compared to using single models.
The training data is passed to all the algorithms and the prediction set on the training data is obtained. Each instance in the training data is associated with three predictions. The three predictions, along with the final class are integrated to form the phase-1 training data. The predictions from selected classifiers are integrates as such, without any additional incorporation of analysis. Hence, irrespective of whether the prediction is right or wrong, the predictions are used as such. The first phase training data is novice, concerning predictions on the actual instances, while the second phase data is an enhanced data, exhibiting the metadata pertaining to the input data. The phase-1 data obtained from this phase forms the input for the phase-2 modelling.
D. Phase-2 Model Training
Intermediate data obtained from the phase-1 is used as the training data for phase-2. Results from phase-1 training model depicts the metadata, exhibiting the learning levels of the phase-1 classifiers. These learning patterns are used as input to the phase-2 model. Phase-1 predictions were primitive hence uses multiple algorithms. The phase-2 model utilizes Gradient Boosting Tree (GBT) Classifier [21, 22], a strong classifier to perform predictions. The GBT classifier is based on decision trees, and operates by training the algorithm iteratively, by identifying and incorporating errors at each level, in order to reduce the error levels in the predictions. Let f(x) be the prediction model. The proposed approach uses Decision Trees as the base prediction model. The process of prediction is given by
p
'
f x
( )
(1)Where p’ is the prediction given by the model f. Errors
contained in the prediction p’ can be evaluated by
'
e
p
p
(2)Where p is the actual result pertaining to the data instance
and p’ is the result predicted by the model f.
The error e is incorporated into the training phase in the
next iteration, which is given by
p
''
f x
( )
e
(3)The second level prediction p’’ is expected to showbetter
performances compared to p. However, it is not expected to
be completely robust. Incorporation of first phase errors might lead to a different set of errors. The next level error is given by
e
'
p
p
'
(4)The process of error identification and incorporation is performed iteratively to obtain a robust classifier with low error levels.
E. Prediction
The instances to be predicted are initially preprocessed and passed to the phase-1 model training. The predictions aggregated and are passed to the phase-2 model for meta prediction.
IV. EXPERIMENTS AND RESULTS
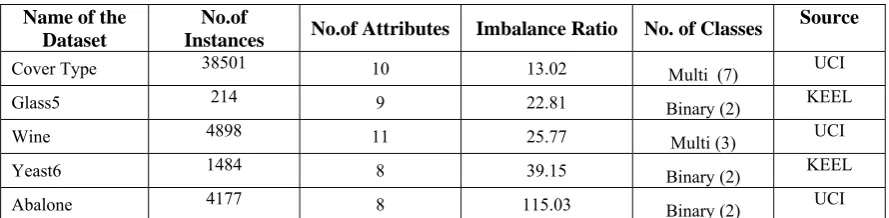
[image:3.595.76.521.646.755.2]The proposed two-phase stacking model is implemented in Anaconda 5.0.1 package distribution [23] with Python 3.6 under Jupyter NoteBook interactive computing environment. Dell desktop with Intel Corei3 processor with 4GB DDR3 RAM running under Windows 7 has been used. Table 1 shows the five different datasets with varying imbalance ratios ranging from 13 to 115 were chosen from UCI and KEEL repositories for our study [5]. Both binary and multi class datasets are chosen to analyse the efficiency of the proposed model on datasets of varied dimensions and class labels.
Table I: Dataset Descriptions
Name of the Dataset
No.of
Instances No.of Attributes Imbalance Ratio No. of Classes
Source
Cover Type 38501 10 13.02 Multi (7) UCI
Glass5 214 9 22.81 Binary (2) KEEL
Wine 4898 11 25.77 Multi (3) UCI
Yeast6 1484 8 39.15 Binary (2) KEEL
Table II: Prediction metrics derived from different datasets.
Dataset AUC Accuracy F1-Score Recall Precision
CoverType 0.96 0.920208 0.909799 0.920208 0.90768
Glass5 1.0 1.0 1.0 1.0 1.0
Wine 0.986486 0.955556 0.9558051 0.955556 0.958025
Yeast6 0.94723 0.991914 0.995839 0.99446 0.997222
Abalone 0.997093 0.994536 0.997085 0.994186 1.0
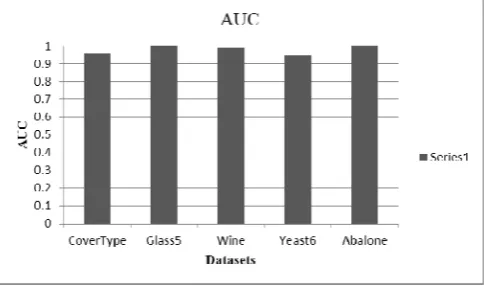
[image:4.595.38.282.481.624.2]In this present study, for both binary class and multi class classification tasks, a set of standard performance evaluation metrics like AUC (Area Under Curve), Accuracy, Precision, Recall and F1-Score were used. All these metrics were derived from their respective confusion matrix generated from the data set [24]. Table II shows the results of prediction related metrics obtained for each dataset during the experimental run. Bar charts have been drawn to visually compare the performance of each individual metric. AUC stands for Area Under the Curve. It is one among the preferred metric for measuring the prediction accuracies in most domains. Here, the curve is the Receiver Operating Characteristics (ROC measure) for evaluating classifier performance. An analysis of AUC values obtained by applying the proposed model on all the five datasets are shown in figure 2. It could be observed that all the datasets shows an AUC value greater than 0.9, irrespective of their imbalance ratios. Higher AUC values reveal better performances and evinced the efficiency of the proposed model.
Figure 2. Area Under Curve (AUC) Analysis
Subsequently, the accuracy values obtained from the proposed two phase stacked ensemble is shown in figure 3. It could be observed that the proposed model indicates accuracy levels greater than 0.92 on all the datasets. This shows the unbiased nature of the model in revealing effective performances irrespective of the imbalance levels present in the classes.
Figure 3. Accuracy Analysis
[image:4.595.314.565.539.685.2]Another predictive metric namely F1-score is a single metric that combines both precision and recall via their harmonic mean. F1-Scores derived from the proposed model is shown in figure 4. It could be observed that the proposed model, irrespective of data imbalance levels displays high F1-Score levels at greater than 0.9, revealing the high performing nature of the model.
Figure 4. F1-Score Analysis
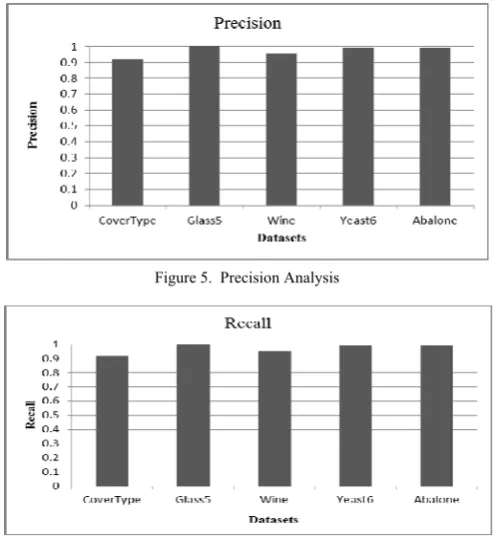
performances, depicting the effective retrieval and accurate labelling nature of the proposed model.
Figure 5. Precision Analysis
Figure 6. Recall Analysis
[image:5.595.34.283.85.354.2]The PR plot in figure 7 shows the precision and recall levels of the classifier on a single plot. A classifier is considered to be effective if it plot its precision and recall points on the upper-right corner of the chart, i.e. with high precision and high recall levels. It could be observed that all the plots are displayed on the upper- right corners, indicates the high performance nature of the proposed model.
Figure 7. PR-Plot
Finally, the AUC values obtained from the proposed model is compared with RHSBoost algorithm [5] to ascertain the efficiency of the proposed model and is shown in figure 8. It could be observed that on data with low imbalances, the difference between the models are very low, however, on increasing the imbalance , performances of RHSBoost model reduces, while the proposed model displays stable performances, hence signifying the superiority of the proposed model.
Figure 8. AUC Comparison
[image:5.595.318.558.279.432.2]A tabular comparison of the AUC values are shown in table III. Best performances are shown in bold. Average of the AUC levels obtained from the models has been calculated and it could be observed that the proposed model shows improved performances at an increased rate of 9%.
Table III : Comparison of AUC : Proposed Method Vs. RHSBoost
Data Imbalance Proposed RHSBoost
Cover Type 13.02 0.96 0.98
Glass5 22.81
1.0 0.98
Wine 25.77 0.986486 0.82
Yeast6 39.15 0.94723 0.93
Abalone 115.03
0.997093 0.72
Average Performance 0.978162 0.886
V. CONCLUSION
This paper proposes a two phase stacking ensemble technique aimed to counter data imbalances in benchmark datasets taken from UCI and KEEL repositories. The proposed model is composed of two phases. The first phase is composed of stacking of multiple classifiers like Decision Tree, Stochastic Gradient Boosting and Random Forest as the first layer components. Decision Tree is a weak learner, while SGD is a gradient training algorithm, and Random Forest is a bagged ensemble method. Integrating such varieties of classifiers provides efficiency in terms of handling data with varied imbalance levels. The predictions from first phase are passed to the second phase for training. The meta-learner contained in the second phase provides the final prediction. Experiments were shown to indicate higher prediction accuracies and comparisons also reveals reasonably better performances with the state-of-the-art models. Future extensions of the proposed model will be based on incorporating feature engineering to provide enhanced predictions.
VI. REFERENCES
[1] W. Mao, J. Wang, L .He, and Y. Tian, “Online sequential prediction of imbalance data with two-stage hybrid strategy by extreme learning machine,” Neurocomputing, Feb 8, 2017.
[image:5.595.44.271.480.635.2][3] V. López, A. Fernández, S. García, V. Palade, and F. Herrera, “An insight into classification with imbalanced data: Empirical results and current trends on using data intrinsic characteristics,” Information Sciences, Vol.250, pp.113-41, 2013.
[4] S. Akila, and U. Srinivasulu Reddy, “ Modelling a Stable Classifier for Handling Large Scale Data with Noise and Imbalance,” IEEE International Conference on Computational Intelligence in Data Science, 2017. [5] J. Gong, and H. Kim, “RHSBoost: Improving
classification performance in imbalance data,” Computational Statistics & Data Analysis,
Vol. 111, pp.1-13,2017.
[6] J. Li, S. Fong, R.K. Wong, and V.W. Chu, “Adaptive multi-objective swarm fusion for imbalanced data classification,” Information Fusion, Vol. 39, pp.1-24,
2018.
[7] N.V. Chawla, et al. “SMOTE: synthetic minority over-sampling technique, ” Res.J.Artif.Intell Vol.16, pp. 321– 357, 2002 .
[8] X.Y. Liu, J. Wu, and Z.H. Zhou, “Exploratory undersampling for class-imbalance learning IEEE Trans. Syst,” Man Cybern. Part B (Cybern.) Vol.39 (2), pp. 539–550,2009.
[9] R. Barandela, et al. “The imbalanced training sample problem: Under or over sampling? Joint IAPR International Workshops on Statistical Techniques, in Pattern Recognition,” (SPR) and Structural and Syntactic Pattern Recognition (SSPR), Springer, pp.806-14, 2004 . [10] Han Kyu Lee , Seoung Bum Kim , “An
Overlap-Sensitive Margin Classifier for Imbalanced and overlapping Data,” Expert Systems With
Applications,doi:10.1016/j.eswa.2018.01.008, 2018.
[11] X. Zhang, Q, Song, G. Wang, K. Zhang, L. He, and X. Jia, “A dissimilarity-based imbalance data
classification algorithm,” Applied
Intelligence, Vol.42(3), pp.544-565,2015.
[12] P. Cao, D. Zhao, and O. Zaiane, “ An optimized cost-sensitive SVM for imbalanced data learning,” In Lecture Notes in Computer Science including subseries Lecture Notes in Artificial Intelligence and Lecture Notes in Bioinformatics Vol. 7819 LNAI, pp. 280–292, 2013. [13] H. Wang, Y. Gao, Y. Shi, and H. Wang, “ A fast
distributed classification algorithm for large-scale imbalanced data,” In Proceedings - IEEE International Conference on Data Mining, ICDM pp. 1251– 256, 2017. [14] K. Napierała, and J. Stefanowski, “Addressing
imbalanced data with argument based rule learning,” Expert Systems with Applications, Vol.42(24), pp. 9468-9481, 2015.
[15] B. Kamiński, M. Jakubczyk, and P. Szufel, “A framework for sensitivity analysis of decision trees”, Central European Journal of Operations Research. doi:10.1007/s10100-017-0479-6,pp.1-25, 2017.
[16] J.R. Quinlan, “Simplifying decision trees,” International Journal of Man-Machine Studies, doi:10.1016/S0020-7373.80053-6,Vol.27(3), pp.221-34, 1987.
[17] L. Bottou, Léon, O. Bousquet, and Olivier, “The Tradeoffs of Large Scale Learning,” Advances in Neural Information Processing Systems, Vol.20, pp. 161–168, 2008.
[18] L. Bottou, and Léon “Online Algorithms and Stochastic Approximations,” Online Learning and Neural Networks. Cambridge University Press. ISBN 978-0-521-65263-6,Vol.17(9),pp.142, 1998.
[19] T.K. Ho, Tin Kam “Random Decision Forests (PDF),” Proceedings of the 3rd International Conference on Document Analysis and Recognition, Montreal, QC, 14– 16 August 1995. Vol.1, pp. 278–282, 1995.
[20] T.K. Ho, Tin Kam “The Random Subspace Method for Constructing Decision Forests,” (PDF). IEEE Transactions on Pattern Analysis and Machine Intelligence. doi:10.1109/ 34.709601, Vol. 20(8),pp.832- 844,1998.
[21] J.H. Friedman, “Greedy Function Approximation: A Gradient Boosting Machine,” February 1999.
[22] J.H. Friedman, “Stochastic Gradient Boosting,” March 1999.
[23] https://www.anaconda.com/
[24] K.Madasamy and M.Ramaswami,“Data Imbalance and Classifiers : Impact and Solutions from a Big Data Perspective”, International Journal of Computational Intelligence Research (IJCIR),Vol. 13, Number 9 (2017), pp.2267-2281.
[25] Alberto Fernandez, Sara del Rio, Nitesh V.Chawla, Francisco Herrera, “ An Insight into imbalanced Big data classification : Outcomes and challenges”, Complex Intell.Syst.(2017), Springer.
[26] T.Ryan Hoens and Nitesh V.Chawla, “ Imbalanced Learning : Foundations, Algorithms, and Applications, John Wiley & Sons,Inc,2013.
[27] Nura Muhammad Baba, Mokhairi Makhtar,Syed Abdullah Fadzli and Mohd Khalid wang, “Current Issues in Ensemble Methods and its Applications”, Journal of Theoretical and Applied Information Technology, 20th
November 2015, Vol.81.No.2.
[28] Zhongbin Sun, Qinbao Song, Xiaoyan Zhu, Heli Sun, BaowenXu,Yuming Zhou, “A novel ensemble method for classifying imbalanced data”, Pattern Recognition 48 (2015) 1623-1637.
[29] Uma R.Salunkhe, Suresh N.Mali, “Classifier Ensemble Design for Imbalanced Data Classification: A Hybrid Approach”, Procedia Computer Science 85 (2016), 725-732.