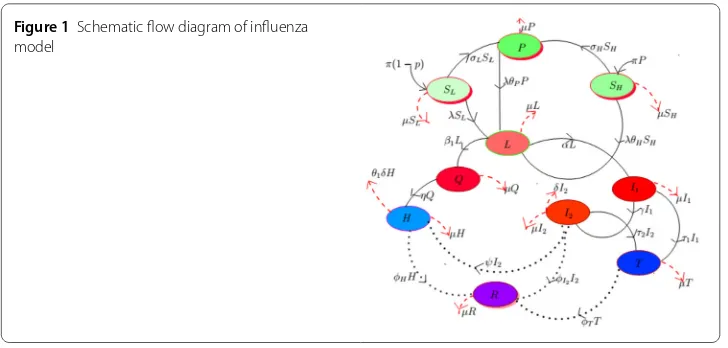
Dynamics of swine influenza model with optimal control
Full text
Figure


Related documents
Abbreviations: Abbreviations: FAS = Family Affluence Scale; K-SADS = Kiddie Schedule for Affective Disorders and Schizophrenia SCID-5 Structured Clinical Interview for DSM-5
The risk of current major depressive episodes, generalized anxiety disorder and suicide risk was more than three times elevated in women exposed to physical, sexual or
In Runnymede, hardware (alarm and telecare technologies) are also supplied by Tunstall, and software (at the monitoring centre) also by Jontek. Runnymede telecare
16 If I estimate human capital based on a pure body count labor input measure, average years of education for workers in the sample does have predictive power for
This study is an investigation of how cultural traditions can militate against the education of women in Zambia with a focus on the Tumbuka tribe.. Ethnographic methods
At each flow condition the 4-sensor probe was used to measure the local axial, radial and azimuthal oil velocity and the local oil volume fraction at 8 locations on a
Autocorrelation-based Factor Analysis and Nonlinear Shrinkage Estimation of Large Integrated covariance matrix..
Figure 8a, Figure 8d and Figure 8e respectively show the static pressure response of the centre, top and bottom taps to variation in yaw for both conical and hemispherical
