Auroral radio emission and absorption of medium frequency radio waves
observed in Iceland
Yuka Sato1, Takayuki Ono1, Masahide Iizima1, Atsushi Kumamoto1,
Natsuo Sato2, Akira Kadokura2, and Hiroshi Miyaoka2
1Graduate School of Science, Tohoku University, Japan 2National Institute of Polar Research, Japan
(Received June 3, 2007; Revised November 30, 2007; Accepted December 3, 2007; Online published March 3, 2008)
In order to study the generation and propagation processes of MF auroral radio emissions (referred to as auroral roar and MF burst) in the polar ionosphere, an Auroral Radio Spectrograph (ARS) system was installed at Husafell station in Iceland (invariant latitude: 65.3◦). Data analysis of man-made transmissions also provides useful information for the ionosphere study as well as an investigation of auroral radio emissions since the propagation character of MF radio waves changes depending on electron-neutral collisions in the bottomside ionosphere. Thus, ionospheric absorption is examined in comparison with the solar zenith angle and auroral phenomena. The results indicate that the ARS data can be used to detect ionization occurring at distant regions. In late 2006, the ARS detected one auroral roar and two MF bursts, which were identified as left-handed polarized waves. Results of data analysis, including other auroral data and particle spectra observed by the DMSP satellite, suggest that the MF bursts are generated by electrons with an average energy of several keV associated with auroral breakup. On the other hand, the auroral roar is generated as upper hybrid waves by relatively low-energy electrons over the observation site and propagates downward, being converted into L-O mode electromagnetic waves.
Key words:Auroral roar, MF burst, absorption, propagation, polarization observation.
1.
Introduction
Auroral roar and Medium-Frequency burst (MF burst) are members of auroral hectometric emissions, which have been detected at the ground-level. Some satellite obser-vations resembling auroral roar have also been reported (James et al., 1974; Oyaet al., 1985; Benson and Wong, 1987; Bale, 1999). Though radiation energy of the wave-particle interaction for these radio emissions is relatively small in comparison with Auroral Kilometric Radiation (AKR), study of the auroral radio emissions in the MF range is important for understanding the complex feature of the auroral phenomena generated in the polar ionosphere, planetary plasma and plasma in the universe (Labelle and Treumann, 2002).
Since the frequencies of auroral roar emissions are be-lieved to be near the second (Kellogg and Monson, 1979, 1984) and third (Weatherwaxet al., 1993) harmonics of the electron gyrofrequencies in source regions, they are referred to as 2fce and 3fce roar. MF burst shows a broadband
im-pulsive feature (Weatherwaxet al., 1994) with a bandwidth of 1–2 MHz in a frequency range of 0.8–4.5 MHz (LaBelle et al., 2005). The polarization character of 2fceroar and MF
burst have been identified as left-handed polarized waves by Shepherdet al.(1997), implying that they should propagate in the L-O mode in the ionosphere.
Copyright cThe Society of Geomagnetism and Earth, Planetary and Space Sci-ences (SGEPSS); The Seismological Society of Japan; The Volcanological Society of Japan; The Geodetic Society of Japan; The Japanese Society for Planetary Sci-ences; TERRAPUB.
Shepherdet al.(1999) showed the latitudinal dependence of auroral roar emissions, and it was reported that the in-tense auroral roar tended to appear in the poleward region of electrojets. They also examined Fast Auroral Snapshot (FAST) satellite data and compared simultaneous measure-ments of 2fce roar emissions and precipitating electrons. It
was suggested that auroral roar emissions were generated by inverted-V electrons; however, one-to-one correspon-dence between the location of the auroral electrojet and the source region of the auroral roar remains uncertain.
In order to clarify the nature of the MF auroral radio emissions and to understand their generation mechanism by observation, a new observation system named Auroral Ra-dio Spectrograph (ARS) was developed at Husafell station in Iceland (invariant latitude: 65.3◦). The ARS is designed to identify the spectra and polarization character of radio waves in the MF range, especially covering 3fceroar, whose
polarization character has not yet been clarified.
After being refurbished in late 2006, the ARS was able to detect the auroral roar and MF burst events successfully. The ARS observation data are analyzed in comparison with other data, such as geomagnetic field, riometer and auro-ral image data recorded at the ground-level and also auroauro-ral particle data observed by the SSJ/4 onboard the DMSP (De-fense Meteorological Satellite Program) satellites F13, F15, and F16. Within the data analysis of the present dataset, the DMSP satellites follow no conjugate path over the Husafell station simultaneously with the auroral roar and MF burst events detected by the ARS. However, characteristics of
208 Y. SATOet al.: MF AURORAL RADIO EMISSION AND ABSORPTION
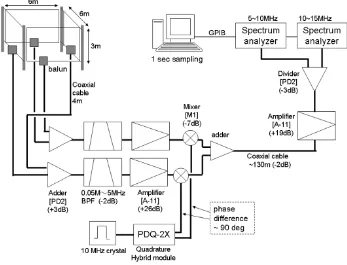
Fig. 1. A system block diagram of the ARS installed at the Husafell station in Iceland.
roral electrons precipitating near the station and position of auroral arc can be inferred by comparison with the DMSP data obtained in the conjugate region of the southern hemi-sphere.
To clarify the frequency spectra and occurrence character of the auroral radio emissions, it is necessary to take into ac-count the nature of radio wave absorption in the ionosphere, as pointed out by Weatherwaxet al.(1995). This is because occurrence of the auroral radio emissions observed on the ground is certainly controlled by the collisional damping ef-fect in the D and E regions of the ionosphere. It is noted that auroral absorption phenomena involve information of the auroral ionization and the magnetosphere-ionosphere inter-action as well as generation of the auroral radio emissions in the ionosphere. Therefore, in this paper, the nature of ionospheric absorption is also examined, including auroral absorption with a short time scale.
2.
Instrumentation
The ARS was set in September 2005 for observation of auroral radio emission in the MF range and was further im-proved in September 2006. As shown in Fig. 1, the front-end block of the ARS consists of loop antennas, baluns, electrical circuits of band pass filters, amplifiers and a po-larization separator. The back-end block consists of an am-plifier, two spectrum analyzers, a personal computer (PC), and a GPS receiver.
To detect the weak auroral radio waves on the ground, the ARS antenna was designed with four magnetic loop antenna elements, each with a size of 2.7×6.0 m. Two parallel pairs of loops are set up in the north-south and east-west direction, respectively. The band pass filter is a passive type filter made of capacitors and inductors and consists
of an 11th order low-pass filter and a 6th order high-pass filter whose cutoff frequencies are 5 MHz and 0.05 MHz, respectively. The polarization separator consists of two mixers, an adder and a local signal generator. The local signals with a phase difference of 90◦ are generated by a 10-MHz crystal oscillator and a quadrature hybrid module. The present instrument uses a unique technique to sep-arate the left-handed and right-handed circularly polarized components of coherent signals detected by the orthogonal antennas of X (north-south direction) and Y (east-west di-rection). The left-handed circular component (LH) picked up from the X and Y antennas are described as:
XLH=aLHcosωt YLH=aLHsinωt
(1)
whereaLHandωare the amplitude and the frequency of the left-handed polarized signal, respectively.
By mixing them with the local signals of LOX=cosω0t and LOY =sinω0t, which have phase difference of 90◦as shown in Fig. 1, the following equations are obtained:
XLH×LOX= aLH
2 [cos(ω+ω0)t+cos(ω−ω0)t] (2) and
YLH×LOY= aLH
2 [−cos(ω+ω0)t+cos(ω−ω0)t] (3)
Adding these signals, the amplitude of the left-handed polarized signal appearing at the frequency of|ω−ω0|is as follows:
Output(LH)=(XLH×LOX+YLH×LOY)
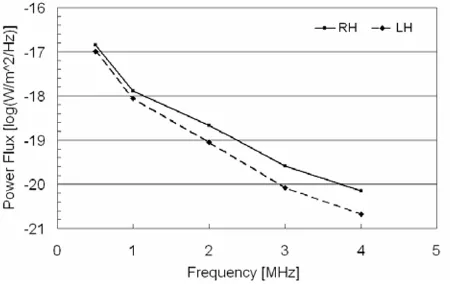
Fig. 2. The frequency dependence of system noise level plotted as the equivalent power flux of electromagnetic waves. The solid and dashed lines represent RH and LH polarized wave components, respectively.
On the other hand, the right-handed circular component (RH) picked up from the X and Y antennas are described as follows:
XRH=aRHcosωt YRH= −aRHsinωt
(5)
In the same way, the amplitude of the right-handed polar-ized signalaRHis obtained by the following equation:
Output(RH)=aRHcos(ω+ω0)t (6)
Equations (4) and (6) show that the amplitude of the LH component is obtained in the frequency band lower than the local signal, while the RH component is obtained in the frequency band higher than it. For the present instru-mentation,ω0 was set to 10 MHz; thus, the output signals with the frequency of 8 MHz and 12 MHz correspond to the power of the LH and RH polarized waves for the obser-vation frequency of 2 MHz, respectively. This method has an advantage in that it needs only one signal transmission line from the back-end block in the observation room to the front-end of the main receiver set up near the loop antenna site as shown in Fig. 1. It is noted that for the display of observation results of RH and LH polarization components, frequency is converted from 10–15 MHz to 0–5 MHz for the RH polarization and from 5–10 MHz to 0–5 MHz for the LH polarization. However, due to frequency response of the low-pass and high-pass filters, the frequency cover-age of the ARS receiver is identified as 0.05–5.0 MHz.
The front-end and back-end blocks are connected by a coaxial cable by which signals as well as electrical power are transmitted. The observed signals are finally input into the spectrum analyzers, and the PC controls the spectrum analyzers via the General Purpose Interface Bus (GPIB). The PC acquires the observation time and other observation parameters of the spectrum analyzers every 1 s, as well as data with the frequency range from 5 to 15 MHz. The ARS is designed to be operated continuously except when the DVD-RAM media is exchanged by the operator every 20 days.
In order to evaluate the absolute sensitivity of the ARS, calibration was carried by MF radio waves transmitted from
a standard loop antenna. Figure 2 shows the equivalent power flux for the background system noise level of the receiver, comparing a typical intensity range of MF auroral radio waves from 6.6×10⁻¹⁸−26.6×10⁻¹⁸ W/m2/Hz reported by LaBelle and Treumann (2002). As shown in Fig. 2, the ARS has enough sensitivity for detecting MF auroral radio emissions with typical intensity.
3.
Observation Data
3.1 Ionospheric absorption of man-made MF radio waves
Data from the ARS observation include not only auroral radio waves but also numerous sferics and man-made ra-dio waves. A large number of man-made MF rara-dio waves create a cluster of signals from distant radio stations. Data analysis of these wide band signals provides useful infor-mation for a study of ionosphere as well as auroral radio emission. The propagation character of MF radio waves is variable depending on the ionospheric condition, especially the electron-neutral collision, which is controlled by the so-lar zenith angle and soso-lar and geomagnetic activities. Thus, it is worth examining the collisional damping effect on long distance radio wave signals measured by the ARS. Iono-spheric absorption increases with an increase in the electron number density of the low altitude region of the ionosphere as well as neutral gas density. In the polar ionosphere, the ionization is given by the solar EUV radiation and auro-ral particle precipitation. Thus, it is possible to analyze the ARS data for the investigation of ionospheric absorp-tion depending on solar zenith angle and absorpabsorp-tion due to the auroral ionization.
3.1.1 Solar zenith angle dependence Figure 3(a) shows an example of the daily dynamic spectrum within a frequency range of 0.8–5.0 MHz observed on January 10, 2006, when the geomagnetic activity is classified as a quiet day (Kp =2+). All horizontal lines are regarded as
man-made signals. On geomagnetically quiet days, distant man-made signals tend to fade out in association with the sunrise. As shown in Fig. 3(a), the received power of man-made transmissions in the lower frequency range tends to fade out earlier than that of the higher frequency signals. This tendency is consistent with the report by LaBelleet al. (1994). The intensity of the broadcast signals from distant stations tends to recover with the sunset. The recovery of the broadcast signals in the higher frequency range tends to be earlier than that of lower frequency signals.
In general, the magnitude of absorption in the lower iono-sphere () is described by the following equation:
[dB]=4.6×10⁻⁵
ν
n
210 Y. SATOet al.: MF AURORAL RADIO EMISSION AND ABSORPTION
Fig. 3. (a) An example of the daily dynamic spectrum within a frequency range of 0.8–5.0 MHz observed on January 10, 2006. (b) The averaged power within the frequency band from 0.8 to 1.6 MHz (the solid line). The dashed line with dots (•) and the doted line with crosses (×) show calculated trends of absorption for the one hop propagation model. The lines with dots and crosses correspond to the results by assuming reflection points above the Husafell station (64.67N, 339E) and at the point of (62.0E, 353E), respectively.
is plotted by a solid curve in Fig. 3(b). Because the tem-poral variation of broadcasting signal intensity is controlled by the ionospheric absorption effect, data analysis of this absorption phenomenon reveals a general feature of spheric absorption due to ionization of low-altitude iono-sphere. So, the observed variation is compared with calcu-lated absorptionexpressed by Eq. (7) by assuming a sim-ple one-hop propagation path. In this calculation, the MSIS and IRI models are used to obtain values ofνandn, respec-tively. First, it is assumed that the absorption is controlled by the ionization above the Husafell station, i.e. the reflec-tion point is located above the stareflec-tion. The temporal vari-ation of the absorption magnitude from this model, shown by a dashed line with dots (•) in Fig. 3(b), does not show the real temporal change which is shown by the solid line in the same figure. There is a time lag of 55 min. This time lag suggests that the observed absorption may be controlled by the ionization in a different local time region. Next, the best fit propagation path with a distant reflection point is examined. Considering the time lag of 55 min, the absorp-tion point (i.e. reflecabsorp-tion point at a low-altitude ionosphere) should be located along 353E meridian (see Fig. 4). Consid-ering the secant law, the best-fit altitude of reflection point and incident angle are roughly estimated at about 85 km and 80◦, respectively. The calculated absorptionis shown by a dotted curve with crosses (×) in Fig. 3(b). The best fit condition leads the reflection point at 353E longitude and 62N latitude.
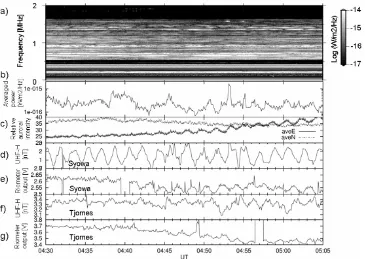
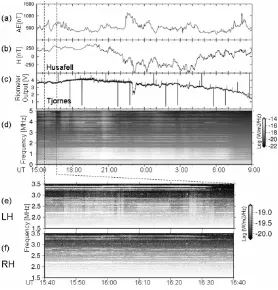
3.1.2 Auroral activity dependence (auroral absorp-tion) Figure 5(a) shows a dynamic spectrum in the fre-quency range of 0–5 MHz obtained for 18 h beginning at 1500 UT on September 23, 2006. Figure 5(b) displays vari-ations of averaged powers in the frequency ranges of 1.4– 1.6 MHz and 4.1–4.4 MHz. Figure 5(c) and 5(d) shows the H component of the magnetometer data and riometer data recorded at Tjornes station in Iceland, respectively. The ri-ometer data provide temporal variation of cosmic noise
in-tensity at 30 MHz to obtain cosmic noise absorption (CNA) associated with the energetic particle precipitation. Because geomagnetic data and riometer data were not available at the Husafell station at that time, we used the data obtained at the Tjornes station, which is located in the northeast part of Iceland (invariant latitude of 66.38◦and magnetic longi-tude of 71.08◦) as shown in Fig. 4.
After the end of the normal absorption effect due to the sunset, broadcasting signals appeared in a wide frequency range around 1800 UT. At 1840 UT, an abrupt decrease in the signal intensity appeared. At 2105 UT, the most significant absorption occurred and lasted for more than 30 min. In this event, absorption took place throughout the frequency range of the receiver from 0.5 to 5 MHz. As shown in Fig. 5(a), there were many absorption events ap-pearing through the night. In general, absorption of the man-made signals simultaneously occurs in both LH- and RH-polarized components. Night time absorption events were associated with geomagnetic auroral and CNA activ-ities. When we compare the magnitude of MF radio wave absorption with CNA data, it was measured as almost 20 dB while the CNA data varied by only 2 dB. The MF radio absorption event started within about 20 min prior to the auroral breakup. On the other hand, the abrupt absorption in the higher frequency range (4.1–4.4 MHz) occurred at 1840 UT with a clear time lag from the onset of geomag-netic and CNA disturbances measured at the Tjornes sta-tion. An absorption event occurred at 1840 UT and was de-layed by 20 min after the onset of the CNA event associated with a small fluctuation signature within positive bay event of the H component geomagnetic field. These time lags can be interpreted as spatial differences of ionospheric regions monitored by these observation instruments; namely, some-times auroral absorption detected by the ARS did not show a one-to-one correspondence with other auroral activities observed at the station.
absorp-Fig. 4. A geographic map near Iceland. The dashed line shows the longitude of 353E, and the shaded area is estimated ‘reflection region’ where most of distant man-made transmissions observed by the ARS are absorbed and reflected.
Fig. 5. Auroral absorption event associated with auroral activities from 1500 UT on September 23 to 0900 UT on September 24, 2006. There are plots of (a) a dynamic spectrum in the frequency range of 0–5 MHz, (b) variations of averaged powers for frequency ranges of 1.4–1.6 MHz and 4.1–4.4 MHz, (c) the H component of the geomagnetic field data at the Tjornes station, (d) riometer data at the Tjornes station, and (e) AE index.
tion, we examined ARS data in comparison with auroral pulsation in the Pc4 range obtained on September 25, 2006. Figure 6(a) and 6(b) shows a dynamic spectrum for a 0– 2 MHz frequency range observed from 0430 to 0505 UT and the variation of averaged power for a frequency range of 1.4–1.6 MHz, respectively. At this time, auroral pulsa-tion appeared in early morning hours after auroral breakup, which occurred at 2236 UT on September 24.
Also, at this time, an auroral TV camera (ATV) operated through the night. As a result, we were able to examine the temporal variation of auroral absorption detected by the
geo-212 Y. SATOet al.: MF AURORAL RADIO EMISSION AND ABSORPTION
Fig. 6. Auroral absorption event associated with Pc4 range auroral pulsation observed between 0430 UT and 0505 UT on September 25, 2006. There are plots of (a) a dynamic spectrum for the 0–2 MHz frequency range, (b) variation of averaged power for a frequency range from 1.4 to 1.6 MHz, (c) relative auroral intensity averaged over the east and north part of the sky: “aveE” and “aveN”, (d) the H component induction magnetometer at Syowa, (e) riometer data at Syowa, (f) the H component induction magnetometer at Tjornes, and (g) riometer data at Tjornes.
magnetic conjugate region of Husafell. Figure 6(f) and 6(g) shows the H component of the induction magnetometer data and the riometer data recorded at the Tjornes station. Al-though there are some data gaps in the geomagnetic data at the Tjornes station near 0449 UT and 0457 UT, we can clearly see conjugate behavior of ULF and CNA pulsations between the northern and southern hemisphere. Fourier analysis of the Syowa ULF data indicates that there is clear periodicity of 111 s. The pulsation signature also appears in the ARS data after 0450 UT with the repetition period of 90 s, as shown in Fig. 6(b). Although there is a small difference of periodicity, it is inferred that periodic absorp-tion found in the MF radio wave signal may be caused by periodic ionization due to pulsating auroras.
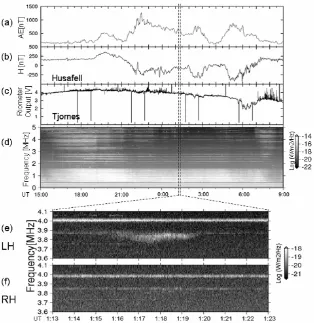
3.2 Auroral roar (November 10, 2006)
Within the observation period from September to November, 2006, one auroral roar event and two MF burst events were detected. Figure 7 shows the auroral roar event obtained around 0118 UT on November 10, 2006. Fig-ure 7(a)–(c) is the Auroral Electrojet (AE) index, the H component of the geomagnetic field at the Husafell station, and the riometer data at the Tjornes station from 1500 UT on November 9 to 0900 UT on November 10, 2006, re-spectively. Figure 7(d) shows a dynamic spectrum of ARS data for the same time period. Auroral absorption began near 1900 UT associated with the onset of a positive bay of the H component magnetic field observed at the Husafell station, as shown in Fig. 7(b). The auroral activity con-tinued as a relatively disturbed feature through the night with a maximum excursion of H component of the mag-netic field of−457 nT. The time period between the two
dashed lines in Fig. 7 includes the appearance of the auroral roar. It is noted that, during the auroral roar event, there was no significant change in the magnetic field at the Husafell station. Figure 7(e) and 7(f) shows the left-handed (LH) and right-handed (RH) polarization components of the ARS data recorded during the auroral roar event from 0113 UT to 0123 UT. The spectrum of the auroral roar is intensi-fied at 0115 UT lasting for 4.5 min. The central frequency varies between 3.82 and 3.87 MHz and the frequency band-width is within a range of 50–130 kHz. The peak intensity was measured as about 3×10⁻²⁰−10−19W/m2/Hz. Con-sidering the cyclotron frequency near the ionosphere, the present auroral roar emission can be recognized as a 3fce
roar emission. The intensity ratio of the LH and RH waves was measured as more than 10 dB. The observed 3fce roar
was then identified as a left-handed polarized wave. 3.3 MF burst (September 23 and October 28, 2006)
Fig. 7. The auroral roar event obtained around 0118 UT on November 10, 2006. The upper panels show (a) the AE index, (b) the H component of the geomagnetic field at Husafell, (c) riometer data at Tjornes and (d) a dynamic spectrum of ARS data observed from 1500 UT on November 9 to 0900 UT on November 10, 2006. The lower panels (e) and (f) are expanded dynamic spectra showing left-handed (LH) and right-handed (RH) polarization components of ARS data obtained 0113–0123 UT on November 10, 2006.
occur for about several minutes (Weatherwaxet al., 1995; LaBelleet al., 1997). Figure 8(c) shows a series of auroral images of 427.8 nm recorded by the Conjugate Auroral Im-ager (CAI) instrument, which was located in the Husafell station. When the MF burst appeared at 2123:10 UT, the auroral activity was not so strong, and it was located in the southern part of the sky. The auroral breakup started at 2125:00 UT, and it was delayed by more than 1 min after the MF burst event.
Figure 9 shows the second MF burst event obtained from 1500 UT on November 9 to 0900 UT on November 10, 2006. Figure 9(a)–(d) shows the AE index, the H compo-nent of the geomagnetic field at the Husafell station, riome-ter data at the Tjornes station and the dynamic spectrum of the ARS data, respectively. Two dashed lines in Fig. 9 indicate the time period when the MF burst is detected. Figure 9(e) and 9(f) shows expanded dynamic spectra of LH and RH components obtained from 1540 to 1640 UT. The present MF burst event can be identified as intermit-tent broadband emissions covering from 1.9 to 3.1 MHz ap-pearing only in the LH spectra, which also show that the MF burst is generated as a L-O mode plasma wave. The MF burst occurred early in the evening while AE showed activity of 1100 nT near 2220 UT. This event is charac-terized as being of long duration since it continued for sev-eral tens of minutes. LaBelleet al.(1997) reported that MF
bursts usually appear in association with auroral breakup. Although no auroral images were recorded due to the strong twilight of the early evening hours, the geomagnetic data suggests that auroral activity near the observation site was relatively low when the MF burst appeared. However, it is noted that fadeout of the MF burst is clearly accompa-nied by the strong absorption of MF radio waves in wide frequency range. When we take into account the auroral absorption event discussed on Fig. 5, it may be inferred that auroral activity was enhanced simultaneously with the end of the MF burst event.
3.4 Related auroral particle observation by the DMSP satellite
214 Y. SATOet al.: MF AURORAL RADIO EMISSION AND ABSORPTION
Fig. 8. Dynamic spectra of LH (panel (a)) and RH (panel (b)) components of ARS data recorded 2121–2125 UT on September 23, 2006. The MF burst appeared at 2123:10 UT only in the LH component spectrum. The panel (c) shows a series of 427.8 nm auroral images recorded by the Conjugate Auroral Imager (CAI) instrument located at the Husafell station.
Fig. 9. The MF burst event obtained on October 28, 2006. The upper panels show (a) the AE index, (b) the H component of the geomagnetic field at Husafell, (c) riometer data at Tjornes, and (d) a dynamic spectrum of ARS data observed from 1500 UT on October 28 to 0900 UT on October 29, 2006. The lower panels (e) and (f) are expanded dynamic spectra showing left-handed (LH) and right-handed (RH) polarization components of the ARS data obtained 1540–1640 UT on October 28, 2006.
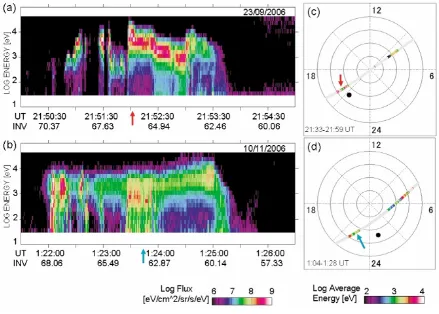
satellite orbits. The MF burst emission was detected at 2123:10 UT, which was about 30 min before the start time of the Fig. 10(a) plot. The auroral roar emission was ob-served within the period of 0115:00–0119:30 UT which was
Fig. 10. Energy-time spectra of precipitating electrons covering the energy range of 30 eV–30 keV obtained by the DMSP F16 within 5 min during 2150:00–2155:00 UT on September 23 corresponding to the MF burst event (a), and 0121:30–0126:30 UT on November 10 corresponding to the auroral roar event (b), when the conjugate footprint of the satellite was passing closest to the Husafell station. (c) and (d) display electron’s average energy along the satellite paths in a geomagnetic coordinate system using magnetic local time versus invariant latitude for the MF burst event and the roar event, respectively.
respectively. Each filled circle in Fig. 10(c) and 10(d) in-dicates the location of the Husafell station. These satellite paths are plotted by using a color code which indicates the electron’s average energy within 100 eV–10 keV. The weak precipitation region where the total energy flux is lower than 2×10¹⁰eV/cm2/s/sr is shown in gray color.
For the case of the MF burst event, high-energy electrons more than several keV are dominant when we compare the average energy and peak of the total energy flux obtained near the geomagnetic latitude of the Husafell station (65.3◦) (see the arrows in Fig. 10(a) and 10(c)). The result of the ground based observation given in Section 3.3 shows that the appearance of the MF burst seems to be closely related to active auroral phenomena, and it tends to disappear with the onset of the auroral breakup. These two lines of evi-dence obtained from the space and ground seem to be con-sistent each other. On the other hand, in the case of the auroral roar, a close relation can be found with the precipi-tation of relatively low energy electrons around the Husafell station (see the arrows in Fig. 10(b) and 10(d)). It is thus suggested that the MF bursts are generated by the electrons with an average energy of several keV associated with au-roral breakup; on the other hand, the auau-roral roar emission is generated by relatively low energy electrons.
4.
Discussion and Conclusion
In order to study the generation and propagation pro-cesses of the MF auroral radio emissions in the polar iono-sphere, the ARS system was installed at the Husafell station in Iceland. Observation data were investigated in terms of ionospheric absorption and MF auroral radio emissions. To understand the occurrence and propagation character of the MF radio emissions, it is necessary to examine the nature of ionospheric absorption. Normal absorption depending on the solar zenith angle on a geomagnetically quiet day was analyzed using a simplified propagation model. The results of the data analysis clearly showed that the majority of dis-tant man-made transmissions observed by the ARS came from the direction of the east under the strong effects of ab-sorption and reflection in the bottomside ionosphere region near the longitude of 353E. We examined auroral absorp-tion associated with auroral breakup as well as Pc4 range pulsating auroras. It is concluded that the ARS can detect the auroral activities indicating variations of auroral ioniza-tion occurring at distant regions from the Husafell staioniza-tion.
216 Y. SATOet al.: MF AURORAL RADIO EMISSION AND ABSORPTION
Fig. 11. Proposed generation mechanism of the auroral roar and the MF burst. The MF burst is generated in the auroral arc of the lower latitude region associated with precipitating electrons of higher energy (>several keV). It may propagate to the observation site and disappear with the beginning of strong ionization of the ionosphere. The auroral roar emission is likely to be generated as upper hybrid waves by relatively low-energy electrons over the observation point.
that during the solar minimum phase, the auroral oval tends to be contracted rather than at a solar maximum. However, these radio emissions clearly show that both 3fce roar and
MF bursts are LH polarized waves. Polarization character provides important information to understand the genera-tion mechanisms in terms of the plasma instability. Among the many candidates of plasma instabilities to generate nat-ural radio waves, the cyclotron maser instability (Wu and Lee, 1979) provides the RH polarized radiation. On the other hand, the mode conversion process (Oya, 1971) from upper hybrid waves to the L-O mode radio wave likely de-scribes the LH polarization character. One of the most prob-able mechanisms is that auroral roar is generated due to the mode conversion of upper hybrid waves to the LH po-larized ordinary mode electromagnetic waves. The possi-ble mechanism of the generation of the upper hybrid waves may be the loss cone plasma instability in the auroral iono-sphere where upper hybrid frequency matches cyclotron harmonics (Weatherwax et al., 1995; Yoon et al., 1998; Weatherwaxet al., 2002). This hypothesis has been par-tially verified for the 2fce auroral roar by Shepherdet al.
(1997). Thus, our observation result of the 3fce roar
sup-ports this proposed generation mechanism. It is well known that high-temperature anisotropy of the suprathermal elec-trons in plasma medium results in intense plasma instability, and it is further intensified when the upper hybrid frequency matches the harmonics of the electron cyclotron frequency (Shawhan, 1979).
In the MF burst event observed on September 23, 2006, the auroral breakup occurred about 1 min after the termi-nation of the MF burst. The appearance of the auroral roar observed on November 10, 2006 did not show clear cor-respondence with the temporal change of the geomagnetic activity. In addition, the particle observation by the DMSP satellites indicates that relatively low-energy electrons (less than 1 keV) are associated with the auroral roar emission. Precipitation of low-energy electrons causes ionization in a
relatively high-altitude region. In other words, it does not ionize the lower altitude region of the ionosphere. For ex-ample, 0.5-keV electrons ionize near an altitude range of 200 km (Ono and Hirasawa, 1992). In this case, the MF radio waves can propagate downward passing through the low-altitude regions of the ionosphere.
Compiling the observational evidence and the theoretical consideration leads to Fig. 11 which shows the occurrence of the MF burst and the auroral roar emissions. The MF burst is generated in the auroral arc of the lower latitude re-gion associated with precipitating higher energy electrons (>several keV). It can not propagate downward due to the collisional damping. MF burst waves propagating with a large horizontal component are able to arrive at the obser-vation site on the ground, as illustrated in Fig. 11. It may propagate to the observation site and disappear with the be-ginning of strong ionization in the ionosphere. The auroral roar emission is likely generated as the upper hybrid wave by the relatively low-energy electrons over the observation point and propagates downward while being converted into the L-O mode electromagnetic wave. The detail verification of one-to-one correspondence between auroral radio emis-sions and precipitating electrons still remains for a future study; however, the present study revealed a new aspect of the physics of auroral radio emissions. In order to verify our scenario of the auroral radio emissions, simultaneous obser-vations of auroral images and ionospheric plasma from the ground and in-situ auroral particle measurement are neces-sary for a future study.
References
Bale, S. D., Observation of topside ionosphere MF/HF radio emission from space,Geophys. Res. Lett.,26, 667–670, 1999.
Benson, R. F. and H. K. Wong, Low-altitude ISIS observations of auroral radio emissions and their significance to the cyclotron maser instability,
J. Geophys. Res.,92, 1218–1230, 1987.
Hughes, J. M. and J. LaBelle, The latitude dependence of auroral roar,J. Geophys. Res.,103, 14911–14916, 1998.
James, H. G., E. L. Hagg, and D. L. P. Strange, Narrowband radio noise in the topside ionosphere,AGARD Conf. Proc., AGARD-CP-138, 24-1, 1974.
Kelley, M. C.,The Earth’s ionosphere: plasma physics and electrodynam-ics, 487 pp, Academic Press, San Diego, 1989.
Kellogg, P. J. and S. J. Monson, Radio emissions from the aurora,Geophys. Res. Lett.,6, 297–300, 1979.
Kellogg, P. J. and S. J. Monson, Further studies of auroral roar,Radio Sci., 19, 551–555, 1984.
LaBelle, J. and R. A. Treumann, Auroral radio emissions, 1. Hisses, roars, and bursts,Space Sci. Rev.,101, 99–440, 2002.
LaBelle, J., A. T. Weatherwax, M. L. Trimpi, R. Brittain, R. D. Hunsucker, and J. V. Olson, The spectrum of LF/MF/HF radio noise at ground level during Substorms,Geophys. Res. Lett.,21, 2749–2752, 1994. LaBelle, J., S. G. Shepherd, and M. L. Trimpi, Observations of auroral
medium frequency bursts,J. Geophys. Res.,102, 22221–22231, 1997. LaBelle, J., A. T. Weatherwax, M. Tantiwiwat, E. Jackson, and J. Linder,
Statistical studies of auroral MF burst emissions observed at South Pole Station and at multiple sites in northern Canada,J. Geophys. Res.,110, A02305, 2005.
Ono, T. and T. Hirasawa, An apparent lifetime of auroral 630.0 nm (OI) Emissions,J. Geomag. Geoelectr.,44, 91–108, 1992.
Oya, H., Conversion of electrostatic plasma waves into electromagnetic waves: numerical calculation of the dispersion relation for all wave-lengths,Radio Sci.,6, 1131–1141, 1971.
Oya, H., A. Morioka, and T. Obara, Leaked AKR and terrestrial hecto-metric radiations discovered by the plasma wave and planetary plasma
sounder experiments on board the Ohzora (EXOS-C) satellite: Instru-mentation and observation results of plasma wave phenomena,J. Geo-mag. Geoelectr.,37, 237, 1985.
Shepherd, S. G., J. LaBelle, and M. L. Trimpi, The polarization of auroral radio emissions,Geophys. Res. Lett.,24, 3161–3164, 1997.
Shepherd, S. G., J. LaBelle, C. W. Carlson, and G. Rostoker, Latitudinal dynamics of auroral roar emissions,J. Geophys. Res., 104, 17217– 17232, 1999.
Shawhan, S. D., Magnetospheric plasma wave research 1975–1978,Rev. Geophys. Space Phys.,17, 705–724, 1979.
Weatherwax, A. T., J. LaBelle, M. L. Trimpi, and R. Brittain, Ground-based observations of radio emissions near 2fceand 3fcein the auroral
zone,Geophys. Res. Lett.,20, 1447–1450, 1993.
Weatherwax, A. T., J. LaBelle, and M. L. Trimpi, A new type of auroral ra-dio emission observed at medium frequencies (∼1350–3700 kHz) using ground-based receivers,Geophys. Res. Lett.,21, 2753–2756, 1994. Weatherwax, A. T., J. LaBelle, M. L. Trimpi, R. A. Treumann, J. Minow,
and C. Deehr, Statistical and case studies of radio emissions observed near 2fce and 3fce in the auroral zone,J. Geophys. Res.,100, 7745– 7757, 1995.
Weatherwax, A. T., P. H. Yoon, and J. LaBelle, Interpreting observations of MF/HF radio emissions: Unstable wave modes and possibilities to passively diagnose ionospheric densities,J. Geophys. Res.,107, 26-1-9, 2002.
Wu, C. S. and L. C. Lee, A theory of the terrestrial kilometric radiation,
Astrophys. J.,230, 621–626, 1979.
Yoon, P. H., A. T. Weatherwax, and T. J. Rosenberg, On the generation of auroral radio emissions at harmonics of the lower ionospheric electron cyclotron frequency: X, O and Z mode maser calculations,J. Geophys. Res.,103, 4071–4078, 1998.