energy intake,4,5fat intake, especially of ani-mal sources,5–7and dairy products and cal-cium8,9have been associated with a positive risk.10Among fruits and vegetables with sug-gested protective effects are tomatoes11and yellow-orange and cruciferous vegetables,12 although other studies13,14have not shown this association. A fish diet, with its unique marine omega-3 polyunsaturated fatty acids, has been suggested by some studies15,16 to protect against prostate cancer although others17have found no association. We studied the associ-ation between different dietary items and the detection of prostate cancer in a cohort of high-risk men.
Methods
Our study included 1356 patients who under-went transrectal ultrasonography–guided pro-static biopsy at the McGill Prostate Cancer Detection Clinic in Montréal, Que., between August 2003 and November 2006. The indi-cation for biopsy was based on an abnormal-ly elevated serum prostate-specific antigen (PSA) level, a rising serum PSA level or a sus-picious digital rectal examination. All men were asked to respond to a self-administered food frequency questionnaire (Appendix 1) before the procedure. Of these patients, 917 (68%) agreed and completed the question-naire, which measured the number of serv-ings per week among 12 food groups. The questionnaire also included demographic data (i.e., age, marital status, ethnicity, occu-pation and level of education), smoking habits, alcohol intake, family history of prostate cancer, medical history of general diseases (e.g., diabetes mellitus, liver diseases, heart diseases and arthritis) and local geni-tourinary conditions (e.g., cystitis, prostatitis,
Dietary habits and prostate cancer detection: a case–control study
Abstract
Background:Many studies have suggested that nutritional factors may affect
prostate cancer development. The aim of our study was to evaluate the rela-tionship between dietary habits and prostate cancer detection.
Methods: We studied 917 patients who planned to have transrectal
ultra-sonography–guided prostatic biopsy based on an elevated serum prostate-specific antigen (PSA) level, a rising serum PSA level or an abnormal digital rec-tal examination. Before receiving the results of their biopsy, all patients answered a self-administered food frequency questionnaire. In combination with pathol-ogy data we performed univariable and multivariable logistic regression analy-ses for the predictors of cancer and its aggressiveness.
Results:Prostate cancer was found in 42% (386/917) of patients. The mean
patient age was 64.5 (standard deviation [SD] 8.3) years and the mean serum PSA level for prostate cancer and benign cases, respectively, was 13.4 (SD 28.2) µg/L and 7.3 (SD 4.9) µg/L. Multivariable analysis revealed that a meat diet (e.g., red meat, ham, sausages) was associated with an increased risk of prostate can-cer (odds ratio [OR] 2.91, 95% confidence interval [CI] 1.55–4.87, p = 0.027) and a fish diet was associated with less prostate cancer (OR 0.54, 95% CI 0.32–0.89, p = 0.017). Aggressive tumours were defined by Gleason score (≥7), serum PSA level (≥10 µg/L) and the number of positive cancer cores (≥3). None of the tested dietary components were found to be associated with prostate can-cer aggressivity.
Conclusion: Fish diets appear to be associated with less risk of prostate cancer
detection, and meat diets appear to be associated with a 3-fold increased risk of prostate cancer. These observations add to the growing body of evidence suggesting a relationship between diet and prostate cancer risk.
Introduction
The incidence and mortality rates of prostate cancer vary widely among countries. The lowest prostate cancer incidence and mortality rates are observed in the Far East and on the Indian subcontinent, and the high-est rates occur in whigh-estern Europe, Australia and North America, with up to a 30-fold variation between highest and lowest rates.1,2Interestingly, there are differences within the same ethnic groups, such as Japanese living in the United States, who have a 4–5 times higher incidence of prostate cancer than those living in Japan.3Environmental and lifestyle factors, including dietary habits, are suggested as determinants. Total
CUAJ 2008;2(5):510-15
Moamen Amin, MD; Suganthiny Jeyaganth, MSc; Nader Fahmy, MD; Louis R. Bégin, MD;
Samuel Aronson, MD; Stephen Jacobson, MD; Simon Tanguay, MD; Wassim Kassouf, MD;
Armen Aprikian, MD
sexually transmitted infections and vasectomy). Transrectal ultrasonography–guided prostatic biop-sy was performed via the standard approach as described by Tanguay and colleagues18with a medi-an of 10 biopsy cores (rmedi-ange 6–14). All biopsies were examined by the same uropathologist (L.B.). The dietary intakes were divided into quintiles based on distributions. To assess recall bias we compared 50 (5.5%) patients who had repeated the questionnaire in their follow-up visits after 3 to 12 months. There was no statistically significant difference between the questionnaire answers in both sessions (p = 0.11) using the χ2test. We
per-formed univariable and multivariable logistic
regression analyses between the highest and low-est quintile of each food group and the detection of prostate cancer, and we estimated the odds ratio (OR) of prostate cancer and 95% confidence inter-val (CI) for food groups with adjustments for age, ethnicity, level of education, family history of prostate cancer, smoking and alcohol consump-tion, sexually transmitted infections, cystitis and prostatitis. We compared prostate cancer cases (n = 386, 42.1%) and nonsignificant pathology (n = 268, 29.2%) after exclusion of cases with high-grade prostatic intraepithelial neoplasia and atyp-ical small acinar proliferation. We defined aggres-sive prostate cancer by a Gleason score of 7 or
Table 1. Characteristics of study patients
Characteristics No. (and %) of cases No. (and %) of controls Odds ratio (95% CI) p value
Age, yr
60–64 77 (20.0) 72 (26.9) 1.06 (0.77–1.47)
65–69 96 (24.9) 68 (25.4) 1.41 (1.03–1.92)
≥ 70 141 (36.5) 38 (14.2) 3.71 (2.59–5.30) < 0.001
Ethnicity*
White 212 (55.0) 151 (56.3) 1.00†
Black 13 (3.4) 5 (1.9) 2.60 (0.92–7.29)
Asian 16 (4.2) 22 (8.2) 0.72 (0.38–1.38)
Hispanic 9 (2.3) 9 (3.4) 1.00 (0.39–2.51)
Other 97 (25.9) 66 (24.6) 0.63 (0.49–0.81) 0.250
Level of education, yr*
< 7 60 (15.5) 32 (12.0) 1.00†
7–11 132 (34.2) 76 (28.4) 1.71 (1.11–2.65)
≥ 12 152 (39.4) 138 (51.5) 1.10 (0.87–1.38) 0.060
Family history of prostate cancer
23 (6.0) 24 (9.0) 0.95 (0.54–1.69) 0.150
Smoking habit, index,* cigarette packs/yr
Never smoke 129 (33.4) 102 (38.1) 1.00†
< 200 35 (9.1) 30 (11.2) 1.16 (0.71–1.89)
200 to < 400 33 (8.6) 23 (8.6) 1.43 (0.84–2.44)
≥ 400 94 (24.4) 69 (25.8) 1.36 (0.99–1.85) 0.600
Alcohol, servings/wk*
No alcohol 41 (10.6) 33 (12.3) 1.00†
1 39 (10.1) 39 (14.6) 1.00 (0.64–1.55)
2–3 52 (13.5) 30 (11.2) 1.73 (1.10–2.71)
4–6 31 (8.0) 29 (10.8) 1.06 (0.64–1.77)
≥ 7 45 (11.7) 33 (12.3) 1.63 (1.06–2.52) 0.330
Vasectomy‡ 70 (18.1) 45 (16.8) 1.09 (0.65–1.78) 0.340
STIs‡ 101 (26.2) 65 (24.3) 1.13 (0.59–1.96) 0.230
Cystitis and/or prostatitis‡ 58 (15.0) 44 (16.4) 1.23 (0.83–2.12) 0.520
CI = confidence interval; STI = sexually transmitted infection. *Does not sum to total because of missing values. †Reference category.
greater, a serum PSA level of 10 µg/L or greater, or 3 or more malignant cores. All statistics were performed using Stata 9.2 (StataCorp).
Results
The mean age was 64.5 (standard deviation [SD] 8.3) years, and the mean serum PSA level for prostate cancer and benign cases was 13.4 (SD 28.2) µg/L and 7.3 (SD 4.9) µg/L, respect-ively. Table 1 demonstrates the baseline char-acteristics of both cases and controls with regard to age, ethnicity, level of education, fam-ily history of prostate cancer for father or broth-ers, smoking, alcohol consumption, history of vasectomy, sexually transmitted infections, cystitis and prostatitis. Both groups were sim-ilar except for statistically significant differences in the age between cases and controls (OR 3.71, 95% CI 2.59–5.30, p < 0.001). The rate of cancer appeared to be higher in African patients and lower in Asian patients but the dif-ference was statistically insignificant.
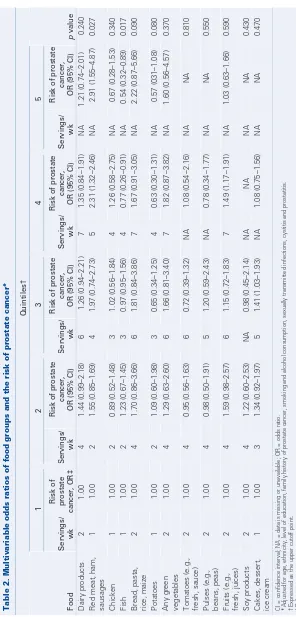
Multivariable analysis of food groups as shown in Table 2 revealed that a meat diet (e.g., red meat, ham, sausages) was associated with a higher risk of prostate cancer (OR 2.91, 95% CI 1.55–4.87, p = 0.027) and a fish diet was associated with less prostate cancer (OR 0.54, 95% CI 0.32–0.89, p = 0.017) after adjustment with suspected confounders (e.g., age, eth-nicity, family history of prostate cancer).
As regards the factors of aggressive tumours, none of the food groups were found to be asso-ciated with a higher Gleason score, a higher serum PSA level or a higher number of can-cer cores in our cohort as shown in Table 3.
Discussion
In our study we examined the possible asso-ciation of different dietary habits with prostate cancer detection. A statistically significant asso-ciated risk of prostate cancer was found with a meat-containing diet (OR 2.91) and a fish diet was found to be associated with less prostate cancer (OR 0.54). In our cohort there were 35% and 18% of cases present in the fourth and fifth quintiles of meat diet, respectively, and 25% and 14% of controls were present in the fourth and fifth quintiles, respectively. On the other
Table 2.
infections, cystitis and pr
hand, 11% and 8% of cases were present in the fourth and fifth quintiles of fish diet, respective-ly, and 14% and 10.5% of controls were present in the fourth and fifth quintiles, respectively. The fourth and fifth quintiles of meat diet presented 5 and greater than 5 servings per week, respect-ively, and the fourth and fifth quintiles of fish diet presented 4 and greater than 4 servings per week, respectively. The relationship between prostate cancer development and either total meat and fish or the specific fatty acids as marine omega-3 polyunsaturated fatty acids and omega-6 polyun-saturated fatty acids present in animal sources, was studied in several epidemiological and experimen-tal studies.19,20In vivo and in vitro studies suggest that omega-3 polyunsaturated fatty acids may pro-tect against prostate cancer, whereas omega-6 polyunsaturated fatty acids stimulate malignant cell growth.21–23 Those studies may explain our observations of the protective effect of a high intake of fish and the positive association between a high intake of different types of meat and prostate can-cer detection.
Although there exists some evidence of the
pro-tective effect of tomatoes and green vegetables against prostate cancer,13we did not find any sta-tistically significant association between those types of food with prostate cancer. Stram and coauthors14 performed a large multiethnic study on the effect of fruits, vegetables and micronutrients and the inci-dence of prostate cancer and, surprisingly, they also did not find any significant association. In our cohort we observed an association between pota-toes and low rates of cancer, and bread, pasta, rice and maize trended toward an association with a higher rate of cancer. Although these associations approached statistical significance (p = 0.08 and p = 0.09, respectively) it is possible that signifi-cance could be achieved with a greater number of patients. In addition, since the main component of both food groups is starch, it is possible that the apparently protective effect of potatoes is due to other associated dietary habits.
With respect to aggressive prostate cancer we examined the association of the same dietary habits with a high Gleason score (≥7), higher number of cancer cores (≥3) or higher serum PSA level (≥10). These criteria were chosen as they are commonly
Table 3. Multivariable odds ratios of food groups and the incidence of aggressive prostate cancer
Quintiles*; odds ratio (95% confidence interval)
Gleason score ≥ 7;
n = 188, 48.70%
No. of cancer cores ≥ 3;
n = 235, 60.88%
Serum PSA level ≥ 10 µg/L;
n = 84, 21.76%
Food Q1† Q5 p value Q1† Q5 p value Q1† Q5 p value
Dairy products 1 1.16 (0.68–1.97) 0.58 1 0.93 (0.54–1.60) 0.81 1 0.76 (0.43–1.35) 0.35
Red meat, ham, sausages
1 1.09 (0.65–2.45) 0.47 1 0.77 (0.44–1.36) 0.37 1 0.97 (0.54–1.76) 0.94
Chicken 1 1.04 (0.59–1.84) 0.59 1 0.96 (0.54–1.72) 0.90 1 1.05 (0.54–2.04) 0.87 Fish 1 1.44 (0.68–3.03) 0.33 1 1.04 (0.65–1.33) 0.12 1 0.91 (0.39–2.15) 0.84 Bread, pasta, rice,
maize
1 0.92 (0.55–1.53) 0.76 1 1.06 (0.63–1.78) 0.80 1 0.80 (0.46–1.39) 0.43
Potatoes 1 1.17 (0.63–2.15) 0.61 1 1.11 (0.60–2.05) 0.60 1 1.49 (0.75–2.94) 0.24 Any green vegetables 1 0.89 (0.65–2.14) 0.27 1 1.09 (0.69–2.25) 0.46 1 1.20 (0.62–2.32) 0.58 Tomatoes (e.g.,
fresh, sauce)
1 1.27 (0.72–2.23) 0.39 1 1.16 (0.66–2.02) 0.60 1 1.25 (0.66–2.39) 0.48
Pulses (e.g., beans, peas)
1 1.86 (0.86–3.99) 0.11 1 2.89 (0.98–8.16) 0.06 1 1.42 (0.61–3.41) 0.39
Fruits (e.g., fresh, juices)
1 1.55 (0.91–2.62) 0.10 1 1.28 (0.76–2.17) 0.34 1 1.09 (0.93–3.78) 0.09
Soy products 1 1.03 (0.88–1.21) 0.66 1 0.90 (0.65–1.98) 0.23 1 1.13 (0.76–1.89) 0.11 Cakes, desserts, ice
cream
1 0.95 (0.55–1.62) 0.86 1 0.70 (0.41–1.22) 0.22 1 1.78 (0.93–3.39) 0.08
PSA = prostate-specific antigen.
used in the clinic to differentiate low-risk from higher risk cancers. Although there was a statis-tically insignificant association between a high intake of pulses and a high Gleason score and a higher number of cancer cores (p = 0.11 and p = 0.06, respectively), we did not find any statisti-cally significant association between dietary habits and aggressive prostate cancer. It is possible that bias due to biopsy sampling limitations in the iden-tification of aggressive cancer is another reason we did not find significant relationships.
Case–control studies are considered susceptible to information bias more than cohort studies are24 since cases may be more careful than controls in searching their memory and may infer from known or suspected causes of their disease. To avoid this bias we asked all patients to answer the question-naire before they received the results of their biop-sies. In addition, there are several methods to assess dietary habits. Since developed in the 1950s, self-administered food frequency questionnaires have been considered appropriate methods for dietary assessment in nutritional epidemiology studies since they measure average long-term habitual dietary intake.25Self-administered food frequency ques-tionnaires have been validated in many studies compared with 24-hour recalls, food diaries or records of varying length, as well as biomarkers or calculating total energy intake and comparing it with energy expenditure.26–30We assessed our ques-tionnaire for variability by asking some patients to answer it again after a variable period of time and we observed no significant difference.
The weaknesses of our study include the short and incomplete nature of the food frequency ques-tionnaire without home confirmation, as well as the fact that the study population comprised men at high risk of prostate cancer who were referred to the centre for biopsy. As such, this study may not apply to the general population.
Conclusion
Fish-containing diets appear to be protective against prostate cancer, and meat diets are asso-ciated with a 3-fold increased risk of prostate can-cer detection. None of the dietary groups were found to be associated with aggressive prostate cancer on biopsy. These observations add to the growing body of evidence suggesting a relation-ship between diet and prostate cancer risk.
RReeffeerreenncceess
1. Parkin D, Muir C, Whelan W, et al.Cancer incidence in five countries. Lyon (FR): International Agency for Research on Cancer; 1992.
2. American Cancer Society. Cancer facts and figures, 2003. Atlanta: The Society; 2003. 3. Parkin DM, Whelan SL, Ferlay J, et al. Cancer incidence in five countries, vol VII.
Lyon (FR): IARC Scientific Publications; 1997.
4. Hsieh LJ, Carter H, Landis P, et al. Association of energy intake with prostate cancer in a long-term aging study: Baltimore Longitudinal Study of Aging (United States). Urology 2003;61:297-301.
5. Whittemore AS, Kolonel LN, Wu AH, et al. Prostate cancer in relation to diet, physi-cal activity, and body size in blacks, whites, and Asians in the United States and Canada. J Natl Cancer Inst 1995;87:652-61.
6. Giovannucci E, Rimm EB, Colditz G, et al. A prospective study of dietary fat and risk of prostate cancer. J Natl Cancer Inst 1993;85:1571-9.
7. Le Marchand L, Kolonel LN, Wilkens LR, et al. Animal fat consumption and prostate cancer: a prospective study in Hawaii. Epidemiology 1994;5:276-82.
8. Chan JM, Giovannucci EL. Dairy products, calcium, and vitamin D and risk of prostate cancer. Epidemiol Rev 2001;23:87-92.
9. Chan JM, Stampfer MJ, Ma J, et al. Dairy products, calcium, and prostate cancer risk in the Physicians’ Health Study. Am J Clin Nutr 2001;74:549-54.
10. Kolonel LN. Fat, meat, and prostate cancer. Epidemiol Rev 2001;23:72-81. 11. Giovannucci E, Rimm EB, Liu Y, et al. A prospective study of tomato products, lycopene,
and prostate cancer risk. J Natl Cancer Inst 2002;94:391-8.
12. Kolonel LN, Hankin J, Whittemore A, et al. Vegetables, fruits, legumes and prostate cancer: a multiethnic case–control study. Cancer Epidemiol Biomarkers Prev 2000;9: 795-804.
13. Schuurman AG, Goldbohm R, Dorant E, et al. Vegetable and fruit consumption and prostate cancer risk: a cohort study in The Netherlands. Cancer Epidemiol Biomarkers Prev 1998;7:673-80.
14. Stram DO, Hankin JH, Wilkens LR, et al. Prostate cancer incidence and intake of fruits, vegetables and related micronutrients: the multiethnic cohort study* (United States). Cancer Causes Control 2006;17:1193-207.
15. Augustsson K, Michaud D, Rimm E, et al. A prospective study of intake of fish and marine fatty acids and prostate cancer. Cancer Epidemiol Biomarkers Prev 2003;12:64-7. 16. Terry PD, Rohan T, Wolk A. Intakes of fish and marine fatty acids and the risks of
cancers of the breast and prostate and of other hormone-related cancers: a review of the epidemiologic evidence. Am J Clin Nutr 2003;77:532-43.
17. Schuurman AG, van den Brandt P, Dorant E, et al. Animal products, calcium and protein and prostate cancer risk in The Netherlands Cohort Study. Br J Cancer 1999;80:1107-13. 18. Tanguay S, Begin LR, Elhilali MM, et al. Comparative evaluation of total PSA, free/total
PSA, and complexed PSA in prostate cancer detection. Urology 2002;59:261-5. 19. MacLean CH, Newberry SJ, Mojica WA, et al. Effects of omega-3 fatty acids on
can-cer risk: a systematic review. JAMA 2006;295:403-15.
20. Ritch CR, Wan RL, Stephens LB, et al. Dietary fatty acids correlate with prostate can-cer biopsy grade and volume in Jamaican men. J Urol 2007;177:97-101. 21. Aronson WJ, Glaspy JA, Reddy ST, et al. Modulation of omega-3/omega-6
polyunsatu-rated ratios with dietary fish oils in men with prostate cancer. Urology 2001;58:283-8. 22. Pandian SS, Eremin OE, McClinton S, et al. Fatty acids and prostate cancer: current
sta-tus and future challenges. J R Coll Surg Edinb 1999;44:352-61.
Competing interests:None declared.
Correspondence:Dr. Armen Aprikian, Division of Urology, McGill University, Montreal General Hospital, L8-309, 1650 Cedar Ave., Montréal QC H3G 1A4; armen.aprikian@muhc.mcgill.ca
From the Division of Urology, Department of Surgery, McGill University Health Centre, Montréal, Que.
23. Ghosh J, Myers C E. Arachidonic acid stimulates prostate cancer cell growth: critical role of 5-lipoxygenase. Biochem Biophys Res Commun 1997;235:418-23. 24. Breslow NE, Day NE. Statistical methods in cancer research. Vol. I. The analysis of case
control-studies. Lyon (FR): IARC Scientific Publications;1980.
25. Willett W. Nutritional epidemiology. New York: Oxford University Press; 1998. 26. Jian L, Binns CC, Lee AH. Validity of a food-frequency questionnaire for elderly men
in southeast China. Public Health Nutr 2006;9:928-33.
27. Potischman N, Freudenheim JL. Biomarkers of nutritional exposure and nutritional status: an overview. J Nutr 2003;133(Suppl. 3):873S-4S.
28. Navarro A, Osella AR, Guerra V, et al. Reproducibility and validity of a food-frequency
questionnaire in assessing dietary intakes and food habits in epidemiological cancer studies in Argentina. J Exp Clin Cancer Res 2001;20:365-70.
29. Neuhouser ML, Kristal AR, McLerran D, et al. Validity of short food frequency ques-tionnaires used in cancer chemoprevention trials: results from the prostate cancer prevention trial. Cancer Epidemiol Biomarkers Prev 1999;8:721-5.
30. Boeing H, Bohlscheid-Thomas S, Voss S, et al. The relative validity of vitamin intakes derived from a food frequency questionnaire compared to 24-hour recalls and biological measurements: results from the EPIC pilot study in Germany. European Prospective Investigation into Cancer and Nutrition. Int J Epidemiol 1997;26(Suppl 1):S82-90.
Appendix 1. The self-administered food frequency questionnaire
1. Date of birth 2. Marital status 3. Ethnic background 4. Occupation 5. Level of education
6. Family history of prostate cancer
• History of prostate cancer in biological father • History of prostate cancer in biological brothers
(how many?)
• History of prostate cancer in biological sons (how many?)
7. Smoking • Age of starting • Age of stopping
• Number of cigarettes per day
8. Dietary intake (how many servings per week?) • Dairy products
• Red meat, ham, sausages • Chicken
• Fish
• Bread, pasta, rice, maize
• Potatoes
• Any green vegetables • Tomatoes (fresh, sauce) • Pulses (beans, peas, etc.) • Fruits (fresh, juices, etc.) • Soy products
• Cakes, dessert, ice cream • Alcohol
9. The history of the following diseases and its duration • Infection of the bladder
• Infection of the prostate • Cancer of the prostate • Diabetes
• Liver disease • Arthritis • Heart disease • Hypertension • Vasectomy
• Previous prostate biopsy