STABILITY INDICATING REVERSED PHASE-HIGH PERFORMANCE LIQUID CHROMATO
GRAPHY
METHOD DEVELOPMENT AND VALIDATION FOR SIMULTANEOUS DETERMINATION OF
RELATED SUBSTANCES OF CITICOLINE AND PIRACETAM IN PHARMACEUTICAL DOSAGE FORM
MANUTOSH ACHARYA
1*, JAIN AK
2, NAVNEET GARUD
3Received: 11 January 2016, Revised and Accepted: 02 February 2016 ABSTRACT
Objective: A high-performance liquid chromatography (HPLC) method was developed and validated to determine stability indicating method of Piracetam and Citicoline in a tablet dosage.
Methods: The separation was made using Inertsil C18, 250 × 4.6 mm, 5 µm column, mobile phase used contained phosphate buffer and acetonitrile in the gradient mode at wavelength of 205 nm for Piracetam and 280 nm for Citicoline on a PDA detector.
Results: The method showed good linearity for, respectively related substances of Citicoline and Piracetam with correlation coefficients in the range of 0.29-623 µg/mL and 0.48-1030 µg/mL, respectively. Method accuracy was assessed at three levels; the recovery ranged between 100.0% and 102% for Citicoline and for Piracetam between 94.3% and 109.1%. Limit of detection and quantification for Citicoline was 0.07 µg/mL - 0.25 µg/ml and for Piracetam 0.12 µg/mL - 0.41 µg/ml. The solution was found to be stable within 27 hrs at room temperature.
Conclusion: The method was demonstrated to be robust and simple, and suitable for industrial application for determination of related substances in the pharmaceutical preparation.
Keywords:Piracetam, Citicoline, Assay,Reversed phase-high performance liquid chromatography.
INTRODUCTION
Citicoline (Cytidine-5’-diphosphocholine) is intermediate in the biosynthesis of phosphatidylcholine. It plays an important role in cellular metabolism. Citicoline is readily absorbed in the gastrointestinal tract and widely distributed throughout the body, crosses the central nervous system (CNS), where it is incorporated into the membrane and microsomal fraction. It activates biosynthesis of structural phospholipids, increases brain metabolism, and acts on the levels of different neurotransmitters. It has a variety of applications in CNS injury models neurological disorders of the brain such as stroke, brain, trauma, Alzheimer’s and Parkinson’s disease [1-3].
Piracetam is a nootropic drug in the racetams group, with chemical name 2-oxo-1-pyrrolidine acetamide. Piracetam is a cyclic derivative of GABA
Both drugs are psychotherapeutic agents used as a psycho stimulant, nootropic, and neurotonics. These drugs increase the cerebral metabolism and level of various neurotransmitters including acetylcholine and dopamine. They exert their action by activating the biosynthesis of structural phospholipids in neuronal membrane.
The review of the literature regarding the quantitative analysis of Citicoline and Piracetam revealed that the attempts were made to develop analytical methods for estimation of Citicoline and Piracetam by spectrometric methods and LC methods the estimation individually [4-8]. The chemical structure of citicoline and Piracetam is shown in (Figs. 1 and 2).
UV spectrophotometric methods [9,10] and high-performance liquid chromatography (HPLC) methods [11-16] for simultaneous estimation as a combination of Citicoline and Piracetamin various dosage forms are also reported.
The objective of this analytical method development was to develop, optimize, and validate a rapid, specific, and economic and stability indicating reversed phase-HPLC (RP-HPLC) method for the simultaneous estimation of Citicoline and Piracetam in tablet dosage form on gradient mode offering better resolution of peak of interest as well as impurities so that it is useful even for studying degradation impurities when compared to isocratic mode analytical methods.
METHODS Materials
HPLC: Waters HPLC 2 2695 series consisting pump, auto sampler, UV-visible detector (PDA), Thermostat column compartment connected with Waters [alliance] Empower2 software Balance Sartorius Cpa225d Semi Micro Balance Sonicator Bio-Technics India, Mumbai.
Reagents buffer reagents such as potassium dihydrogen phosphate, ion pairing reagents such as hexane sulfonic acid sodium salt. Organic solvents such as methanol and acetonitrile.
Methodology
Preparation of mobile phase buffer
6.8 g of potassium dihydrogen orthophosphate and 1.0 g of hexane sulfonic acid sodium salt dissolved in 1000 mL Mili-Q water, pH adjusted to 3.0±0.05 with diluted ortho phosphoric acid, filtered through 0.45 µm membrane filter and sonicated to degas.
Mobile Phase A: Filtered and degassed buffer.
Mobile Phase B: Buffer and methanol in the ratio 90:10 [% v/v].
Preparation of diluent: Mixture of buffer and acetonitrile in the ratio 90:10 [% v/v].
Research Article
1R&D Centre, Omni Active Health Technologies, Thane - 400 064, Maharashtra, India. 2Department of Pharmacology, Gajara Raja Medical
College, Gwalior, Madhyapradesh, India. 3School of Studies, Pharmaceutical Sciences, Jiwaji University, Gwalior, Madhyapradesh, India.
Chromatographic parameters
Column: Inertsil C18, (250 mm × 4.6 mm), 5 µm or equivalent Detector: UV-visible (Use HPLC with PDA, MWD or DWD)
Detection Wavelength: 205 nm for Piracetam and 280 nm for Citicoline Flow rate: 1.0 ml/minute
Injection volume: 10 µl Column oven temperature: 30°C Runtime: 45 minutes
The detection, i.e., 205 nm for Piracetam and 280 nm for Citicoline wavelength was selected based on UV spectrum scan.
Gradient program
Time (min) Mobile Phase A Mobile Phase B
0 100 0
Mixture of buffer and acetonitrile in the ratio 90:10 [% v/v].
Standard preparation
40 mg of Piracetam working standard and 27.2 mg of Citicoline sodium working standard (equivalent to 25 mg of Citicoline) was weighed into a clean and dry 100 ml volumetric flask, 50 ml of diluent was added and sonicated to dissolve, and then volume was made up to the mark with diluent. Further dilute 1 ml of above solution was diluted to 100 mL with diluent. (Concentration of Citicoline was about 2.5 µg/ml, and Piracetam was about 4.0 µg/ml).
Preparation of test solution
20 tablets were accurately weighed, and average weight was determined. The tablets were crushed to yield fine powder. The powder equivalent to 100 mg of Citicoline and 160 mg of Piracetam was weighed into a 200 ml volumetric flask. 100 mL of diluent was added and sonicated for 15 minutes with intermittent shaking. The solution was allowed to cool at room temperature. Diluted to the volume with diluent and mix. The solution was filtered through 0.45 µm nylon syringe filter (concentration of Citicoline was about 500 µg/ml, and Piracetam was about 800 µg/ml).
Placebo preparation
The placebo equivalent to 100 mg of Citicoline was weighed (~160 mg of Piracetam) into a 200 ml volumetric flask and 100 mL of diluent and sonicated for 15 minutes with intermittent shaking. The solution was allowed to cool at room temperature. Diluted to the volume with diluent and mix. The solution was filtered through 0.45 µm nylon syringe filter
Validation of quantitative HPLC method [17,18]
The optimized RP-HPLC method was validated according to the procedures described in International Conference on Harmonization (ICH) guidelines Q2 [R1] for the validation of analytical method (ICH 2005).
Specificity
Specificity was the ability to assess unequivocally the analyte in the presence of components which may be expected to be present. Typically these might include impurities, degradants, matrix, etc.
Linearity and range
It is the ability of the method to elicit test result that is directly proportional to analyte concentration within a given range.
Acceptance criteria: The correlation coefficient should be NLT 0.999.
Calibration curve was plotted over a concentration range of 0.29-623 µg/ml of Citicoline and 0.48-1030 µg/mL of Piracetam.
Samples are prepared, filtered, and injected into HPLC system. Aliquots (10 µl) of each solution were injected from auto sampler under the operating chromatographic conditions described above. Calibration curve was constructed by plotting peak area verses concentration and the regression equation was calculated.
Accuracy and recovery
The absolute recovery of analytical method was measured as the response of a processed spiked matrix standard expressed as a percentage of the response of pure standard which has not been subjected to sample pretreatment and indicates whether the method provides a response for the entire amount of analyte that was present in the sample.
The accuracy of the method was determined by calculating recoveries of Citicoline and Piracetam by the standard addition method. Known amounts of standard solutions of Citicoline and Piracetam (0.05% to 1.00 % level) added to placebo preparation each in triplicate.
Limit of detection (LOD) and limit of quantification (LOQ)
The LOD and the LOQ of Citicoline and Piracetam were derived by calculating the signal-to-noise (S/N) ratio using the following equations designated by ICH guidelines.
LOD = 3.3 × s/S
LOQ = 10 × s/S
Where, s = the standard deviation of the response and S = slope of the calibration curve.
The LOD and LOQ were estimated by injecting lower concentration solutions of Citicoline and Piracetam and determining % relative standard deviation (RSD) of area responses of 6 replicate injections.
The LOD and LOQ were confirmed and recorded separately on the basis of the S/N ratio.
Method precision
The precision of the method was checked and verified by repeatability, inter-day precision, and variability due to the analyst. Repeatability was checked by injecting six test preparations into the HPLC system as per the test method. Ruggedness of the proposed analytical method was evaluated for variability studies such as variability due to analyst and variability due to a different day. Six test preparations were prepared and injected into the HPLC system as per the test method. The % of individual impurities for each sample was calculated. % RSD of individual impurities and total impurities was recorded.
Solution stability
The solution stability of Citicoline and Piracetam tablet was carried out by leaving both the test and standard solution in tightly capped volumetric flask at room temperature for 27 hrs. The same sample solution was analyzed initially and at various time intervals up to the 27 hrs throughout the study period. Both solutions were prepared in diluent.
Robustness
Robustness of the method was determined by small deliberate changes in flow rate (±10%), mobile phase composition (±2% absolute inorganic phase), pH (±0.2 unit), column oven temperature (±5°C), and detection wavelength (±5 nm). Placebo, diluted standard, and sample solution were injected under each of the robustness conditions and system suitability parameters were evaluated.
System precision
Forced degradation study
Citicoline sodium API and Piracetam API were subjected to various degradation conditions, namely acid, base, peroxide, and thermal conditions. The peak purity of analyte peaks and impurity peaks was checked using Waters Empower 2 Software.
Forced degradation study of Citicoline and Piracetam
Acidic degradation
About 50 mg was accurately weighed and transferred to a 100 ml volumetric flask, 50 ml of diluent was added and sonicated to dissolve. 5 ml of 0.1 N HCl was added and kept at a 100°C for 3 hrs in water bath. The solution was allowed to attain room temperature. Then, the solution was neutralized by 0.1 N NaOH and diluted to volume with diluent. Filtered and injected.
Base degradation
About 50 mg of was accurately weighed and transferred to a 100 ml volumetric flask, 50 ml of diluent was added and sonicated to dissolve. 5 ml of 0.1 N NaOH was added and kept at a 100°C for 3 hrs in water bath. The solution was allowed to attain room temperature. Then, the solution was neutralized by 0.1 N HCl and diluted to volume with diluent. Filtered and injected.
Peroxide degradation
About 50 mg was accurately weighed and transferred to a 100 ml volumetric flask, 50 ml of diluent was added and sonicated to dissolve. 5 ml of 3% H2O2 was added and kept at a 100°C for 3 hrs in water bath. The solution was allowed to attain room temperature. Then, the solution diluted to volume with diluent filter and inject.
Thermal degradation
About 50 mg was accurately weighed and transferred to a 100 ml volumetric flask, 50 ml of diluent was added and sonicated to dissolve. 5 ml of 5 ml of diluent was added and kept at a 100°C for 3 hrs in water bath. The solution was allowed to attain room temperature. Then, the solution diluted to volume with diluent filter and inject.
Hydrolytic degradation
Weighed accurately powdered sample equivalent to 100 mg of Citicoline (~160 mg of Piracetam) into a 200 ml volumetric flask, added to it 20 ml of water and sonicated for 15 minutes with intermittent shaking. Heated the solution at 100°C for 3 hrs in water bath. The solution was allowed to attain room temperature. Then, the solution was diluted to volume with diluent Filter and inject.
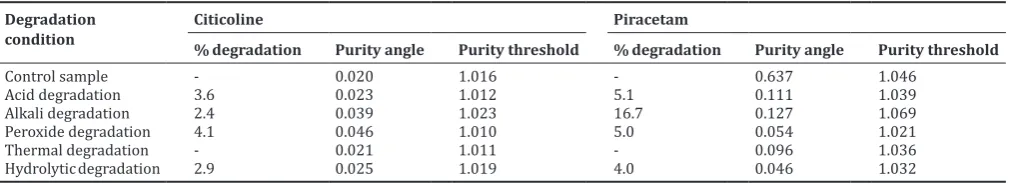
The % degradation with respect to control sample and peak purity data for Citicoline and Piracetam under various degradation conditions has been given in Table 1.
RESULTS AND DISCUSSION
The optimized RP-HPLC method for related substances was validated according to the procedures described in ICH guidelines Q2 (R1) for the validation of analytical method (ICH 2005).
Specificity
Blank (diluent), placebo, diluted standard, and samples were injected into HPLC and peak Purity of analyte peaks and impurity peaks was checked. The impurity peaks were found to be well resolved from each other and from analytes peaks. No interference was observed at the retention time (RT) of analyte peak and impurity peak from the blank and placebo solution. The peaks were found to be pure and homogenous indicating stability indicating the ability of the proposed method.
Linearity and range
The linearity data for Piracetam and Citicoline has been given Graphs 1 and 2.
The correlation coefficient was found NLT 0.98 that meets the acceptance criteria indicates that the responses are linear. This concludes that the method is linear throughout the range selected.
Accuracy
In table 2 and table 3 the data proved that The % recovery was found well within the accepted criteria (NLT 70.0% and NMT 130.0% at LOQ level and NLT 80.0% and NMT 120.0% at 0.1%, 0.3%, 0.5%, and 1.0% levels). Hence, the method is accurate throughout the selected range.
LOD and LOQ
The LOD and LOQ were estimated by injecting lower concentration solutions of Citicoline and Piracetam and determining % RSD of area responses of 6 replicate injections. Data obtained shown in Tables 4 and 5.
The % RSD for both the analytes was found well within the accepted criteria (NMT 10.0% at LOQ level and NMT 33.0% at LOD level). Hence, the method has a suitable level of LOD/LOQ.
Graph 1: Linearity data for Citicoline
Graph 2: Linearity data for piracetam
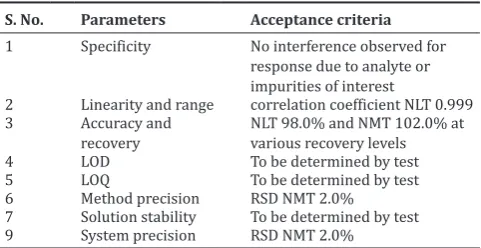
Table 1: Validation parameters and their acceptance criteria
S. No. Parameters Acceptance criteria 1 Specificity No interference observed for
response due to analyte or impurities of interest
2 Linearity and range correlation coefficient NLT 0.999 3 Accuracy and
recovery NLT 98.0% and NMT 102.0% at various recovery levels
4 LOD To be determined by test
5 LOQ To be determined by test
6 Method precision RSD NMT 2.0% 7 Solution stability To be determined by test 9 System precision RSD NMT 2.0%
Solution stability
The data shown in Table 6 indicate that the sample solution is stable for 13 hrs at room temperature.
From the results, it is concluded that the solutions are stable at room temperature for about 27 hrs.
Robustness
System suitability parameters were met under all robustness conditions except a change in organic content in a gradient program where significant RT shift was observed for both the analyzes peaks. Hence, it is recommended that organic content should be strictly adhered to as per the method.
The system suitability data under robustness conditions has been summarized in Table 8.
The RT and area data under robustness conditions in comparison to control sample has been summarized in Table 8.
Forced degradation study
The developed RP-HPLC method for determination of related substances of Citicoline and Piracetam in Citicoline and Piracetam
Table 4: LOD and LOQ data of Piracetam
Piracetam
at 205 nm Concentrationµg/ml % w/w
LOD 0.12 0.02
LOQ 0.41 0.05
Injection
no. Area countsLOD LOQ
1 4593 22784
2 5379 23782
3 5287 23652
4 6043 23653
5 4892 23273
6 6041 23149
Mean 5373 23382
SD 590.3 382.1
RSD [%] 10.99 1.63
SD: Standard deviation, RSD: Relative standard deviation, LOQ: Limit of quantification, LOD: Limit of detection
Table 5: LOD and LOQ data of Citicoline
Citicoline
at 280 nm Concentrationµg/ml % w/w
LOD 0.07 0.01
LOQ 0.25 0.05
Injection
no. Area countsLOD LOQ
1 5415 7468
2 4812 6855
3 5254 6806
4 5475 7006
5 5560 6879
6 5310 6687
Mean 5304 6950
SD 265.2 274.0
RSD (%) 5.00 3.94
SD: Standard deviation, RSD: Relative standard deviation, LOQ: Limit of quantification, LOD: Limit of detection
Table 2: Accuracy data for Piracetam
Recovery level % Recovery Average recovery % RSD
0.05% level 108.95 106.6 2.49
103.72 107.11
0.1% level 102.75 105.6 2.32
106.87 107.11
0.3% level 96.77 94.3 2.39
92.41 93.58
0.5% level 103.98 104.1 0.29
104.43 103.86
1.0% level 109.63 109.1 0.46
108.78 108.74
RSD: Relative standard deviation
Table 3: Accuracy data for Citicoline
Recovery level % recovery Average recovery % RSD
LOQ level 102.89 102.1 5.44
96.22 107.26
0.1% level 101.62 104.3 2.58
107.01 104.25
0.3% level 101.51 101.1 1.01
99.98 101.92
0.5% level 101.21 101.3 0.09
101.39 101.34
1.0% level 100.75 100.9 0.18
101.1 100.84
RSD: Relative standard deviation, LOQ: Limit of quantification
Fig. 1: Chemical structure of Piracetam
Table 6: Solution stability data of Citicoline and Piracetam at room temperature
Time-point Citicoline Citicoline impurity Piracetam
Area
counts Absolute % difference w.r.t. initial Area counts Absolute % difference w.r.t. initial Area counts Absolute % difference w.r.t. initial
Initial 7191962 - 5415 - 16125118
-4.5 hr 7150525 0.58 5532 2.16 16060262 0.40
9 hr 7168792 0.32 5496 1.50 16145022 0.12
18 hr 7159497 0.45 5500 1.57 16072626 0.33
27 hr 7153346 0.54 5454 0.72 16101095 0.15
Acceptance
criteria NMT 2.0% for two consecutive time-points NMT 10.0% for two consecutive time-points NMT 2.0% for two consecutive time-points
Table 9: Peak purity data of Citicoline and Piracetam in degraded tablet sample
Degradation
condition Citicoline% degradation Purity angle Purity threshold Piracetam% degradation Purity angle Purity threshold
Control sample - 0.020 1.016 - 0.637 1.046
Acid degradation 3.6 0.023 1.012 5.1 0.111 1.039
Alkali degradation 2.4 0.039 1.023 16.7 0.127 1.069
Peroxide degradation 4.1 0.046 1.010 5.0 0.054 1.021
Thermal degradation - 0.021 1.011 - 0.096 1.036
Hydrolytic degradation 2.9 0.025 1.019 4.0 0.046 1.032
Table 7: Robustness data of Citicoline and Piracetam diluted standard
Parameters Retention time USP plate count USP tailing factor
Citicoline Piracetam Citicoline Piracetam Citicoline Piracetam
Control (IA) 4.278 12.403 5290 10725 1.04 1.03
Flow plus (1.1 ml/min) 3.956 11.101 4784 9480 1.05 1.03
Flow minus (0.9 ml/min) 4.804 13.546 6080 16725 1.06 1.28
[+] Organic content in Mobile Phase B (Buffer: MeOH::88:12) 4.298 12.412 5284 10851 1.03 0.90 [-] Organic content in Mobile Phase B (Buffer: MeOH::92:8)* 2.746 4.600 2675 2743 1.11 0.99
pH plus (pH=3.20) 4.149 11.532 5120 10201 1.07 1.01
pH minus (pH=2.80) 4.343 11.585 5378 9747 1.10 0.98
Temperature plus (35°C) 4.017 11.661 5525 10455 1.06 1.03
Temperature minus (25°C) 4.640 13.312 5457 11435 1.02 1.00
Wavelength plus 4.285 (λ=285) 12.469 (λ=215) 5281 10922 1.07 0.98
Wavelength minus 4.285 (λ=275) 12.471 (λ=205) 5293 10698 1.08 0.98
*Non-robust condition
Table 8: Robustness data for RT and area of Citicoline and Piracetam of sample
Parameters RT Area
Citicoline Piracetam Citicoline Piracetam
Control (IA) 4.286 12.388 7142440 15789056
Flow Plus (1.1 ml/min) 3.919 11.101 6675779 14690096
Flow Minus (0.9 ml/minute) 4.770 13.722 8187676 18073171
[+] organic content in mobile Phase B (Buffer: MeOH::88:12) 4.297 12.329 7365848 16205575 [-] organic content in mobile Phase B (Buffer: MeOH::92:8)* 2.753 4.612 7231700 15470900
pH plus (pH=3.20) 4.094 11.529 7267393 16028965
pH minus (pH=2.80) 4.270 11.678 7435505 16099604
Temperature plus (35°C) 4.007 11.584 7162981 15912794
Temperature minus (25°C) 4.636 13.172 7247683 16057772
Wavelength plus 4.286 12.388 6538487 9550165
Wavelength minus 4.286 12.388 6922181 23407288
*Non-robust condition, RT: Retention time
combination tablet was found to be specific, accurate, and stability indicating and can be used for routine sample analysis. The retention time for acid degradation impurities in Citicoline & piracetam was found to be 3.59,5.37,6.01,6.79 mins and 10.06min, respectively.
The retention time for base degradation impurities in Citicoline & piracetam was found to be 3.55,5.35,6.00 mins and 17.85 min,respectively.
The retention time for peroxide degradation impurities in Citicoline & piracetam is 3.63,5.36,5.99 mins and 10.02min,respectively.The retention time for thermal degradation impurities in Citicoline & piracetam is 4.28 mins and 9.10,10.00min,respectively.The peak purity data is shown in (Table 9).
CONCLUSION
A stability indicating RP-HPLC method has been developed and validated to determine related substances of Piracetam and Citicoline in a pharmaceutical dosage form.
The validation characteristics included accuracy, precision, specificity, linearity, and robust, and stability indicating. The method was demonstrated to be robust, resistant to small variations of chromatographic variables. The proposed HPLC gradient method is very well demonstrating the resolution of main peaks and impurity peaks of both citicoline and Piracetam. This method is fast, simple, can be used for determination of related substances in the pharmaceutical preparation. Future research is recommended in any other pharmaceutical dosage form as the method is optimized to elute the maximum numbers of impurities.
ACKNOWLEDGMENT
The author is thankful to the management and colleagues of Plethico Pharmaceuticals Limited and Jiwaji University for providing the research facilities, drugs, and initiatives to carry out the work. The author is thankful to Mr. Amol Nalamwar, Mr. Rahul Singh and Ms. Ratna Upadhyay for their support.
REFERENCES
1. Wurtman RJ, Regan M, Ulus I, Yu L. Effect of oral CDP-choline on plasma choline and uridine levels in humans. Biochem Pharmacol 2000;60(7):989-92.
2. Rao AM, Hatcher JF, Dempsey RJ. CDP-choline: Neuroprotection in transient forebrain ischemia of gerbils. J Neurosci Res 1999;58(5):697-705.
3. Neil MJ, editor. The Merck Index- and Encyclopedia of Chemicals
Drugs and Biological. 13th ed. New Jersey: Merck and Co.; 2001.
p. 388, 1290.
4. Sachan N, Chandra P, Yadav M, Pal D, Ghosh AK. Rapid analytical procedure for citicoline in bulk and pharmaceutical dosage form by UV Spectrophotometer. J Appl Pharm Sci 2011;1(6)191-3.
5. Bhowmick AA, Khandelwal KR, Mhaske DV, Khadke S, Rajarshi S.
Analytical method development and validation for piracetam as bulk and in pharmaceutical formulation. J Biochem Biophys Methods 2007;69(3):273-81.
6. Ganduri RB, Peddareddigari JR, Dasari NR, Saiempu RK. Stability indicating LC method for the determination of citicoline sodium in injection formulation. Int J Pharm Tech Res 2010;2(1):427-33. 7. Uttarwar SO, Jadhav RT, Bonde CG. Stability indicating LC
method for citicoline sustained release tablet. Int J PharmTech Res 2010;2(4):2482-6.
8. Nalbandian RM, Kubicek MF, O’Brien WJ, Nichols B, Henry RL,
Williams GA, et al. Liquid-chromatographic quantification of
piracetam. Clin Chem 1983;29:664-6.
9. Prajapati MG, Parmar RR, Patel VM, Shah DA. Development and validation of analytical method for citicoline and piracetam in pharmaceutical dosage form by UV spectrophotometric method. Int J Inst Pharm Life Sci 2012;2(2):438-46.
10. Dhoru MM, Surani S, Mehta P. UV-spectrophotometric methods for determination of citicoline sodium and piracetam in pharmaceutical formulation. Pharm Lett 2012;4(5):1547-52.
11. Babu G, Prasad K, Kolla T, Vijayabaskaran M, Latha ST. Method development and validation of RP-HPLC for simultaneous estimation of citicoline and piracetam in tablet dosage form. Int J PharmTech Res 2011;3(3):1311-3.
12. Samatha Y, Sri Vidya A, Ajitha A, Uma Maheswararao V. Simultaneous method development and validation of citicoline and piracetam in bulk and its tablet dosage form. World J Pharm Res 2015;4(8):2383-92. 13. Kabra P, Nargund L, Murthy M. Development and validation of a
RP-HPLC method for the quantification of citicoline and piracetam. Int J Pharm Sci Rev Res 2012;16(1):111-4.
14. Bari SB, Gawad JB, Sugandhi GO. A validated stability indicating high performance liquid chromatographic assay method for simultaneous determination of citicoline and piracetam in tablet formulation. Int J Univ Pharm Bio Sci 2013;2(02):116-28.
15. Raga Pravallika E, Prashanthi D, Ismail Y. Method development and validation of RP-HPLC for simultaneous estimation of citicoline and piracetam in tablet dosage form. Int J Chem Pharm Sci 2012;3(2):76-9. 16. Venkatachalam T, Lalitha KG. Analytical method development and
validation of simultaneous determination of citicoline and piracetam at single wavelength. J Biomed Pharm Res 2014;3(3):67-74.
17. ICH Guidelines, Q1 A Stability Testing of New Drug Substances and Products; 1993. pg. 1-13.