R E S E A R C H
Open Access
Characterization of power spectral density for
nonlinearly amplified OFDM signals based on
cross-correlation coefficient
Taewoo Lee
*and Hideki Ochiai
Abstract
Orthogonal frequency division multiplexing (OFDM) has been adopted in many modern communication systems due to its robustness against frequency-selective fading channels as well as its near-rectangular spectrum that can achieve high spectral efficiency. However, its major drawback is the resulting signal with high peak-to-average power ratio (PAPR), which causes severe nonlinear distortion at the power amplifier (PA) unless input backoff is chosen sufficiently large. The effect of the nonlinear distortion is two-fold: out-of-band radiation and signal quality degradation. The former causes adjacent channel interference and thus degrades the bandwidth efficiency. The latter affects the system level performance and is often measured by the error vector magnitude (EVM). It is thus important for the system designer to analyze the nonlinear distortion caused by a given PA in terms of power spectral density (PSD) and EVM, but accurate calculation of these characteristics may be generally involved. In this work, by establishing the link between the cross-correlation coefficient of the input and output signals from PA and the resulting PSD, we characterize the in-band and out-of-band distortion of nonlinearly amplified OFDM signals based exclusively on the cross-correlation coefficient. The accuracy of the proposed approach is confirmed by both simulation and measurement using a real PA.
Keywords: Memoryless nonlinearity; Nonlinear distortion; Power amplifier; OFDM
1 Introduction
As the mobile terminals become smaller while meet-ing their demand for communication with even higher data rate, the future wireless communication signals should satisfy high bandwidth efficiency without sacri-ficing power efficiency. Orthogonal frequency-division multiplexing (OFDM) signaling has gained significant attention due to its high bandwidth efficiency and robust-ness against frequency-selective fading channels. How-ever, its well-known drawback is the high peak-to-average power ratio (PAPR) property of the resulting signals. High PAPR signal is difficult to amplify without sacrific-ing its power conversion efficiency at the linear power amplifier (PA). In order to maximize PA efficiency, it is essential to adjust the input signal to be amplified mostly around the saturation region. This PA operation
*Correspondence: taewoo@ochiailab.com
Department of Electrical and Computer Engineering, Yokohama National University, 79-5, Tokiwadai, Hodogaya, Yokohama 2408501, Japan
introduces severe nonlinear distortion which degrades the signal quality and, in turn, increases bit error rate (BER). In addition, it also introduces out-of-band radi-ation which causes adjacent channel interference (ACI). On the other hand, when we set the operation point of the PA much lower than its saturation point, it suffers from a severe power penalty. This is a well-known trade-off between the PA efficiency and the quality of trans-mit signals [1,2], a salient issue for the OFDM systems that exhibit highest PAPR among many communication systems.
The PA models are categorized into strictly memo-ryless, quasi-memomemo-ryless, and memory [3]. The output signal of strictly memoryless PA models (e.g., Rapp model [4]) depends only on the amplitude-to-amplitude (AM-AM) characteristic, while that of the quasi-memoryless PA models (e.g., Saleh model [5]) depends on both the AM-AM and amplitude-to-phase (AM-PM) characteristics.
Most wireless communication standards such as IEEE 802.11 wireless LAN strictly regulate the permissible spectral sidelobe levels in order to avoid ACI and thus enhance overall spectral efficiency of the multi-user sys-tems. The error vector magnitude (EVM) is another measure that characterizes the performance degradation caused by nonlinearity due to the system impairments and often restricted by the specification. The EVM is an alternative measure for a ratio of the power of the
received signal to that of the in-band distortion and
noise [2,6].
Therefore, from the viewpoint of communication sys-tem designers, it may be helpful if performance measures such as power spectral density (PSD) and EVM of the PA output signal are easily predicted or estimated.
The PSD of the signals affected by the nonlinearity of the PA has been extensively studied, mostly in conjunc-tion with the OFDM signals that can be characterized as a band-limited complex Gaussian process.
For example, in [7,8], based on the autocorrelation func-tion of memoryless PA output signal, the out-of-band spectrum has been theoretically analyzed and good agree-ment with the experiagree-mental result has been observed. In [9,10], using cumulant expression as a generalization of the autocorrelation function, the closed-form polynomial expression is derived. In [11], the spectrum estimation is performed by autocorrelation function with curve fitting by a series of Bessel function.
More recently, the nonlinearity analysis has been extended to the multiple-input and multiple-output (MIMO)-OFDM signals [12-14] as well as the degradation in terms of channel capacity [15].
One of the major issues associated with the above-mentioned approaches is how to accurately model a given PA. In principle, any well-behaved nonlinear func-tion can be approximated by Taylor series expansion or a series of special functions, but reducing the residual error in the estimated PSD requires an addition of higher order terms. Incorporating higher order terms, in turn, makes the analysis complicated or even mathematically intractable.
In this work, we propose an approach to develop a simple model that can accurately characterize the PSD and EVM of the resulting OFDM signals. Our approach is based on the use of the cross-correlation coefficient between the input and output signals from the PA, which can be easily calculated from its AM-AM and AM-PM characteristics and input backoff (IBO) operation. This cross-correlation coefficient is directly related to the con-cept of the total signal-to-distortion power ratio (SDR) discussed in [2]. Here, we emphasize that unlike con-ventional curve fitting approaches, our approach does not necessarily require the precise expressions for the AM-AM and AM-PM curves of a given PA in order
to characterize the resulting PSD and EVM. The accu-racy of the proposed approach is confirmed by simu-lation as well as an experimental measurement using a real PA.
The major contributions of this work are summarized as follows: 1) We theoretically establish the link among the cross-correlation coefficient, total SDR as well as in-band SDR (or EVM), and the resulting PSD. In particular, the effect of the higher-order distortion terms is theo-retically analyzed for two representative and analytically tractable nonlinear models. 2) We propose a simple PSD estimation approach that only makes use of the cross-correlation coefficient and the spectral shape of the third-order distortion. 3) The effectiveness of our approach is verified by both simulation and measurement using real PA with OFDM signal input. As is common in the statis-tical analysis of OFDM signals [8,9,11,16,17], the PA input signal is assumed to be a zero-mean circular symmet-ric stationary complex Gaussian process [18] throughout this work.
This paper is organized as follows. A general mathemat-ical expression of PSD for nonlinearly amplified Gaussian signals in terms of the correlation coefficients of input sig-nals is described in Section 2, followed by its examination through two specific nonlinearity examples in Section 3. In Section 4, the proposed estimation of PSD based on the cross-correlation coefficient of input and output sig-nals is developed and its application to OFDM signaling is discussed. The simulation and experimental results are compared with those based on the proposed theoretical approach in Section 5. Finally, the concluding remarks are given in Section 6.
2 PSD expression of nonlinearly amplified Gaussian signals
2.1 Input signal model
Throughout this paper, we assume that a complex base-band signalzi(t)input to the PA is characterized as a zero-mean circular symmetric stationary complex Gaussian process, which is considered as an accurate model for OFDM signals with a large number of subcarriers. It then follows thatzi(t)is expressed as
zi(t)=xi(t)+jyi(t)=r(t)ejθ(t), (1)
where r(t) = |zi(t)|,θ(t) = argzi(t), xi(t) = {zi(t)}, andyi(t)= {zi(t)}. By assumption,xi(t)andyi(t)can be considered as statistically independent real-valued zero-mean Gaussian processes. The autocorrelation function of a stationary processzi(t)can be defined as
Rzi(τ)E
where E{·} denotes an expectation operator. The corre-sponding correlation coefficient can be expressed as
ρzi(τ)
where ρxi(τ) is a real-valued correlation coefficient, and thus,ρzi(τ) is a real-valued function as well, satis-fying−1≤ρzi(τ)≤1.
2.2 Correlation coefficient of output signals
In principle, the amplitude and phase distortions associ-ated with a PA depend only on the amplitude of input signal envelope r(t) [9], and the corresponding output baseband signalzo(t)from the PA can be expressed as
zo(t)=g[r(t)]ej{φ[r(t)]+θ(t)}=G[r(t)]ejθ(t), (6)
where g[·] and φ[·] denote the AM-AM and AM-PM
conversions, respectively, and the complex gain is defined as
G(r)=g(r)ejφ(r). (7)
Following the results by Blachman [19], when the input signal is expressed as a complex stationary Gaussian pro-cess, the correlation coefficient of the output signalzo(t) can be expressed in terms of the correlation coefficient of the input signalρzi(τ)=ρxi(τ)as order term is expressed as [19]
Cn=
where p(r) is the probability density function (PDF) of the input enveloper(t) = |zi(t)|, which follows Rayleigh distribution, and expressed as
p(r)= 2r Pin
e−r2/Pin. (13)
(The above PDF assumption is valid for the OFDM sys-tem without PAPR reduction. When the PAPR of input signal is reduced before power amplification, the use of other distributions, e.g., [20], may result in more accu-rate result.) The functionL(nm)(z)in (12) is the generalized Laguerre polynomial [21], which can be expressed in a polynomial form for a non-negative integermas
L(nm)(z)=
where ρzi,zo ∈ C corresponds to the cross-correlation coefficient ofzi(t)andzo(t):
2.3 PSD of output signals
As a consequence of Bussgang theorem [22], the out-put autocorrelation function of a nonlinearly transformed Gaussian signal is decomposed as a sum of the scaled ver-sion of the autocorrelation function of the input signal and that of the distortion component uncorrelated with the input signal. It thus follows that the term withn=0 in (8), or equivalently (17), represents the useful signal compo-nent and the remaining terms correspond to distortion. In fact, taking Fourier transform of (8) gives thenormalized PSD, which is expressed as
where Sxi(f) is the PSD of the input signal directly obtained by Fourier transform of the correlation coeffi-cient of input signalρxigiven by
Sxi(f)=
∞
−∞ρxi(τ)e
−j2πfτdτ, (20)
and S(xim) denotes the self-convolution process with m times, i.e.,
Sx(im)(f)Sxi(f) · · · Sxi(f) m
, (21)
with corresponding to convolution operation. We also
note that due to the normalization, we have
∞
−∞S (m)
xi (f)df =1 (22)
for any positive integerm.
In principle, once the input signal PSDSxi(f) andCn are known, the output PSD can be determined through the above equations. In the case of OFDM, it is reasonable to assume that the PSD is rectangular, and in this case, the closed-form expression can be obtained for their self-convolution terms as will be discussed in Section 4.4. On the other hand, the coefficientCninvolves the nonlinear functionG(r) and whether it can be given in a tractable form or not depends on the mathematical structure ofG(r).
3 Examples of distortion coefficients for nonlinearly amplified Gaussian signals
In this section, we examine the effect of sharpness and smoothness of the nonlinearity on the resulting PSD by
analyzing the coefficients Cn/ξ in (19). The two spe-cific example AM-AM models, i.e., soft envelope limiter model and erf model, are considered as our representative examples.
3.1 Analysis of coefficients
By substituting (13) into (12), we obtain
Cn= 1 (n+1)Pin
n
k=0 (−1)k
k!
n+1 n−k
∞ 0
G(r)2r 2+2k
Pk+
3 2
in
×exp
−r2 Pin
dr
2
.
(23)
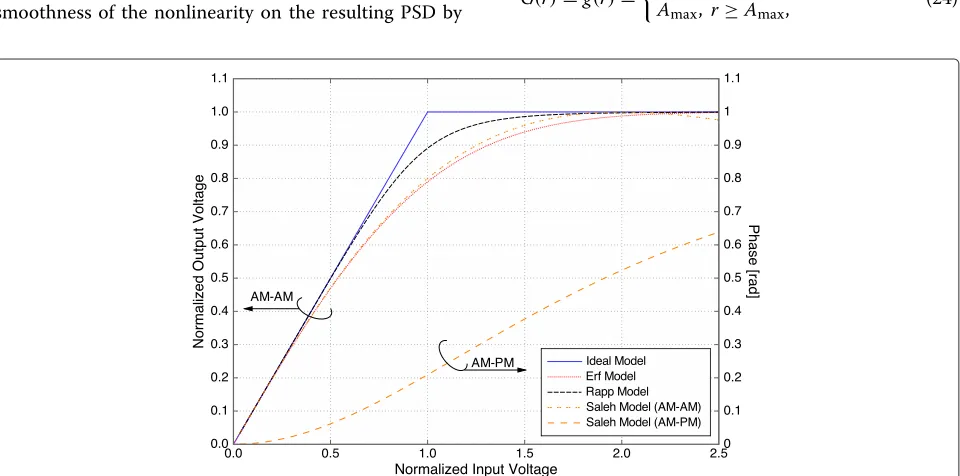
In general, except for some special cases ofG(r), (23) should be numerically calculated. The soft envelope lim-iter model and erf model turn out to result in analyti-cally tractable expressions, where the former serves as an example of sharpest nonlinearity (but perfectly linear up to the saturation point) and the latter as a smooth nonlin-earity (but severer in terms of amount of distortion [23]). These nonlinearity functions (including those described later in Section 5) are compared in Figure 1.
3.1.1 Soft envelope limiter model
The soft envelope limiter model is defined as
G(r)=g(r)=
r, r<Amax,
Amax, r≥Amax, (24)
Figure 1The AM-AM and AM-PM characteristics of PA models used in this work.The reference envelope levelAmaxis chosen as 1.0. For the
whereAmaxdenotes the maximum envelope level of input signal where it is linearly amplified. Note that without loss of generality, the amplifier gain is normalized to unity and the AM-PM characteristic is absent (i.e.,φ(r)=0) in this model. The clipping process is controlled by the IBO (or clipping ratio)γ = Amax/√Pin. By substituting (24) into (23) and after some algebra, we obtain
Cn=
where(a,b)is the incomplete gamma function given by
(a,b)=
∞ b
xa−1e−xdx, (26)
and(a)= (a, 0). Note that in [11], a recursive expres-sion of Cn for the soft envelope limiter is derived. On the other hand, from (25), one may directly obtain the following form: function with the error function erf(x)defined as
erf(x)= √2 π
x 0
e−t2dt, (28)
(a)kis the Pochhammer symbol [21] given by
(a)k = (a+k)
Eq. 27 states thatCn can be expressed by the square of linear combinations of termsγ2le−γ2 andγerfc(γ)for l=0, 1,. . .The first three coefficients are calculated as
C0 = The output power can be derived by using (10) and the output/input power ratioξ is given by
ξ = Pout Pin =
1−e−γ2. (34)
3.1.2 erf model
The erf model is defined as [2,24]
G(r)=g(r)=Amaxerf
where Amax in this case corresponds to the maximum
output envelope level if the power gain is normalized to unity.
By substituting (35) into (23),Cncan be expressed using γ =Amax/√Pinas and can be expressed as the following infinite series expression:
The infinite series in the above expression rapidly con-verges whenγ is not too small and thus easy to calculate in the case of a practical operation scenario. Finally, the output/input power ratioξ can be calculated as [2]
ξ = π4 γ2
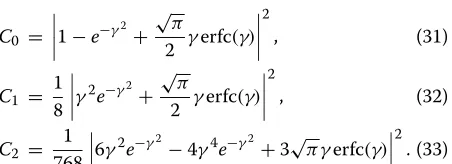
Figure 2a,b shows the relationship betweenCn/ξandγdB in the case of soft envelope limiter model and erf model,
respectively, where the IBO here is defined as γdB
(a)
(b)
Figure 2Correlation vs. input backoff.The relationship between higher-order nonlinear distortion componentsCn/ξand input backoff for (a)soft envelope limiter model and(b)the erf model.
higher as we increase IBO, the effective signal term(C0) increases, whereas the other terms that represent residual distortions decrease.
In the case of the soft envelope limiter, whenγdBis low, the third-order distortion term (C1) becomes dominant, but asγdBincreases, higher-order terms eventually dom-inate. This particular behavior is mostly specific to the case of the soft envelope limiter which has a piecewise linear characteristic such that the envelope undergoes severe nonlinearity at the saturation point. On the other hand, in the case of the erf model, the third-order distor-tion term (C1) is always dominant and higher-order terms become less dominant, and this holds almost regardless of the IBO value. Therefore, for many practical amplifiers
that have smooth nonlinearity, the third-order term may be considered as the most effective factor in the PSD analysis.
4 Simple expressions for approximate PSD and EVM upper bound
4.1 Total signal-to-distortion power ratio
From (19) and (22), we observe that the total signal power after nonlinear amplification is expressed as
∞
where the first termn= 0 corresponds to the useful sig-nal component and the others correspond to distortion. Therefore, the total SDR can be defined as
SDRtotal design SDR in [2] and can be easily calculated through the measurement of only the cross-correlation coefficient (18).
4.2 Effective signal-to-distortion power ratio
As mentioned in [2], the total SDR defined above contains both in-band and out-of-band distortion components, whereas the in-band distortion is only a dominant fac-tor for detection of the data. Thus, theeffectiveSDR may be defined based on the in-band distortion component only. To this end, we divide the power spectra correspond-ing to the ordern ≥ 1 into the in-band and out-of-band components as
whereDinandDoutrepresent the frequency regions cor-responding to in-band and out-of-band, respectively.
The effective SDR is then defined as
SDReff
We denote the most dominant in-band spectral compo-nent as
The EVM can be then upper-bounded by
EVM=
4.3 Simple approximate expression of power spectral density using cross-correlation coefficient
In Section 3.2, we have seen that in both the cases of smooth and sharp (including piecewise linear) nonlin-earity, the third-order component (C1/ξ) is a dominant factor of distortion. Using this fact, we establish the simple approximate PSD expression based only on the input/output cross-correlation coefficient and the PSD of input signals.
First, let us express (19) as
Szo(f)=
Since in generalCn/ξ becomes smaller asnincreases, δ(f) in the above expression may be negligibly small in most scenarios, and ignoring this term leads to the following approximate PSD expression:
Szo(f)≈ρzi,zo
4.4 Power spectrum expression for band-limited OFDM signals
define thelth complex baseband OFDM signal centered at the zero frequency that can be expressed as [25]
zi,l(t)= √1 N
N−1 k=0
Xl,kej2π(k−(N−1)/2)t/T, (48)
whereNis the number of subcarriers,Xl,kdenotes a QAM (or PSK) symbol on thekth subcarrier of thelth OFDM symbol, andT is a symbol period.
Note thatzi,l(t)defined in (48) is periodic with periodT, and the resulting input signal formed by the consecutive OFDM symbols may be expressed as
zi(t)= that controls the smoothness of the transition between the consecutive OFDM symbols. Strict characterization of the PSD requires the knowledge ofw(t)as it also causes the spectral leakage. In this paper, however, we focus only on the out-of-band radiation caused by nonlinear distor-tion through examinadistor-tion of only one OFDM symbol for simplicity, and the effect of the spectral leakage caused by this windowing will not be considered.
Provided that{Xl,k}are independent and identically dis-tributed (i.i.d.), as N increases, the distribution of the OFDM signal is known to approach that of a complex Gaussian random process with near rectangular spectral shape. Therefore, in what follows, we assume thatzi(t)is an ideally band-limited Gaussian random process whose PSD is expressed as
Szi(f)=Sxi(f)=
1, |f|< 12,
0, otherwise. (50)
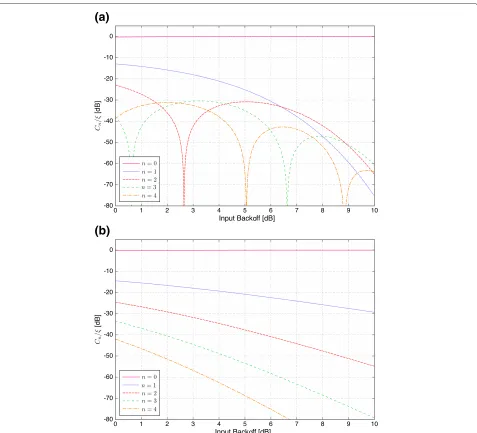
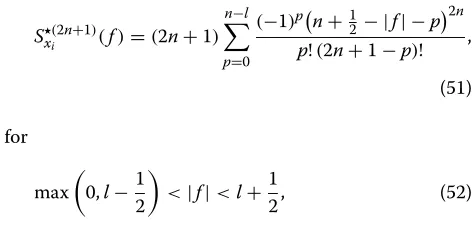
Then, its self-convolution can be expressed by [26,27]
S(xi2n+1)(f)=(2n+1)
After some algebraic manipulation, we obtain the expression of the power that falls in-band as
βn,in=2
and we observe that it decreases monotonically. Thus, the
maximum in-band spectral component is β∗,in = 23 in
this case. Consequently, the following observation can be made from (44). The effective SDR and the total SDR are related by
SDReff≥ 3
2SDRtotal. (56)
That is, the effective SDR is at least 1.76 dB higher than the total (or design) SDR in the case of OFDM signals with near rectangular spectrum, which agrees with the observation given in [2].
The PSDs of the several beginning orders ofSx(i2n+1)in the case of the rectangular input spectrum are plotted in Figure 3. It is observed that with increasingn, the in-band component steadily decreases and thus the sidelobe power increases accordingly.
5 Numerical and experimental results
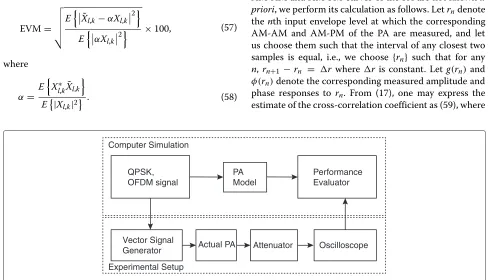
In this section, through simulation and actual measure-ments, we verify the effectiveness of the proposed theoret-ical PSD expression derived in the previous section. The simulation and experimental procedures are illustrated in Figure 4.
5.1 Calculation of PSD and EVM for simulation and measurement
In this work, we calculate the periodogram by taking an ensemble average of the square of discrete Fourier trans-form of the generated and power amplified complex base-band OFDM signals. Upon evaluating the periodogram
through simulation and measurement, the N-subcarrier
Figure 3The self-convolution of the power spectral densityS(2xi n+1)forn=0, 1, 2,and3.
period withJtimes oversampling, i.e., withJ N-point FFT. In this manner, the effect of the spectral leakage associ-ated with OFDM symbol transition is eliminassoci-ated from our PSD calculation, and the results become consistent with our theoretical analysis.
For the EVM, we calculate the root mean square error between the detected symbol X˜l,k and the transmitted
symbol Xl,k scaled by an optimal attenuation factor,
i.e., [2]
EVM=
( ) ) ) *E
#˜
Xl,k−αXl,k 2$ E#αXl,k2
$ ×100, (57)
where
α= E
#
Xl,k∗ X˜l,k
$
E|Xl,k|2
. (58)
This will be compared by the upper bound based on the total SDR, i.e., (45) withβ∗,in= 23.
5.2 Calculation of cross-correlation coefficient for measurement
The calculation of our proposed approximate PSD at least requires the knowledge of the cross-correlation coeffi-cient (17). In the case of the measurement where the
AM-AM and AM-PM curves of the PA are not knowna
priori, we perform its calculation as follows. Letrndenote thenth input envelope level at which the corresponding AM-AM and AM-PM of the PA are measured, and let us choose them such that the interval of any closest two samples is equal, i.e., we choose {rn} such that for any n,rn+1−rn = r whereris constant. Letg(rn) and φ(rn)denote the corresponding measured amplitude and phase responses to rn. From (17), one may express the estimate of the cross-correlation coefficient as (59), where
PA Model QPSK,
OFDM signal
Performance Evaluator Computer Simulation
Experimental Setup Vector Signal
Generator Actual PA Attenuator Oscilloscope
ρzi,zo2≈
' !
ne −r2n
A20γ
2 0
rn2g(rn)cos [φ(rn)]
+2 +
' !
ne −r2n
A20γ
2 0
rn2g(rn)sin [φ(rn)]
+2
' !
ne −r2n
A20γ
2 0
r3 n
+ ' !
ne −r2n
A20γ
2 0
rng2(rn)
+ , (59)
γ0A0/√Pincorresponds to the IBO with the reference maximum envelope level denoted byA0.
5.3 Simulation setup
For the Monte-Carlo simulation, we generate 1,024,000
OFDM symbols with the number of subcarriersN=256,
where each subcarrier is modulated by QPSK except for the center subcarrier that is set to be null. Since arbi-trary PA characteristics can be generated for simulation, in addition to the soft envelope limiter and erf models described in Section 3.1, we consider the well-adopted Rapp and Saleh models described below as our reference of more practical PA models. Their complex gains are plotted in Figure 1. For both cases, the coefficientsCnof (23) may not be expressed in a convenient analytical form, and thus they should be calculated numerically.
5.3.1 Rapp model
The Rapp model (also known as Cann model [28,29]) is frequently adopted for describing an SSPA model and given by [4]
g(r)= , r
1+(r/Amax)2p-21p
, (60)
where the definition ofAmaxis the same as that of the erf model, and pis a smoothness factor that controls tran-sition from linear to nonlinear region of PA. Note that there is no AM-PM effect in the Rapp model, that is, φ(r) =0. Throughout this work,p=3.0 will be adopted as a relatively good AM-AM example.
5.3.2 Saleh model
In contrast to the Rapp model which has no AM-PM effect, we examine the TWTA model based on the Saleh model [5]. The AM-AM characteristic is given by
g(r)= r
1+14(r/Amax)2
(61)
and its AM-PM characteristic is
φ(r)= π 12
(r/Amax)2
1+ 14(r/Amax)2 (rad). (62)
5.4 Experimental setup
In the case of the measurement using actual PA where the basic configuration of the experimental setup is illustrated in Figure 4, the data used for generating the input OFDM signals are chosen to be the same as those used in the sim-ulation process. The complex baseband OFDM signal is
generated by a computer and then up-converted to the RF signal by the vector signal generator (VSG). The number of the OFDM symbols generated for this measurement is 576,000. The RF-modulated signal by VSG is then power amplified by the actual PA and then is fed after attenuation of the signal power to the oscilloscope where the non-linearly amplified signal is captured and down-converted to the baseband OFDM signal. Finally, the captured data is analyzed by computer in terms of the resulting PSD and EVM.
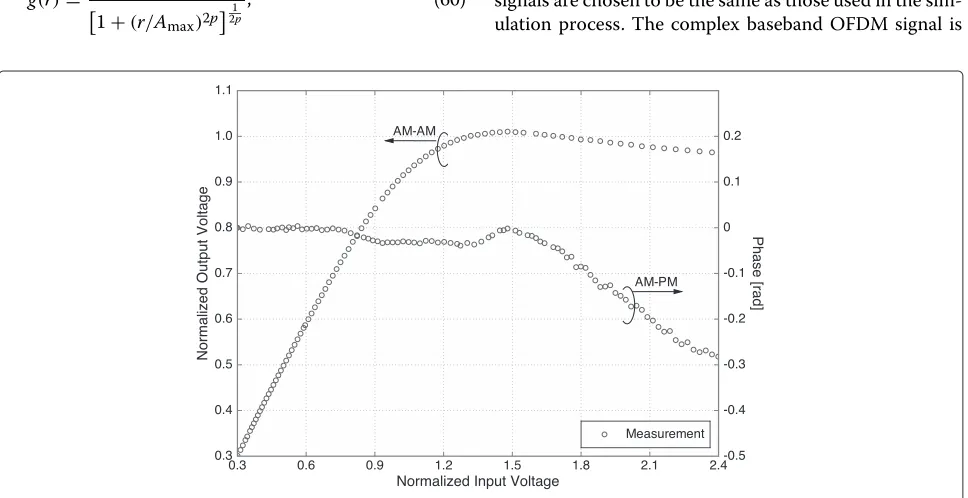
The PA used in this measurement is the SSPA with gain of 29 dB at 2 GHz, and operates with the input signal frequency ranging from 2 MHz to 3 GHz. Our measure-ment was performed at 800 MHz. The bandwidth of the
OFDM signal was set as 12.5 MHz. The AM-AM and AM-PM characteristics have been measured by the single frequency input from VSG, and their characteristics are plotted in Figure 5.
5.5 Numerical and experimental results
For all the theoretical results on PSD, we refer to the results as ‘exact’ when it is calculated using (19) with
the coefficients Cn given by (23), where the
summa-tion is taken up ton = 10 terms. On the other hand,
the proposed simple approximate form (which will be referred to as ‘approximation’ in the results) is based on (47) where the cross-correlation coefficient is calculated from (17).
(a)
(b)
For the exact case, the required self-convolution of the spectrum is calculated using (51), whereas only (53) is used for the approximation.
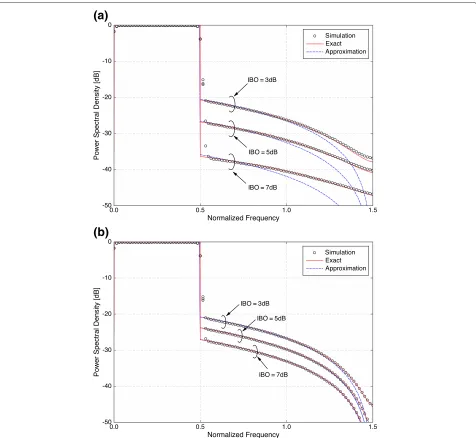
5.5.1 Power spectral density
We start with the PSD results for the OFDM signal ampli-fied by the soft envelope limiter shown in Figure 6a. In all the cases of IBO examined, it is observed that the exact one and simulation well agree. Furthermore, the proposed simple approximation shows good agreement with the simulation results and this tendency becomes noticeable as the IBO decreases. The reason for this behavior can be verified from Figure 2a where the lower-order nonlinear distortion is dominant in lower IBO, whereas higher-order
terms eventually prevail as IBO increases. For example, we observe from Figure 2a that the amount of nonlinear distortion ofn = 2 becomes greater than that ofn = 1 when the IBO is higher than 6.5 dB.
Next, we examine the erf model, and the results are shown in Figure 6b. In this case, we observe that all the three cases show almost perfect agreement. This is due to the fact that the third-order nonlinear distortion is dom-inant in all the IBO range of interest as observed from Figure 2b.
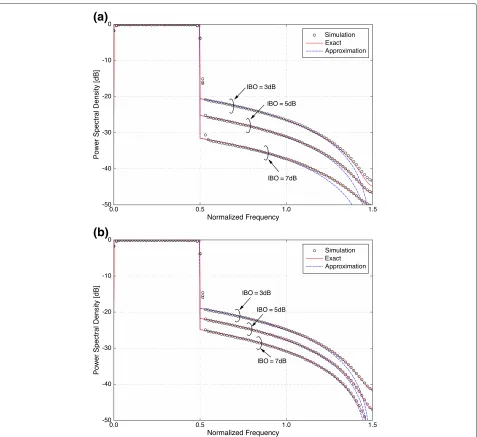
The results for the cases of Rapp (withp = 3.0) and Saleh models are shown in Figure 7a,b, respectively, where we observe the tendencies similar to the soft envelope lim-iter and erf models, respectively. This behavior can be also
(a)
(b)
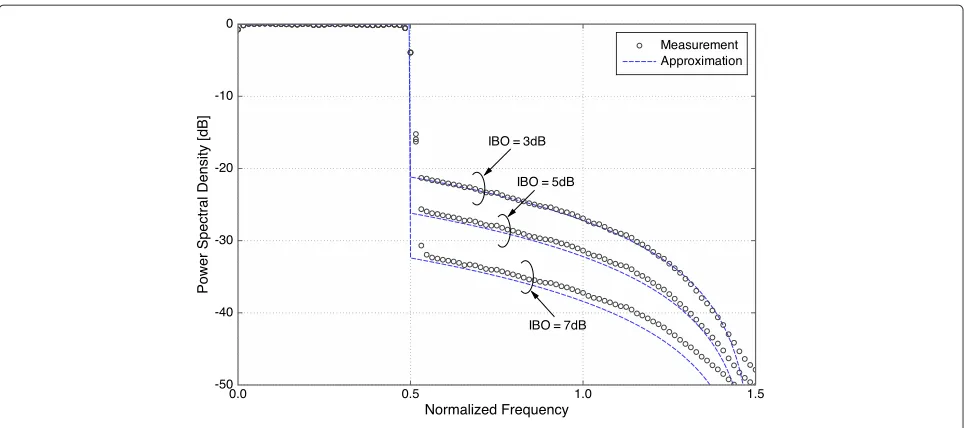
Figure 8PSDs of real PA based on our proposed approximation method.
inferred from the similarity of the AM-AM characteristic curves shown in Figure 1.
In the case of measurement, the approximate PSD is calculated based on the measured cross-correlation coef-ficient using (59). The corresponding theoretical PSD is compared with the measured PSD in Figure 8. We observe that our approximation approach can capture the distor-tion accurately, especially when IBO is relatively small as expected.
5.5.2 Error vector magnitude
The EVMs in the case of soft envelope limiter and erf models are calculated by the simulation and shown in
Figure 9, together with the corresponding theoretical upper bounds.
We observe that both the simulation results and upper bounds well agree, which may justify the accuracy of our proposed analytical approach. It is interesting to observe that when the two curves are compared with the same IBO value, soft envelope limiter has higher EVM value when IBO is lower than 3 dB, even though it rapidly decreases as IBO increases compared to that of the erf model. We note that similar agreement behavior has been also observed for the Rapp and Saleh models.
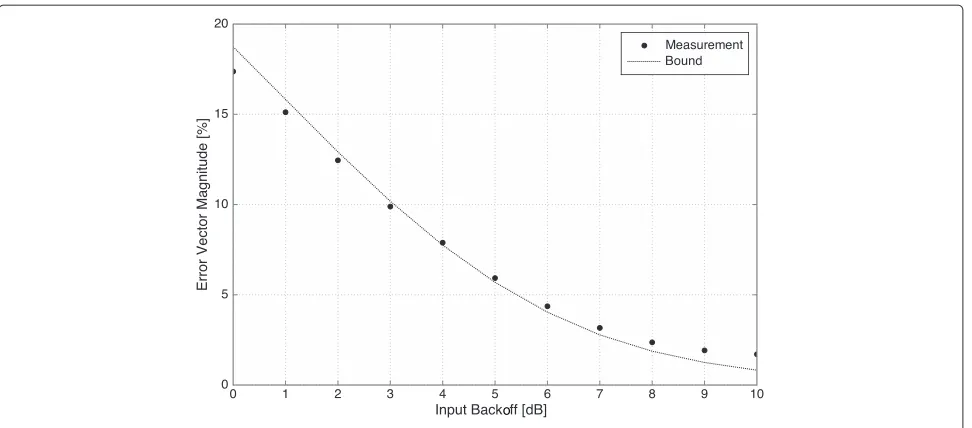
Finally, in Figure 10, the EVM calculated based on the measurement is compared with the corresponding upper
Figure 10EVM results of actual PA.
bound based on the theoretical calculation using mea-sured cross-correlation coefficient. For low-IBO region, good agreement is observed between the measured results and our upper bound as expected. However, we observe some gap when the IBO is high where high SDR is expected. Several reasons can be considered for this behavior. First, since the number of subcarriers consid-ered in this work is not large (N = 256), the assumption of an OFDM signal as a Gaussian process may not be accurate enough.
Second, since the OFDM signals with high peak power occur less frequently than those with low peak power [16], the event that the OFDM signal is affected by nonlinear distortion becomes rare [30], especially in the high-SDR region where the IBO is set high.
Finally, the measured results are affected not only by the nonlinear distortion but also by the additive white Gaussian noise (AWGN) (due to the thermal noise) as well as the quantization noise, where the latter two fac-tors are not taken into consideration in our theoretical calculation.
6 Conclusion
In this work, based on the exact mathematical model, we have first established the relationship between the cross-correlation coefficient of the input and output envelope of the nonlinearly amplified Gaussian signals (or total SDR) and its power spectral density. Based on this result, we have proposed a simple approximate expression for the PSD and EVM of the nonlinearly amplified OFDM signals that can be derived using the cross-correlation coefficient calculated only from the AM-AM and AM-PM characteristics of a PA.
Through computer simulation and actual measurement, the effectiveness and accuracy of our approach have been demonstrated. Even though this approach is theoretically valid only for the Gaussian signals with rectangular spec-tra, which can be approached by the OFDM with a large number of subcarriers, it is expected to offer an approxi-mate solution for other linearly modulated signaling cases. Further investigation may be necessary to investigate the applicability of the proposed approach to other modula-tion formats.
Competing interests
The authors declare that they have no competing interests.
Received: 3 August 2014 Accepted: 4 November 2014 Published: 24 November 2014
References
1. CP Liang, JH Jong, WE Stark, JR East, Nonlinear amplifier effects in communications systems. IEEE Trans. Microw. Theory Tech. 47(8), 1461–1466 (1999)
2. H Ochiai, An analysis of band-limited communication systems from amplifier efficiency and distortion perspective. IEEE Trans. Commun. 61(4), 1460–1472 (2013)
3. W Bosch, G Gatti, Measurement and simulation of memory effects in predistortion linearizers. IEEE Trans. Microw. Theory Tech.
37(12), 1885–1890 (1989)
4. C Rapp, inProceedings of the Second European Conference on Satellite Communications. Effects of HPA-nonlinearity on a 4-DPSK/OFDM-signal for a digital sound broadcasting system (Liége, Belgium, 22–24 Oct 1991), pp. 1–5
5. AAM Saleh, Frequency-independent and frequency-dependent nonlinear models of TWT amplifiers. IEEE Trans. Commun. 29(11), 1715–1720 (1981)
6. Z Yu, R Baxley, GT Zhou, EVM and achievable data rate analysis of clipped OFDM signals in visible light communication. EURASIP J. Wireless Commun. Netw.2012(1), 321 (2012)
8. NY Ermolova, Spectral analysis of nonlinear amplifier based on the complex gain Taylor series expansion. IEEE Commun. Lett.5(12), 465–467 (2001)
9. GT Zhou, R Raich, Spectral analysis of polynomial nonlinearity with applications to RF power amplifiers. EURASIP J. Appl. Signal Process. 2004, 1831–1840 (2004)
10. GT Zhou, Analysis of spectral regrowth of weakly nonlinear power amplifiers. IEEE Commun. Lett.4(11), 357–359 (2000)
11. P Banelli, S Cacopardi, Theoretical analysis and performance of OFDM signals in nonlinear AWGN channels. IEEE Trans. Commun.48(3), 430–441 (2000)
12. HS Kim, B Daneshrad, Power optimized PA clipping for MIMO-OFDM systems. IEEE Trans. Wireless Commun.10(9), 2823–2828 (2011) 13. I Ahmad, AI Sulyman, A Alsanie, AK Alasmari, S Alshebeili, Spectral
broadening effects of high-power amplifiers in MIMO-OFDM relaying channels. EURASIP J. Wireless Commun. Netw.2013(1), 32 (2013) 14. NP Le, F Safaei, LC Tran, Transmit antenna subset selection for high-rate
MIMO-OFDM systems in the presence of nonlinear power amplifiers. EURASIP J. Wireless Commun. Netw.2014(1), 27 (2014)
15. M Sabbaghian, A Sulyman, V Tarokh, inIEEE International Conference on Communications (ICC). Capacity analysis for Gaussian channels with memoryless nonlinear hardware (Budapest, Hungary, 9–13 June 2013), pp. 3403–3407
16. H Ochiai, H Imai, On the distribution of the peak-to-average power ratio in OFDM signals. IEEE Trans. Commun.49(2), 282–289 (2001) 17. S Wei, D Goeckel, PA Kelly, Convergence of the complex envelope of
bandlimited OFDM signals. IEEE Trans. Inform. Theory56(10), 4893–4904 (2010)
18. WA Gardner,Introduction to Random Processes: With Applications to Signals and Systems, (Macmillan, New York, 1986)
19. NM Blachman, The output signals and noise from a nonlinearity with amplitude-dependent phase shift. IEEE Trans. Inform. Theory25(1), 77–79 (1979)
20. H Yoo, F Guilloud, R Pyndiah, Amplitude PDF analysis of OFDM signal using probabilistic PAPR reduction method. EURASIP J. Wireless Commun. Netw.2011(1), 983915 (2011)
21. FW Olver, DW Lozier, RF Boisvert, CW Clark,NIST Handbook of Mathematical Functions. (Cambridge University Press, Cambridge, 2010) 22. HE Rowe, Memoryless nonlinearities with Gaussian inputs: elementary
results. Bell Syst. Tech. J.61(7), 1519–1525 (1982)
23. R Raich, H Qian, GT Zhou, Optimization of SNDR for amplitude-limited nonlinearities. IEEE Trans. Commun.53(11), 1964–1972 (2005)
24. J Galejs, Signal-to-noise ratios in smooth limiters. IRE Trans. Inform. Theory 5(2), 79–85 (1959)
25. H Ochiai, H Imai, Performance analysis of deliberately clipped OFDM signals. IEEE Trans. Commun.50(1), 89–101 (2002)
26. D Dardari, Joint clip and quantization effects characterization in OFDM receivers. IEEE Trans. Circuits Syst. I, Reg. Papers53(8), 1741–1748 (2006) 27. DR Morgan, Finite limiting effects for a band-limited Gaussian random
process with applications to A/D conversion. IEEE Trans. Acoust. Speech Signal Process.36(7), 1011–1016 (1988)
28. AJ Cann, Nonlinearity model with variable knee sharpness. IEEE Trans. Aerosp. Electron. Syst.AES-16(6), 874–877 (1980)
29. AJ Cann, Improved nonlinearity model with variable knee sharpness. IEEE Trans. Aerosp. Electron. Syst.48(4), 3637–3646 (2012) 30. ARS Bahai, M Singh, AJ Goldsmith, BR Saltzberg, A new approach for
evaluating clipping distortion in multicarrier systems. IEEE J. Select. Areas Commun.20(5), 1037–1046 (2002)
doi:10.1186/1687-1499-2014-199
Cite this article as:Lee and Ochiai:Characterization of power spectral density for nonlinearly amplified OFDM signals based on cross-correlation coefficient.EURASIP Journal on Wireless Communications and Networking 20142014:199.
Submit your manuscript to a
journal and benefi t from:
7Convenient online submission 7Rigorous peer review
7Immediate publication on acceptance 7Open access: articles freely available online 7High visibility within the fi eld
7Retaining the copyright to your article