Research Article
DEVELOPMENT AND VALIDATION OF ANALYTICAL METHOD FOR DETERMINATION OF
DONEPEZIL HYDROCHLORIDE IN PURE AND DOSAGE FORMS.
1College of Pharmacy, Gulf Medical University, Ajman, U A E., 2Department of Medicine, Pariyaram Medical College, Kannur, India., 3 Academy of Pharmaceutical Science, Pariyaram Medical College, Kannur, India. Email:[email protected]
Received: 26December 2013, Revised and Accepted: 20 January 2013
ABSTRACT
Objective: To develop and validate a simple, precise and sensitive extractive spectrophotometric method for the assay of Donepezil HCl in pure and pharmaceutical preparations.
Method: It is based on the formation of ion-pair complex between the drug and Bromo cresol purple in phthalate buffer solution. The formed complex was extracted with chloroform and measured at 410 nm.
Results: Beer’s law was obeyed in the range 2-14 μg/ ml with correlation coefficient (n = 6) ≥ 0.9999.The molar absorptivity, Sandell sensitivity, detection and quantification limits were also calculated. The composition of the ion pairs was found 1:1 by Job’s method.
Conclusion: This developed method was validated for accuracy and precision and has been applied successfully for the analysis of Donepezil in pure and in its dosage forms
Keywords: Donepezil, chromophores, spectrophotometry, pharmaceuticals, Bromo cresol purple, ion pair
INTRODUCTION
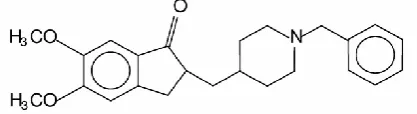
Donepezil hydrochloride is a cholinesterase inhibitor used in the treatment of Alzheimer’s disease. Mainly it is available as its hydrochloride salt. Chemically it is 2-[(1-benzyl-4-piperidyl) methyl]-5, 6-dimethoxy-2, 3-dihydroinden-1-one hydrochloride. (Figure 1). Donepezil HCl is a White to off-white or slightly yellow crystalline powder with a molecular weight of 415.953. It is freely soluble in chloroform, dichloromethane and in methanol, soluble in water, sparingly soluble in ethanol, n-butanol and in acetonitrile and very slightly soluble in acetone [1-3]. As per the literature review, HPLC, HPTLC, LC-MS and few Spectrophotometric methods for the estimation of Donepezil in dosage forms or biological matrix were reported [4-17]. Most of the reported Spectrophotometric methods are cumbersome, time consuming and expensive. Hence the primary objective of the present work is to develop and validate a simple, economic, rapid and accurate ion pair spectrophotometric method for the estimation of Donepezil HCl in its dosage form. [18, 19]
Fig. 1: Structure of Donepezil
MATERIALS AND METHODS
Instrument
Shimadzu UV-Visible double beam Spectrophotometer (Model 1700) was used for spectral studies.
Shimadzu analytical balance is used for weighing.
PH measurements are made with Systronics MKVI Digital PH meter
Materials
Only A R grade reagents and solvents were used. The pure drug Donepezil HCL was obtained from Wokhardt Ltd., Badi, India.
Pharmaceutical Formulation.
Aricep-10mg
Standard solution
Stock Standard Solution: Accurately weighed quantity of Donepezil (100 mg) was dissolved in methanol (10.0 ml) in a volumetric flask (100.0 ml) and the volume was made up to the mark with distilled water. (1000µg/ml)
Standard Solution-A
A 10.0 ml of stock standard solution was diluted to 100.0 ml with distilled water. (Concentration 100 µg/ml).
Phthalate buffer solutions in the pH range 2 – 5 were prepared as follows. To a solution of 1.28 g potassium hydrogen phthalate in 50 ml of water calculated volume of 0.2N HCl was added. Required pH was adjusted using pH meter and then volume was made up to 250 ml with distilled water.
Bromo cresol purple (0.1%) was prepared by dissolving accurately weighed 100 mg of bromo cresol purple in 10 ml methanol and diluted to 100ml with distilled water.
Construction of calibration curves
Calibration curve was constructed by plotting absorbance against concentration. Aliquots of 0.2, 0.4, 0.6, 0.8, 1.0, 1.2 and 1.4ml of standard solution A (100µg/ml) were taken in different separating funnels to which 2 ml of dye and 2 ml of buffer were added. The solutions were mixed well and to it 4ml of chloroform were added. The contents in the separating funnel were shaken for 2 minutes. Chloroform layer were separated and the extraction procedure was repeated with another 4ml of chloroform. The extracts were collected and dried using anhydrous sodium sulphate and made up to 10 ml. Absorbance of the yellow colored organic layer were measured at 410nm against reagent blank prepared similarly. Calibration curve is plotted by taking concentration on X axis and Absorbance on Y axis. Beers plot is given figure 2
Fig. 2: Beers Plot
Procedures for dosage form
Twenty tablets were weighed and finely powdered. A quantity of tablet powder equivalent to 10 mg of Donepezil Hydrochloride was taken in volumetric flask (100 ml) and shaken with methanol (10.0 ml) for 10 minutes and the volume was made up to the mark with distilled water. The solution was then filtered through Whatman filter paper and 1ml of this solution was taken in a separating funnel and mixed with 1.5ml of dye and 2ml of buffer. The solution was then shaken with 4 ml of chloroform for 2 minutes. Organic layer is separated and the extraction was repeated with another 4ml of chloroform and the combined extract was dried using anhydrous sodium sulphate. The volume was adjusted to 10ml with chloroform. Absorbance of the separated yellow colored organic layer was measured at 410 nm against reagent blank prepared similarly to get
test absorbance.
RESULTS AND DISCUSSION
Absorption spectra
The absorption spectra of the ion pair complex formed between Donepezil and Bromo cresol purple was measured in the range 300-600nm against the reagent blank solution. The ion pair complexes showed maximum absorbance at 410 nm. Figure 3
Fig. 3: Absorption Spectrum
Optimum conditions for complex formation
The optimization of the methods was carefully studied to achieve complete reaction formation, highest sensitivity and maximum absorbance. Reaction conditions of the ion-pair complex were found by studying with preliminary experiments such as pH of buffer, type of organic solvent, volumes of the dye, and shaking time for the
extraction of ion-pair complexes.
Selecting of the Extracting Solvents
The effect of several extracting organic solvents on the ion-pair complex was examined. Chloroform, carbon tetrachloride, ethyl acetate, diethyl ether and toluene were tried for effective extraction of the coloured ion pair complex from aqueous phase. Chloroform was found to be the most suitable solvent for extraction of colored complex through double extraction with 4 ml each time, because of its higher efficiency on color intensity, selective extraction of the
ion-pair complex from the aqueous phase, obtained highest absorbance with chloroform and considerably lower extraction ability for the reagent blank.
Effects of PH on the Ion-Pair Formation
The effect of PH was studied by extracting the colored complexes in
the presence of various buffers andthe maximum color intensity and
highest absorbance value were observed in phthalate buffer .The optimum PH was studied by extracting the coloured complex species at different PH using 1 ml buffer. The optimum PH was found at 3.5.Figure 4
Fig. 4: Effect of PH of Phthalate Buffer Solution on the ion pair complex of Donepezil with Bromo Cresol Purple
Effects of Reagents Concentration
The effect of the reagents was studied by measuring the absorbance of solutions containing a fixed concentration of drug and varied amounts of the reagent with 1 ml buffer. Maximum color intensity of
the complex was achieved with 1.5 ml of reagent solution.Figure 5
Fig. 5: Effect of volume of the reagent on the reaction of drug with dye Stoichiometric Ratio.
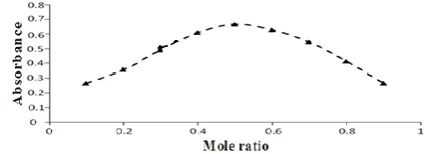
In order to establish the molar ratio between the studied drug and dye, Job’s method [20] of continuous variation of equimolar
solutions (5x10⁻⁵M) was applied. A series of solutions was prepared
in which the total volume of drug and reagent was kept at 10 ml. The absorbance was measured at the optimum wavelength. The molar ratio of the reagents (drug: dye) in the ion-pair complexes was determined and the results indicated that 1:1 (drug: dye) ion-pairs are formed through the electrostatic attraction between positive
protonated DH+ and negative BCP. Figure 6
The proposed method for the estimation of Donepezil was validated as per the ICH guidelines. [21]
Linearity
Linearity of the proposed methods were verified by analyzing seven solutions covering the concentration range of 2-14 μg/ml (2 μg/ml, 4 μg/ml, 6 μg/ml, 8 μg/ml, 10 μg/ml, 12 μg/ml, 14 μg/ml).Good linearity was observed over the above range and the calibration curve was constructed using concentration of the analyte versus absorbance. The linearity of calibration graphs was proved by the high values of the correlation coefficient and the small values of the y-intercepts of the regression equations. The coefficient of correlation from the linear regression analysis was calculated and found to be 0.9999. This indicates that there exists a good linear relationship between concentration of drugs and the absorbances. The data was processed statistically to calculate parameters like correlation coefficient, linearity range, slope etc. The optical characters and analytical data such as absorption maxima, Beers law limit, Correlation Coefficient, Colour Stability, Slope, intercept, Molar absorptivity, Residual standard deviation and Sandells sensitivity
are presented in Table 1.
Table 1: Optical characters and analytical data in the determination of Donepezil by the proposed method
Parameters Theproposed
Method
Wavelengths λ max (nm) 410
Beer’s law limits (μg /ml) 14-Feb
Molar absorptivity ε,(l/mol-1 cm-1) x 104 2.7785x10⁴
Correlation coefficient 0.9999
Intercept 0.00057
Slope 0.0668
Limit of detection LOD(μg /ml) 0.077
Limit of quantification LOQ(μg /ml) 0.2335
Sandells Sensitivity(μg /ml/0.001Abs unit)
0.01506
Residual Standard deviation 0.00156
Linear regression equation Y=0.06680X-0.00057
Extracting solvent Chloroform
PH 3.5
Dye concentration 0.1%W/V
Volume of Dye 1.5
Sensitivity
The detection limit (LOD) for the proposed methods was calculated using the
formula, the detection limit was found to be 0.077mcg/ml.
The limit of quantization, LOQ, is calculated as
LOQ = 10 s / S
According to this equation, the limit of quantization was found to be 0.2335 through Whatman filter paper. 1ml of this solution was mixed with the spiked standard solution and taken in a separating funnel and added 1.5ml of dye and 2ml of buffer. The solutions were mixed well and shaken with 4 ml of chloroform in a separating funnel for 2 minutes. Organic layer is separated and the extraction was repeated with another 4ml of chloroform. Combine the extracts and dried using anhydrous sodium sulphate, adjusted the volume to 10 ml with chloroform. Absorbance of the separated yellow colored organic layer was measured at 408nm against reagent blank prepared similarly.
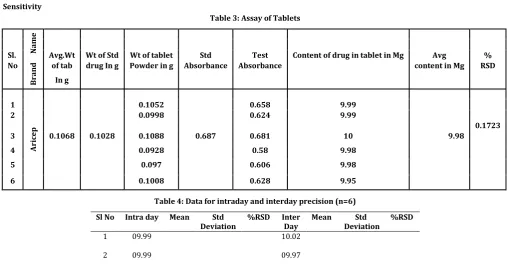
Precision
The precision study of the developed method was done based on the
data obtained from Table 3. Results of six determinations from
same batch were validated statistically and Standard deviation and Co-efficient of variation in% is found to be 0.0172 and 0.1723 respectively. The data for intraday and inter day precision is given in the Table 4
Table 3: Assay of Tablets
Table 4: Data for intraday and interday precision (n=6)
3
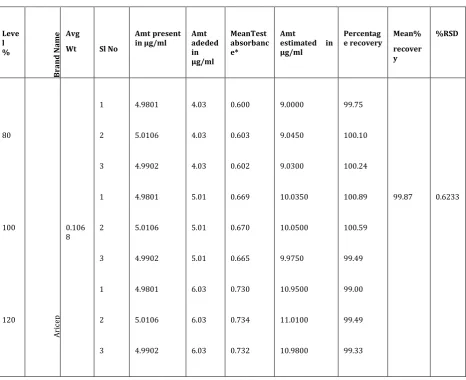
Table 2: Data for recovery studies
* Mean of three observations Mean standard absorbance=0.332* Concentration of standard =4.98µg/ml
Ruggedness
The degree of reproducibility of test results obtained by the methods was checked by analyzing the drug sample by different analysts. To validate and confirm the results, six solutions of drug were prepared
and analysis was carried out. The datas given in Table 5
Table 5: Ruggedness of the proposed method
Parameter Content of drug* Std Deviation %RSD
Analyst 1 9.97
0.028 0.2802
Analyst 2 10.01
* Mean of six observations
Effects of excipients
Effects of common excipients and additives were tested for their possible interferences in the assay of Donepezil by proposed method. It was observed that the excipients such as talc, lactose, starch and magnesium stearate did not interfere with the assay,
since the formation of an ion-pair complex with anionic dyes needs a basic moiety.
Analysis of Pharmaceutical Preparations.
The suggested methods were applied successfully to the determination of Donepezil in formulation. Six replicate determinations were made. The assay results were in a good agreement with the label claims. The Recovery study was carried out
to evaluate the accuracy of the method. Datas given in Table 2 and
Table 3
CONCLUSION
and accuracy. The method showed no interference from excipients and other additives. Hence this method can be used for the routine analysis of Donepezil Hydrochloride in pure and pharmaceutical formulations.
ACKNOWLEDGEMENT
Authors are thankful to Wokhard Pharmaceuticals Ltd., Badi, India
for supply of Donepezil Hydrochloride.
REFERENCES
1. Martindale. The complete Drug Reference. Pharmaceutical
press New York 2002; 32: 1417.
2. Bryson M, Benfield P. Donepezil. New Drug Profile. Drugs
and Aging 1997; 10(3): 234-239.
3. Burns A, Rossor M, Hecker J. Donepezil in the treatment of
Alzheimer’s Disease-Results from a multinational clinical trial. Dement Geriar Cogn Disord 1999; 10:237-44.
4. Lu YH, Wen HM, Li W, Chi YM, Zhang ZX. Determination of
Donepezil in human plasma by HPLC-MS.Yao Xue Xue Bao 2003; 38(3):203-206.
5. Hao XY, Ding L, Li LM, Bian XJ, Zhang SQ. Bioequivalence
of Donepezil capsule and tablet in human. Yao Xue Xue Bao 2003; 38 (5):392-394.
6. Mahasen A Radwan, Heba H Abdine, Bushra T Al-Quadeb,
Hassan Y Aboul-Enein, Kenichiro Nakashima. Stereo selective HPLC assay of Donepezil enantiomers with UV detection and its application to pharmacokinetics in rats. Journal of Chromatography B 2006; 8(3):114–119.
7. Nakashima K, Itoh K, Kono M, Nakashima MN, Wada M.
Determination of Donepezil hydrochloride in human and rat plasma. J Pharm Biomed Anal 2006; 41(1):201-206.
8. SangShetty JN, Mahaparale PR, Paramane S, Shinde DB.
Spectrophotometric Estimation of Donepezil
Hydrochloride in Bulk and Tablet Formulation. Trends in Applied Sciences Research 2008; 3(1):109-112.
9. Tushar G Barot, Patel PK. RP-HPLC Method for the
Estimation of Donepezil Hydrochloride Dosage Form. E-Journal of Chemistry 2009; 6(2):594-600.
10. Jayanna BK, Nagendrappa G, Arun Kumar.
Spectrophotometric determination of Donepezil in tablets. Journal of pharmaceutical and biomedical sciences 2010; 1(1):9-12.
11. Dharmaraj Santhosam S, Kannan S, Lakshmi Devi S.
Development and validation of RP- HPLC method for estimation of Donepezil HCl from bulk and marketed dosage forms. J. Chem. Pharm. Res 2010; 2(6):62-67.
12. Krishna Reddy NV, Phani RS, Ramesh Raju R. RP - HPLC
Method development for analysis and assay Of Donepezil in formulation. An International Journal of Advances in Pharmaceutical Sciences 2010; 1 (1):100-103.
13. Ravi Kumar V, Chaitanya S, Sambasiva Rao A, Sreekiran M.
Estimation of Donepezil hydrochloride by ion complex
extractive spectrometry.International Journal of Research
in Pharmacy and Chemistry 2011; 1(3):512-518.
14. Senthil Kumar T, Solairaj P, Thangathirupathi A. Analytical
method development and validation of Donepezil hydrochloride Tablets by RPHPLC. International Journal of Pharmacy and Pharmaceutical Sciences 2011; 3(3):62-65.
15. Anbarasi B, Prasanth K, Senthil Kumar N. Analytical
Method Development and Validation of Donepezil
Hydrochloride Tablets by RP-HPLC.International Journal
of Pharmacy Technology 2011; 3(2):1988-2000.
16. Chhalotiya UK, Bhatt KK, Shah DA, Nagda CD. Liquid
Chromatographic Method for the estimation of Donepezil
Hydrochloride in a Pharmaceutical Formulation.
International Journal of ChemTech Research 2011;
3(1):112-118.
17. Jagadeeswaran Murugesan, Natesan Gopal, Muruganathan
Gandhimathi. A validated HPTLC method for the determination of Donepezil in bulk and tablet dosage forms.Urasian journal of analytical chemistry 2011; 6(1):201-206.
18. Raghu Babu K,Mohan N,Kalyana Ramu B,Ramdas C,Rao
MN.Development of new visible Spectrophotometric determination of Tiaprofenic acid in Bulk and Formulations. Asian journal of Pharmaceutical and Clinical Research 2013; 6(1):77-79.
19. Shreya Nayak, Sanjay Pai PN.Spectrophotometric
determination of Balofloxacin by ion pair complexation reaction in the bulk and tablet dosage form. Asian Journal of Pharmaceutical and Clinical Research 2013; 6(4):22-24.
20. Job P. Ann. Chim. 1928; 9:113-203.
21. Validation of Analytical Procedures. Methodology.ICH
Harmonised Tripartite Guidelines 1996; 1-8.
22. Christian GD .Analytical Chemistry. John Wiley and sons
2008; 6:113.