CUAJ – Original Research Hesswani et al Risk factors for stone development in ESRD
Identifying risk factors for development of nephrolithiasis in end-stage renal disease patients
Charles Hesswani1; Sameena Iqbal2; Khashayar Rafat Zand3; Simon Sun3; Bernard Unikowsky2;
Caroline Reinhold3; Sero Andonian1
1Department of Urology, McGill University, Montreal, QC, Canada; 2Department of Nephrology, McGill University,
Montreal, QC, Canada; 3Department of Radiology, McGill University, Montreal, QC, Canada
Acknowledgements: This work was supported in part by the Fond de Recherche en Santé du Québec (FRSQ)
Research-Scholar Grant to Dr. Sero Andonian and the Endourological Society Summer Student Research-Scholarship to Charles Hesswani.
Cite as: Can Urol Assoc J 2019 November 29; Epub ahead of print. http://dx.doi.org/10.5489/cuaj.6017
Published online November 29, 2019
***
Abstract
Introduction: We sought to assess the incidence and risk factors for stone development in patients with end-stage renal disease (ESRD) on hemodialysis (HD).
Methods: Medical records of patients receiving HD between 2007 and 2017 were retrospectively reviewed. Patients who had been on HD for at least three months and had imaging studies (computed tomography [CT] scans or ultrasound [US]) pre- and post-initiation of HD were included. Exclusion criterion was presence of stones pre-HD. De novostones were defined as renal stones found on followup imaging. Demographics, laboratory data, comorbidities, and dialysis characteristics were compared between non-stone-formers and stone-formers using propensity score matching.
Results: A total of 133 patients met the inclusion criteria. Their median age was 68.5 years, median body mass index 28.7 kg/m2, and median dialysis duration 59.5 months. After HD, 14 (10.5%) patients
developed de novo stones and their median dialysis-to-stone duration was 23.5 months. When compared with non-stone-formers, stone-formers had significantly lower incidence of hypertension (48.2% vs. 14.3%; p=0.03), lower serum ionized calcium (1.16 vs. 1.07 mmol/L; p=0.01) and magnesium (0.95 vs. 0.81 mmol/L; p=0.01), and significantly higher serum uric acid (281.5 vs. 319.0 mol/L; p=0.03). Multivariate analysis demonstrated that lower serum ionized calcium (adjusted odds ratio [OR] 0.00001; 95% confidence interval [CI] 0–0.18) and magnesium (adjusted OR 0.0003; 95% CI 0–0.59) were significantly associated with stone formation.
CUAJ – Original Research Hesswani et al Risk factors for stone development in ESRD
Introduction
Nephrolithiasis is an increasingly prevalent disease and is a major cause of morbidity in the working-age population.1 Its estimated prevalence is 10.6% in men and 7.1% in women.1 Risk factors for
nephrolithiasis in the general population include dehydration, hypercalciuria, hypernatriuria,
hyperuricosuria, hyperoxaluria, hypocitaturia and hypomagnesuria.2,3 While incidence and risk factors
for nephrolithiasis are well studied in patients with normal renal function, there is paucity of literature regarding the incidence and risk factors for de novo nephrolithiasis in patients with End Stage Renal
Disease (ESRD) on hemodialysis (HD). It is a common belief that patients with ESRD do not form renal stones due to their oliguric or anuric state [expert opinion].4 However, two studies have shown that the
incidence of de novo nephrolithiasis in patients on chronic HD is between 5-13%, similar to non-ESRD
population.1,5 Unfortunately, nephrolithiasis is underdiagnosed in ESRD patients presenting with renal
colic.4 Stone formation and composition in patients with ESRD are thought to be different than those
formed in non-ESRD patients.6,7 Therefore, stone development in patients with ESRD on HD may be
associated with risk factors different than those involved in stone formation in non-ESRD patients.8,9
However, there is no literature regarding risk factors for de novo nephrolithiasis in this population.
Therefore, the aim of the present study was to assess the incidence and risk factors for de novo
nephrolithiasis in patients with ESRD on hemodialysis.
Methods
After obtaining institutional ethics board approval, electronic records of all patients with ESRD undergoing hemodialysis between 2007 and 2017 at two tertiary care centers were reviewed. Data collected included: age at the start of dialysis, sex, body mass index (BMI), history of nephrolithiasis, dialysis duration, cystic kidney disease, hypertension, diabetes mellitus (DM), gout, sleep apnea, and history of bowel resection. The dialysis duration was defined from the initiation of dialysis until the last imaging study performed while actively on dialysis. Past medical and surgical history and list of
medications were recorded. Serum studies included electrolytes, parathyroid hormone levels, hematocrit, glycated hemoglobin, uric acid, calcifediol, calcitriol, and creatinine. The blood work was drawn in the first week of the month the subject was diagnosed with the renal stone. They were drawn at the initiation of the hemodialysis treatment. No stone analyses were performed and only 2 patients had 24-hour urine collections; therefore, no statistical analysis were obtained for these variables.
Inclusion criteria were ESRD, chronic HD for at least 3 months, available imaging studies (ultrasound or CT scans) at a minimum 1 year before and at least 3 months after HD. Patients on peritoneal dialysis were excluded given the paucity of data regarding stone formation in this population as well as a potentially different mechanisms for stone formation when compared to patients on HD. Exclusion criteria were acute HD (less than 3 months and results in renal recovery), known
CUAJ – Original Research Hesswani et al Risk factors for stone development in ESRD
a discrepancy between the two radiologists, then a third radiologist read the CT images. Given that ultrasound imaging is highly technician dependent, images were not reviewed. However, all ultrasound examinations were performed by a select cohort of centralized radiologists within the same institution. Consensus was achieved for CT scans in all cases. Data collected were presence of nephrolithiasis (>3mm), Randall’s plaques (<3mm), vascular calcifications, in addition to size (mm) and stone density
on CT scans (Hounsfield Units, HU). For each stone, stone densities in HU were measured using both the largest oval shape tool and free-hand region-of-interest tool to avoid the grey pixels in the soft-tissue window (W/L=350/40). Mean, median and standard deviation (SD) of stone densities were calculated. For ultrasound, the presence or absence of stones in the radiology report was recorded. Acoustic shadowing, twinkle artifact and size > 3 mm were generally used to diagnose stones on ultrasound. De novo stones were defined as symptomatic or asymptomatic renal stones found on
imaging after at least 3 months of HD, with prior imaging that is negative for nephrolithiasis.
Statistical analysis
Descriptive data were summarized using proportions, means with standard deviation and medians with ranges as appropriate. Student t, Kruskal-Wallis and Fisher’s exact tests were used to compare
categorical and continuous variables between stone formers and non-stone formers ESRD HD patients. Propensity score matching was calculated using a binary logistic regression analysis to match stone formers and non-stone formers based on age, gender, comorbidities and duration of dialysis. Stone formers and non-stone formers were matched in a 1:4 ratio, respectively. A multivariate model was generated using variables that had p-value less than 0.25 on univariate analyses, applying Poisson regression.10 All data analysis was performed using SAS 9.4 software (Cary, NC: SAS Institute Inc.).
CUAJ – Original Research Hesswani et al Risk factors for stone development in ESRD
Results
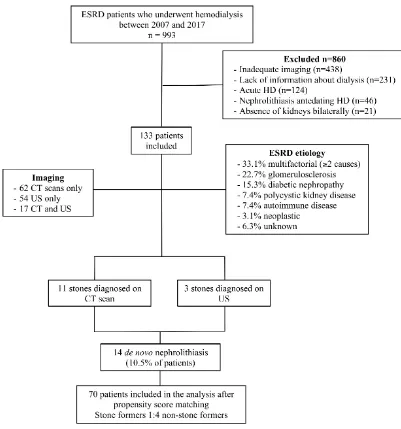
Out of 993 patients reviewed, 133 patients met the inclusion criteria and were included in the study (Figure 1). The median age was 67.5 (range: 26-89) years and the median BMI was 28.7 (range: 16-52) kg/m2. Females comprised 48.6% of patients. The median HD duration was 59.5 (range: 7-201) months.
Comorbidities present included hypertension in 41.4%, DM in 52.9%, gout in 4.3%, obstructive sleep apnea in 18.6%, and previous bowel resection in 12.9% (Table 1). The etiology for the development of ESRD was multifactorial in 44 (33.1%) patients, diabetes in 20 (15.3%) patients, hypertension in 31 (22.7%) patients, polycystic kidney disease in 10 (7.4%) patients, autoimmune disease in 10 (7.4%) patients, neoplasm in 5 (3.1%) patients, syndromic/congenital in 2 (1.5%) patients and unknown in 8 (6.3%) patients (Figure 1).
Fourteen patients (10.5%) (1.99 patients per 1000 person-months on HD) developed de novo
nephrolithiasis (11 on CT scans and 3 on US imaging), with median dialysis-to-stone duration of 23.5 (range: 7-99) months (Table 1, Figure 1). None of these 14 imaging tests were performed in order to diagnose renal stones. Median stone size and density on CT were 4.2 mm (range: 2.7-12.0) and 260.7 HU (range: 140.7-555.3) (Table 1). The time from pre-HD imaging to initiation of HD was not
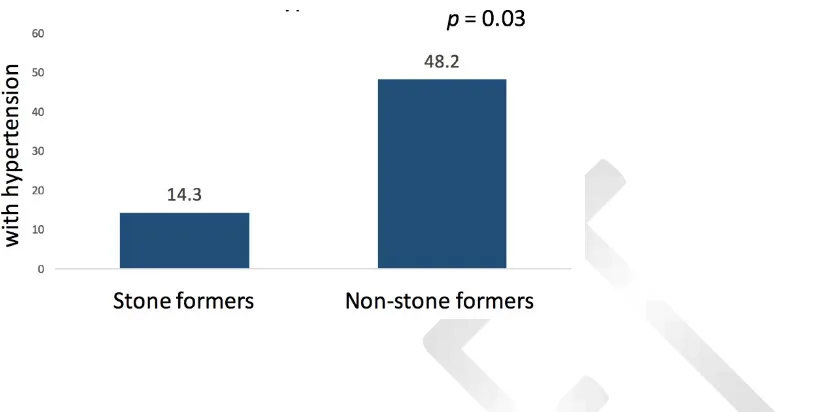
statistically significant between the CT scan and US groups (Table 1). When compared with non-stone formers, de novo stone formers had significantly lower incidence of hypertension (48.2% vs 14.3%; p=0.03) (Table 1 and Figure 2). There were no significant differences for diabetes, bowel resection,
steatohepatitis, gout, sleep apnea and polycystic kidney disease between stone formers and non-stone formers (p > 0.05) (Table 1). Dialysis duration was significantly longer in the stone-former group
compared with the non-stone former group (60.5 vs. 59.5 months, p = 0.003) (Table 1).
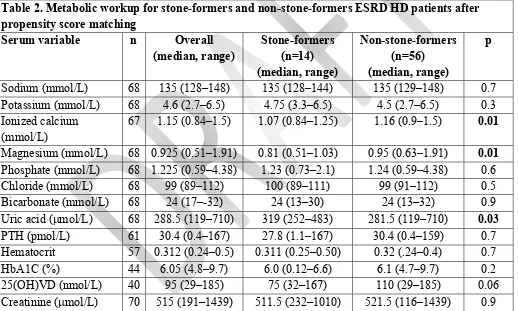
When compared with non-stone formers, de novo stone-formers had significantly lower serum
ionized calcium levels (1.16 vs. 1.07 mmol/L, p = 0.01) and magnesium levels (0.95 vs. 0.81 mmol/L, p
= 0.01), and significantly higher serum uric acid levels (281.5 vs. 319.0 mol/L, p = 0.03) (Table 2).
However, no significant differences were observed for the rest of the variables (p > 0.05) (Table 2).
On multivariate logistic regression model using Poisson distribution, serum ionized calcium (OR 0.0001; 95% CI: 0-0.18; p = 0.01), magnesium (OR 0.0003; 95% CI: 0-0.59; p = 0.03) and HbA1c
levels (OR 0.4845; 95% CI: 0.271-0.867; p = 0.01) were all independent predictors of stone formation
(Table 3). Dialysis vintage (year of starting dialysis) was not significant factor on the multivariate model (Table 3).
Discussion
The incidence of de novo nephrolithiasis in ESRD patients on HD was found to be 10.5%. This
translates to 1.99 patients per 1000 person-months on HD. Therefore, the incidence of de novo
nephrolithiasis in ESRD patients on HD is similar to the incidence of nephrolithiasis in the general population of 10.6% in men and 7.1% in women.1,11 While not statistically significant, a higher
CUAJ – Original Research Hesswani et al Risk factors for stone development in ESRD
demonstrating incidence of de novo nephrolithiasis in patients on chronic HD to be between 5-13%.5,1
While non-ESRD patients most commonly present with calcium oxalate stones, ESRD patients on chronic HD more commonly form matrix stones.12 This different stone composition suggests that stone
formation in ESRD HD patients develops via a different mechanism therefore different risk factors may be involved in stone formation in this particular population.6-9 Suggested risk factors for matrix stones
formation are low urine output, hyperuricemia, ß2 microglobulin, high Tamm Horsfall protein content and duration of dialysis.12,13 Other risk factors include recurrent infections, high BMI, proteinuria and
previous history of glomerulonephritis.12 The median stone density in the present study was 228.5 HU
(range: 131.5-565.6). Low-density (<500 HU) stones on CT scans may represent uric acid stones or protein-matrix stones, a difference that can only be established through stone analysis. None of the patients in the current study suffered from renal colic and therefore they did not require surgical intervention leading to stone extraction and analysis.
Initiation of hemodialysis to de novo nephrolithiasis was 23.5 months. Since loss of urine
production (anuria) typically develops within 2 years post-initiation of HD, it is likely that these stones are being formed while these ESRD patients are still producing urine.14 In addition, stone-formers were
significantly longer on hemodialysis when compared with non-stone-formers (60.5 vs 59.5 months; p =
0.003) (Table 1). Although not clinically significant, one possible explanation is that stone-formers may have started HD earlier while still producing urine. Also, longer dialysis duration is associated with loss of residual renal function and higher ß2 microglobulin levels both of which may be contributing to stone formation.12
Several comorbidities, such as gout or diabetes mellitus, were previously shown to be
independent risk factors for stone formation in the general population.15 The current study is the first to
demonstrate that hypertensive ESRD HD patients formed less stones than their non-hypertensive counterparts. Only 14.3% of stone formers were hypertensive compared to 48.2% of non-stone formers patients (p = 0.03) (Figure 2). A possible rationale may be that the absence of hypertension correlates
with the persistence of urine production, which may be a prerequisite for stone formation. Also, hypertensive patients typically undergo increased ultrafiltration, which may expedite the onset of anuria.16 As previously noted, the mean time from the start of dialysis to stone formation (23.5 months)
is typically the same period of time associated with the development of anuria in HD patients. In addition, lower magnesium levels in stone formers may also reflect better residual renal function as underscored by the persistence of urine output (p= 0.01) (Table 2). Although one might have expected
lower uric acid levels in patients with better residual renal function, it is possible that greater urea clearance led to an improved appetite, hence more food derived uric acid production (Table 2). The absence of hypertension in stone-former ESRD HD patients differ from the findings of previous studies performed in a non-dialysis population, in whom hypertension and de novo stone formation were
associated.17 Such difference between the two populations further suggests that different risk factors for
CUAJ – Original Research Hesswani et al Risk factors for stone development in ESRD
Stone formers were found to have significantly lower serum ionized calcium levels than non-stone formers (p= 0.01), likely secondary to decreased 1,25(OH)VD levels (Table 2). Several
medications and supplements, such as furosemide and calcitriol supplementation, alter calcium homeostasis and may play a role in stone formation.18 However, no significant difference in de novo
stone formation was observed for patients on furosemide or calcitriol supplements (p>0.05) (Table 1).
On multivariate regression model using Poisson distribution, ionized calcium levels remained significant (adjusted OR 0.0001; 95% CI: 0-0.18) (Table 3). Additionally, stone formers were found to have
significantly lower serum magnesium levels (p= 0.01) (Table 3). Magnesium is a known inhibitor of
stone formation, and its decreased levels found in the stone-former population are consistent with prior studies performed on the non-ESRD population.19 Also, lower serum magnesium has been associated
with some degree of parathyroid hormone resistance which may have further contributed to the lower calcium levels found in stone formers (p= 0.01) (Table 2).20 On multivariate analysis, magnesium level
remained significant (adjusted OR 0.00003; 95% CI: 0-0.59), confirming the significance of the univariate analysis (Table 3). Therefore, lower serum magnesium levels may represent one of the risk factors for nephrolithiasis that is shared between the ESRD HD population and the general population. Finally, although HbA1c levels were not found to be significantly different between the two groups on univariate analysis, the multivariate model showed a significant inverse correlation between HbA1c levels and stone formation (adjusted OR 0.485; 95% CI: 0.271-0.867) (Table 3). Low HbA1c level is a known contributor to frailty status, which in turn is associated with higher inflammatory parameters.21,22
Inflammation may be a precursor for stone formation as recently shown by the presence of inflammatory cytokines in the papillary tips of stone-formers.23
Higher serum uric acid levels are associated with increased stone formation in a dose-response manner in the general population.24 In the present study, serum uric acid levels were significantly higher
in the stone formers compared to non-stone formers (p = 0.03) (Table 2). These findings differ from the
results of a study by Stankus et al. in which stone former dialysis patients had similar serum uric acid levels compared to non-stone formers (6.9 vs. 6.2 mg/L, p > 0.05).8 However, that study relied on
patient questionnaires rather than review of imaging studies that was performed in the present study. In addition, the Stankus et al study included only patients of African-American decent whereas the current study includes patients from all races. Given that hyperuricemia is an independent risk factors for all-cause mortality in ESRD patients, many patients undergoing dialysis are also prescribed uric-acid lowering medications.24 Allopurinol is the mainstay for serum and urine urate-lowering therapy. In the
current study, no significant difference in de novo stone formation was observed between patients on
and off allopurinol (p>0.05) (Table 1).
Out of the 14 stone formers, 11 were diagnosed on CT scans and 3 on US imaging (Figure 1). When reviewing the initial CT reports prior to the review of CT scan images by the two radiologists, only 6 out of 11 reports mentioned renal stones, and two reported vascular calcifications. This
CUAJ – Original Research Hesswani et al Risk factors for stone development in ESRD
US reports reported the presence of a renal stones. Interestingly, 2 out of 9 specifically mention the absence of stones, 3 mention vascular calcifications and 3 do not mention either stone or calcification. Our results are consistent with the results of Fowler et al. which demonstrated decreased sensitivity of US for the diagnosis of renal stones when compared with CT scans.25 When compared to the general
population, dialysis patients have a higher abdominal and subcutaneous fat content as well as atrophic kidneys, therefore further limiting the sensitivity of ultrasound. Additionally, the current study
demonstrates that the diagnosis of renal stones in ESRD HD is often missed on CT scans. Possible explanations include renal stones being lower on the differential diagnosis for abdominal or flank pain in this population, or stones being mistaken to vascular calcifications in atrophic and highly calcified kidneys.
Our retrospective study includes several inherent limitations. Although recruiting all ESRD patient on HD over a decade from two tertiary care centers, the sample size was relatively small. However, this relatively small sample size was good enough to validate the statistical outcomes using propensity score matching. Another limitation is the lack of stone analyses and 24-hour urine
collections. However, ESRD patients on HD are often oliguric/anuric and urinary collections are often unreliable. In addition, none of the stone-formers had passed the stones for analysis. Finally, dietary restrictions were not controlled for and may have influenced stone composition. However, ESRD patients on HD follow renal diet with fluid restriction. Nevertheless, this was the first study to assess incidence and risk factors for de novo nephrolithiasis in ESRD patients on HD with review of available
CT images by two radiologists. The strict inclusion and exclusion criteria as well as the long follow-up period post dialysis (median dialysis duration 59.5 months) constitute strengths of the study. In addition, systematic review of all CT scans was performed by two radiologists using pre-determined criteria to identify de novo nephrolithiasis rather than relying on reports of imaging studies or patient
questionnaires. Further prospective studies need to include 24-hour urine collections.
Conclusions
The current study is the first to objectively demonstrate that the incidence of de novo renal stones in the ESRD population is similar to that in the general healthy population. By reviewing images of CT scans, the incidence of de novo nephrolithiasis in ESRD patients on HD was 10.5%. Increased serum uric acid,
CUAJ – Original Research Hesswani et al Risk factors for stone development in ESRD
References
1. Scales CD, Smith AC, Hanley JM, et al. Prevalence of kidney stones in the United States.
European urology 2012; 62:160-65.
2. Romero V, Akpinar H, Assimos DG. Kidney stones: a global picture of prevalence, incidence, and associated risk factors. Rev Urol 2010; 12(2-3):86-96.
3. Sakhaee K, Maalouf NM, Sinnott B. Kidney stones 2012: pathogenesis, diagnosis, and management. The Journal of Clinical Endocrinology & Metabolism 2012; 97:1847-60.
4. Koulouri O, Jones S, Beable R, et al. Renal colic in a dialysis patient: a case of renal stone disease. JRSM short reports 2011; 2(7):57.
5. Viterbo R, Mydlo JH. Incidence and management of dialysis patients with renal calculi.
Urologia internationalis 2002; 69(4):306-8.
6. Ozasa H, Ota K. Mechanism of Kidney Stone Formation in Chronic Hemodialysis Patients.
Nephron 1991; 58(2):242-3.
7. Bani-Hani AH, Segura JW, Leroy AJ. Urinary matrix calculi: our experience at a single institution. The Journal of urology 2005; 173(1):120-3.
8. Stankus N, Worcester E, Hammes M, et al. Evidence against a contribution of conventional urine risk factors to de novo ESRD renal stones. Nephrology Dialysis Transplantation 2006;
21(3):701-6.
9. Aggarwal S, Tandon C, Forouzandeh M, et al. Role of a protein inhibitor isolated from human renal stone matrix in urolithiasis. Indian Journal of Biochemistry and Biophysics 2005;
42(2):113-7.
10. Bendal RB, Afifi AA. Comparison of stopping rules in forward regression. Journal of the American Statistical Association 1977; 72:46-53.
11. Parmar MS. Kidney stones. Bmj 2004; 328(7453):1420-4.
12. Bommer J, Ritz E, Tschöpe W, et al. Urinary matrix calculi consisting of microfibrillar protein in patients on maintenance hemodialysis. Kidney international 1979; 16(6):722-728.
13. Ozasa H, Suzuki T, Takahashi K, et al. Protein components of amyloid-like kidney stones of chronic hemodialysis patients. Nephron 1989; 53(3):257-60.
14. Kjaergaard KD, Jensen JD, Peters CD, et al. Preserving residual renal function in dialysis patients: an update on evidence to assist clinical decision making. Nephrology Dialysis Transplantation Plus 2011; 4(4), 225-30.
15. Curhan GC. Epidemiology of stone disease. Urologic Clinics of North America 2007;
34(3):287-93.
16. Grekas D, Bamichas G, Bacharaki D, et al. Hypertension in chronic hemodialysis patients: current view on pathophysiology and treatment. Clinical nephrology 2000; 53(3):164-68.
17. Cappuccio FP, Blackwood A, Sagnella GA, et al. Association between extracellular volume expansion and urinary calcium excretion in normal humans. J Hypertens 1993; 11:S196-7.
18. Hesswani C, Noureldin YA, Elkoushy MA, et al. Combined vitamin D and calcium
supplementation in vitamin D inadequate patients with urolithiasis: Impact on hypercalciuria and de novo stone formation. CUAJ 2015; 9(11-12):403.
CUAJ – Original Research Hesswani et al Risk factors for stone development in ESRD
20. Rude RK, Oldham SB, Singer FR. Functional hypoparathyroidism and parathyroid hormone end‐organ resistance in human magnesium deficiency. Clinical endocrinology 1976:
5(3):209-24.
21. Yanagita I, Fujihara Y, Eda T, et al. Low HbA1c level is associated with severity of frailty in Japanese elderly diabetic patients. Journal of diabetes investigation 2017. 9(2):419-25.
22. Soysal P, Stubbs B, Lucato P, et al. Inflammation and frailty in the elderly: A systematic review and meta-analysis. Ageing research reviews 2016; 31:1-8.
23. Sun AY, Hinck B, Cohen BR, et al. Inflammatory Cytokines in the Papillary Tips and Urine of Nephrolithiasis Patients. J Endourol 2018; 32(3):236-44.
24. Kim S, Chang Y, Yun KE, et al. Development of nephrolithiasis in asymptomatic
hyperuricemia: a cohort study. American Journal of Kidney Diseases 2017; 70.2:173-81.
CUAJ – Original Research Hesswani et al Risk factors for stone development in ESRD
Figures and Tables
CUAJ – Original Research Hesswani et al Risk factors for stone development in ESRD
Fig. 2. Percentage of stone-formers and non-stone-formers with hypertension.
Table 1. Baseline characteristics for patients included in the study after propensity score matching
Parameter Overall Stone formers
(n=14)
Non-stone formers (n=56)
p Age, median (range) years 68.5 (26–89) 71.5 (33–84) 67 (26–89) 0.9 Female, number (percentage) 34 (48.6) 8 (57.1) 26 (37.1) 0.4 Weight, median (range) kg 81 (50–155) 86 (56–128) 79 (50–155) 0.3 Height, median (range) m 1.69 (1.47–1.89) 1.69 (1.52–1.86) 1.69 (1.47–1.89) 0.6 BMI, median (range) kg/m2 28.7 (16–52) 30.1 (17.0–51.9) 28.2 (16.0–43.4) 0.3
CUAJ – Original Research Hesswani et al Risk factors for stone development in ESRD
BMI: body mass index; CT: computed tomography; HD: hemodialysis; NA: not applicable; US: ultrasound; VD: vitamin D.
Table 2. Metabolic workup for stone-formers and non-stone-formers ESRD HD patients after propensity score matching
Serum variable n Overall
(median, range)
CUAJ – Original Research Hesswani et al Risk factors for stone development in ESRD
Table 3. Multivariate logistic regression model with Poisson distribution, n= 67
Variable Unadjusted OR p Adjusted p
Ionized calcium 0.005 (0.0001–0.45) 0.02 0.0001 (0–0.18) 0.01
Magnesium 0.02 (0.001–0.47) 0.02 0.0003 (0–0.59) 0.03
HbA1c 0.72 (0.53–0.99) 0.04 0.4845 (0.271–0.867) 0.01