Velocity structure in the crust beneath the Kyushu area
Atsushi Saiga1, Satoshi Matsumoto2, Kenji Uehira2, Takeshi Matsushima2, and Hiroshi Shimizu2 1Earthquake Research Institute, University of Tokyo, Yayoi 1-1-1, Bunkyo-ku, Tokyo 113-0032, Japan
2Institute of Seismology and Volcanology, Kyushu University, Shin’yama 2-5643-29, Shimabara, Nagasaki 855-0843, Japan (Received August 5, 2009; Revised January 11, 2010; Accepted February 13, 2010; Online published July 9, 2010)
We present high-resolution three-dimensional tomographic images of the crust beneath the entire Kyushu arc, and particularly the western portion. Our results reveal a velocity anomaly that correlates well with an upper crustal gravity anomaly. Signi cant low-velocity anomalies exist beneath the Miyazaki plane and along the Beppu-Shimabara Graben. Another extensive low-velocity region near the bottom of the crust is located just below the volcanic front and between active volcanoes. The low-velocity anomalies exhibit lowVp andVp/Vs characteristics, and the spatial relationship between these anomalies, the Bouguer gravity anomaly, and the Moho suggests that low-density material at the base of the crust is responsible for both the seismic and gravity signatures. We interpret this material to constitute a relict ridge subducting below the Kyushu Mountains.
Key words:Tomography, seismic velocity, Kyushu, Beppu-Shimabara Graben, Kyushu Mountains.
1.
Introduction
The island of Kyushu is located at the junction of
the Southwest Japan arc and Ryukyu arc. The Kyushu
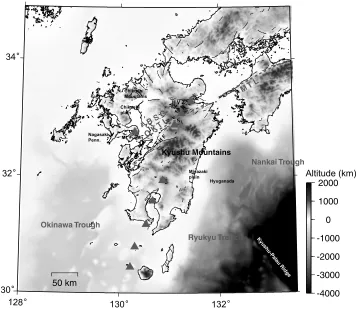
subduction zone involves subduction of the Philippine Sea (PHS) plate beneath the Eurasian plate along the Nankai Trough and Ryukyu Trench (Fig. 1). The angle of subduction varies from oblique to orthogonal between the Nankai Trough/Southwest Japan arc and the Ryukyu
Trench/Ryukyu arc. The Okinawa Trough is a backarc
basin formed by extension within the continental litho-sphere behind the Ryukyu trench. On the island of Kyushu, there exists a major tectonic structure, known as the Beppu-Shimabara Graben (Matsumoto, 1979), along the northeast-ern continuation of the Okinawa Trough.
Whereas in most of Japan the stress patterns can be sat-isfactorily explained in terms of simple plate interactions or crust/slab structural variations (Seno, 1999), the stress eld in Kyushu appears to be more complex, with horizon-tal stress gradients in both the E-W and N-S directions. The stress elds show tensional feature in Kyushu. In northern Kyushu, the orientation of the most compressive principal stress axis varies from E-W in the east to up-down in the west, while the axis of least compressive stress aligns N-S in both areas (Hatanaka and N-Shimazaki, 1988; N-Shimizu
et al., 1993). These factors result in strike-slip faulting in the east and normal faulting in the west. In southern Kyushu, the axis of least compressive stress rotates from N-S to NW-SE. Seno (1999) proposed that the stress eld represents viscous drag exerted by lateral mantle ow as-sociated with upwelling in the East China Sea. In a more detailed regional study, Takayama and Yoshida (2007)
doc-Copyright cThe Society of Geomagnetism and Earth, Planetary and Space Sci-ences (SGEPSS); The Seismological Society of Japan; The Volcanological Society of Japan; The Geodetic Society of Japan; The Japanese Society for Planetary Sci-ences; TERRAPUB.
doi:10.5047/eps.2010.02.003
umented a southward extensional displacement eld in and to the south of the Beppu-Shimabara Graben in western Kyushu and a southeastward extensional eld in southern Kyushu. They suggested, like Seno (1999), that southern Kyushu is being dragged at the base of the crust by ow in the mantle in response to both the uprising of hot material in the Okinawa Trough and retreat of the trench where the Philippine Sea plate subducts. Handaet al.(1992), Handa (1998), and Shimoizumiet al.(1997) documented an elec-trically highly conductive layer at 50–100 km depth beneath the East China Sea, which they inferred to represent either partial melting or the presence of water. These studies did not address in detail the structure of the crust and uppermost mantle, which we focused on in this study to elucidate the tectonics of Kyushu.
Three dimensional (3D) velocity structures in and around Kyushu have been obtained in several previous
stud-ies, which we brie y summarize here. Honda and
Nakanishi (2003) and Wang and Zhao (2006) published high-resolution tomographic images of the subducting PHS plate, mantle wedge, and volcanic front beneath eastern Kyushu. Taharaet al.(2008) described in detail a structure in the offshore region, especially around the Hyuganada region where the Kyushu-Palau ridge subducts. They de-tected a low-velocity zone corresponding to the Kyushu-Palau ridge in and around the subducting PHS plate and suggested that buoyancy due to the subducted ridge plays a role in crustal uplift in the Miyazaki Plain and steep bend-ing of the subductbend-ing slab. Sadeghiet al.(2000) obtained tomographic images beneath western Kyushu, and docu-mented the existence of a low-velocity zone related to the inferred upwelling mantle near the northeastern edge of the extending Okinawa Trough. Nakamura et al. (2003) obtained more detailed structure images of the Okinawa Trough and described a low-velocity zone with highVp/Vs extending along the Okinawa Trough at a depth of
Fig. 1. Index map of Kyushu. Triangles indicate active volcanoes. Thin lines mark active faults, and thick dashed lines mark tectonic lines. FHF, MTL, OKTL and BSG denote the Futagawa-Hinagu Fault, Median Tectonic Line, Oita-Kumamoto Tectonic Line, and Beppu-Shimabara Graben, respectively. HVZ denotes the Hohi Volcanic Zone.
mately 50 km. They suggested that hot mantle material flow ascends from depths greater than 50 km along the length of the trough.
Oda and Ushio (2007) reported on two-dimensional vari-ations in the depth of the Moho discontinuities beneath Kyushu. The Moho is shallow underneath the western part of the region and relatively deep further east. This gross structural trend is compatible with the observed Bouguer gravity anomaly, which is positive in western Kyushu and negative in eastern Kyushu. Oda and Ushio (2007) sug-gested that the shallow Moho and the low velocity zone es-timated by Sadeghiet al.(2000) reflects lower crustal ero-sion associated with a small-scale mantle upwelling in the Okinawa Trough and that the deeper Moho corresponds to the oceanic Moho of the subducting Kyushu-Palau ridge.
Few previous studies have addressed the velocity struc-ture of the crust in western Kyushu with high resolution. Knowing the velocity structure is crucial to interpreting the tectonics of the Okinawa Trough and the Beppu-Shimabara Graben, the northern edge of the trough. Here we report our investigation of the 3D velocity structure around the Is-land of Kyushu and the Beppu-Shimabara Graben in order to clarify the tectonics of the edge of the Okinawa Trough.
2.
Data and Method
We use a large number of P- and S-wave arrival time data points from 2128 earthquakes observed at 182 seis-mic stations to perform seisseis-mic velocity tomography be-neath the Kyushu region. We select only those events with
magnitudes larger than 3.0 and more than 20 arrival time observations west of E129◦, and with magnitudes larger than 1.8 and more than 20 arrival time observations east of E129◦ (Fig. 2). The locations of the seismic stations used in the analysis were selected in order to focus specif-ically on the area near Unzen and the western edge of the Beppu-Shimabara Graben. We use phase data from stations in the western part of the target area. Most of the stations are operated by the High-Sensitivity Seismic Network (Hi-net), the Japanese Universities, or the Japan Meteorological Agency (JMA) (Fig. 3), but we also include data from a further eight seismic stations surrounding Unzen volcano, nine seismic stations in central Kyushu, and eight seismic stations in northwestern Kyushu, all of which are operated by Kyushu University. In total, our selection criteria result in 71,462P-wave arrivals and 46,465S-wave arrivals. We estimate the picking accuracies of the data to be 0.015 s and 0.039 s for the P- and S-wave data, respectively. Pairs of earthquakes within 15 km of each other are used to define travel time differences, yielding 57,695 arrivals for theP -wave data and 32,197 arrivals for theS-wave data. The ab-solute arrival time observations and relative arrival time val-ues are amalgamated in the inversion calculation and then weighted according to their estimated accuracies.
N
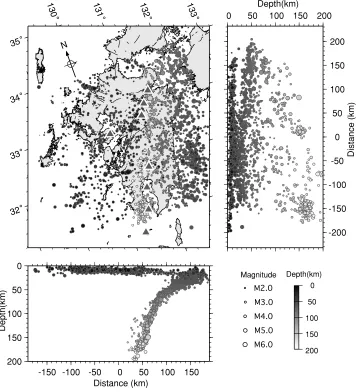
Fig. 2. Hypocenter distribution of the 2128 earthquakes used in this study. Right and lower figures show cross-sections of the hypocenter in the north-south and east-west directions, respectively. In each panel, magnitude is represented by circle size, and depth by color (light colors correspond to deeper earthquakes). Triangles mark active volcanoes.
method enables us to jointly determine hypocenter loca-tions and the 3D velocity structure using absolute and rela-tive event locations. The pseudobending (PB) ray-tracing algorithm (Um and Thurber, 1987) is employed to iden-tify rays and calculate travel times between events and sta-tions. We represent the velocity model at a regular set of 3D nodes, between which the velocity values are inter-polated using trilinear interpolation. The DD tomography problem is solved by means of the LSQR algorithm (Paige and Saunders, 1982) for the damped least-squares problem. Figure 3 shows the node locations used in our study. The origin of the horizontal (X, Y) coordinate system is posi-tioned at Mt. Fugen (32.761◦N, 130.299◦E), and the coor-dinate system is rotated 20◦clockwise from the north so as to correspond to the local subduction direction of the PHS plate. The horizontal grid spacing is approximately 20 km within the area of interest: in the vertical direction, grid points are positioned at depths of 0, 5, 10, 20, 30, 35, 50, 75, 100, 125 km. We assume as an initial velocity structure the 1D velocity model used for routine hypocenter deter-mination by the Institute of Seismology and Volcanology, Kyushu University (Fig. 4). The velocity discontinuity of
the Moho is not included in this initial model, but the cor-responding velocity gradient is included among the depth from 30 km to 35 km.
3.
Resolution
We have examined the attainable resolution of the to-mographic inversion using a checkerboard resolution test (CRT) and a restoring resolution test (RRT). For the CRT, we construct a model structure by assigning velocity per-turbations of+5% and 5% in an alternating pattern to each grid node and calculate synthetic travel times for all pairs of stations and events used in the actual tomographic analysis. The velocity structure is then estimated from the synthetic travel times after adding Gaussian random noise with a stan-dard deviation of 0.015 s forP-wave arrivals and 0.039 s for
N
0
50
100
150
200
-150 -100 -50 0 50 100 150
-200 -150 -100 -50
50 100 150 200 0 50 100 150 200
Depth(km)
Depth(km)
Distance (km)
Distance (km)
0
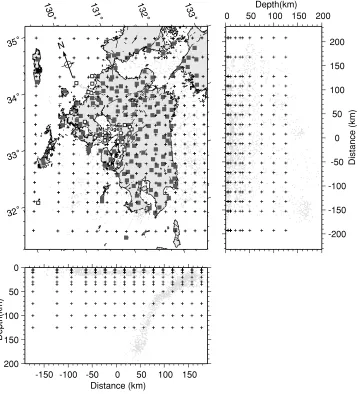
Fig. 3. Distribution of seismic stations used in the analysis (squares) and the computational grid (crosses). Open squares denote stations chosen specifically to target western Kyushu; these instruments are operated by Kyushu University. The origin of the computational gird is centered on Mt. Fugen (a thick cross; 32.761◦N, 130.299◦E); the grid is rotated clockwise from the north by 20◦. See text for further details. Circles mark hypocenters used in this study.
and its six neighbor grid nodes. We adopt a 0.75 resolvabil-ity value as the smallest well-resolved grid node. For the RRT, we calculate synthetic travel times using the velocity structure obtained by inverting the actual observed data. We invert these synthetic travel times (once again after adding Gaussian noise) to obtain a new estimate of the velocity structure in the same way as for the CRT. By comparing the tomographic structure obtained from the real observa-tions with the results of the CRT and RRT, we can assess the spatial resolution of our results in the target area.
4.
Results
The inversion process is carried out iteratively, and over-all we obtain a decrease in root mean square travel time residuals from 0.39 s to 0.17 s after 36 iterations. The aver-ageP-wave andS-wave velocities are illustrated in Fig. 4, and compared with the initial velocity model. The observed variation in modeled velocity is similar to that in the initial model. Figure 5 shows relocated hypocenter distribution. The inversion process lets hypocenters gather, especially in and around the PHS plate and active faults, and it suggests
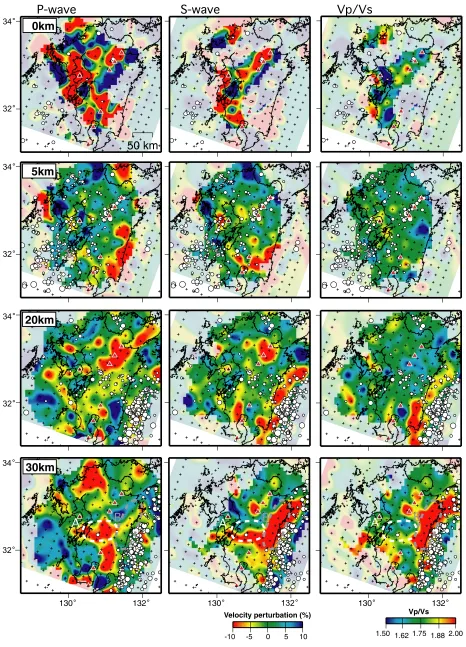
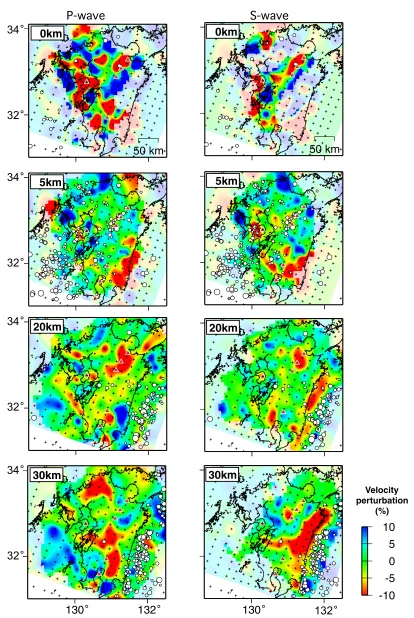
that relative locations of hypocenters are well determined. Figure 6 depicts plan views of theP-wave velocity (Vp) and the S-wave velocity (Vs) structures obtained here as perturbations with respect to the average of the inverted ve-locity values at each depth. Figure 6 also depicts Vp/Vs structure. The masked areas are those in which the esti-mated velocities have a low reliability as indicated by the resolvability value smaller than 0.75. Figure 7 shows plan views of the CRT results forP- andS-waves. These results show that the velocity inversion produces a good resolution in the crust at depths of 530 km in and around Kyushu. At the surface, the only areas with good resolution are found to lie along active faults, such as the Beppu-Shimabara Graben and the Futagawa-Hinagu Fault. The resolution estimated using the RRT (Fig. 8) is also high in the crust in and around Kyushu, suggesting that the results are reliable in the target region. The RRT results yield similar patterns for bothVp andVs. Figure 9 illustrates vertical cross-sections ofVp,Vs, andVp/Vsstructures in the direction of PHS plate subduc-tion. Figure 10 shows vertical cross-sections of the P- and
1 2 3 4 5 6 7 8 9 0
20
40
60
80
100
Initial P-wave velocity Initial S-wave velocity Averaged P-wave velocity Averaged S-wave velocity
Velocity (km/s)
Depth (km)
Fig. 4. Initial velocity models (dots) and averages of the estimated velocities (solid lines) forP-waves andS-waves.
N
200 150 100 50
0 0
50
100
150
200
-150 -100 -50 0 50 100 150
-200 -150 -100 100 150 200 0 50 100 150 200
Depth(km)
Depth(km)
Distance (km)
Distance (km)
Depth(km) Magnitude
-50 0 50
Fig. 7. Plan view of the CRT results for (a)P-waves and (b)S-waves at each depth. White and black circles show positive and negative velocity perturbations, respectively, and the size of the circle represents the magnitude of the perturbation. The input amplitudes of the velocity perturbation are±5%. The depth of each layer is shown in the upper left corner of eachP-wave panel.
velocity structures in and around the crust.
In the upper crust, pronounced low-velocity anomalies exist beneath Miyazaki Plain (about 4.3 km/s) and along
the Beppu-Shimabara Graben (about 4.4 km/s). These
Beppu-Fig. 8. Plan views of the RRT results for (a)P-waves and (b)S-waves at each depth. The velocity perturbations are calculated from the average of the inverted velocity values at each depth, and masking obscures areas of low reliability (see Fig. 6 and the text for details). Red triangles indicate active volcanoes, and circles mark earthquake epicenters for events within 2.5 km of each depth. The depth of each layer is shown at the top of each panel.
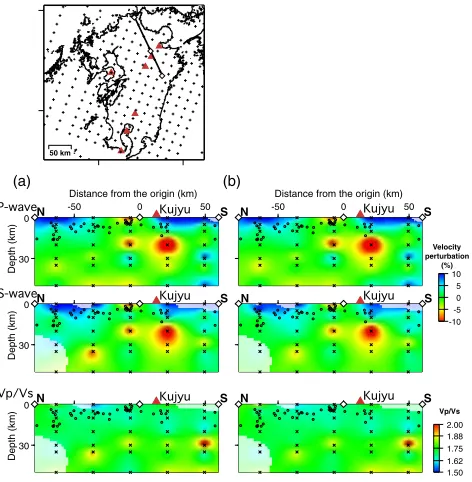
Shimabara Graben). Figure 12 shows vertical
cross-sections ofVp,VsandVp/Vs across the Beppu-Shimabara Graben and reveals that the low-velocity anomaly is lim-ited at the uppermost crust up to 5 km. The high- and
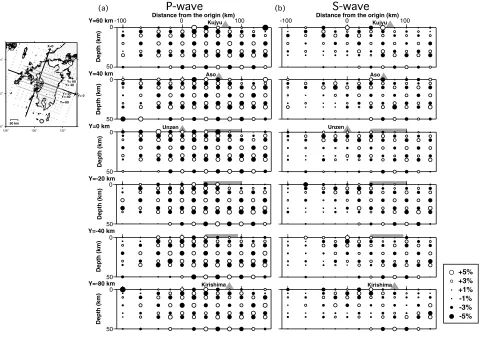
Fig. 10. Vertical cross-sections of (a)P-wave and (b)S-wave CRT results in the direction of PHS plate subduction. The Y-position of each section is noted in the upper left of eachP-wave panel and shown in the insert map. The gray triangle and gray rectangle above each panel mark the position of active volcanoes and the Kyushu Mountains, respectively.
time; as such, makes local geological effects appear at the velocity structure of 0 and 5 km.
In the lower crust, a low-velocity anomaly exists beneath the active volcanoes at depths of 20–30 km. At the lower end of this depth range, we also observe highVp/Vs ra-tios beneath the active volcanoes (Fig. 6 (30 km)). The re-sults also show low Vp regions at the bottom of the crust (i.e., at depths of 30 km in the central Kyushu area), just be-low the volcanic front and between active volcanoes. The lowVpregion corresponds to lowVp/Vsratios. The region features low velocity and low Vp/Vs (region A in Figs. 6 and 9) whereas the mantle wedge features low velocity and highVp/Vs (region B in Figs. 6 and 9). Many studies have shown similar patterns of the velocity structure in region B (e.g., Wang and Zhao, 2006; Taharaet al., 2008; Matsubara
et al., 2008), suggesting the existence of a pervasively ser-pentinized mantle wedge. The cross-sections ofVp,Vs, and
Vp/Vsclarify the existence of low velocity and lowVp/Vs at the bottom of the crust. These sections reveal extensive thin, low-Vp zones around a depth of 30 km beneath the Kyushu Mountains (Fig. 9 (Y=0 km,−20 km,−40 km)). Figure 13 illustrates vertical cross-sections of the P-wave velocity structure in the direction of PHS plate strike (X– X) and PHS plate subduction (Y1–Y1, Y2–Y2, Y3–Y3). The low-velocity region extends to a greater depth beneath the Kyushu Mountains than in the surrounding regions, and it has convex downward in shape (Fig. 13 (X–X, Y2–Y2)).
Another low-velocity region is observed beneath northern Kyushu at a depth of 30 km in theVp structure (33.6◦N, 130.7◦E). This area is at the edge of the study area and suf-ficient resolution was not obtained in theVs structure. Fur-ther study is Fur-therefore necessary to discuss the low velocity anomaly.
In the next section, we discuss the tectonic implications of the velocity modeling results.
5.
Discussion
5.1 Beppu-Shimabara Graben and uppermost crust The results presented in the previous section reveal that extensive low-velocity anomalies lie along the Beppu-Shimabara Graben below 5 km (Fig. 6 (0 km, 5 km), Fig. 12) and beneath the Miyazaki Plain to depths of ∼10 km (Fig. 6 (5 km), Fig. 9 (Y= −440 km,−80 km)). The Beppu-Shimabara Graben is characterized by steeply low-gravity anomalies and significant negative gravity anomalies in the eastern edge. A geodetic survey shows a N-S extensional strain in the Beppu-Shimabara Graben at a rate of 1.4 cm/yr, and crustal depression of 2 mm/yr in Unzen region during the period from 1891 to 1982 (Tada, 1985). The focal mechanism of micro-earthquakes shows normal- and strike-slip-faulting earthquakes with N-S ten-sion (T) axes (Hatanaka and Shimazaki, 1988; Shimizu
continen-Fig. 11. Gravity anomaly map of Kyushu. A uniform density of 2.67 g/cm3and a constant vertical gradient value of−0.3086 mgal/m were assumed for the Bouguer density and free-air reduction, respec-tively.
Fig. 12. (a) Vertical cross-sections of velocity perturbations forVp(top), velocity perturbations forVs (middle) andVp/Vs (bottom) across the BSG. (b) Vertical cross-sections of velocity perturbations for the RRT results. The velocity perturbation is calculated with respect to the av-erage of the estimated velocity values at each depth. Masking obscures areas of low reliability (see Fig. 6 and the text for details). Red tri-angles mark the Kujyu volcanoes and circles indicate the epicenters of the relocated events. Earthquake hypocenters (circles) within 15 km of each cross-section are plotted. Diamonds of each panel correspond to positions shown in the insert map.
tal crust and the north-eastern extension of the Okinawa
Trough. In contrast, Kamata and Kodama (1994)
sug-gested that normal faults in the Unzen region and volcano-tectonic depressions in the Hohi Volcanic Zone (HVZ) in-dependently exist due to crustal extensions in the north-ern Okinawa Trough in the Unzen region and pull-apart geometry by oblique subduction of PHS plate and dextral displacement on the MTL and its western extension, the
Fig. 13. (a) Vertical cross-sections of Vp images in the direction of PHS plate subduction (Y1–Y1, Y2–Y2, Y3–Y3) and PHS plate strike (X–X). (b) Vertical cross-sections for the RRT results. Thick lines and thin lines indicate contour lines ofVp. Position of the cross-sections is shown in the insert map. Masking obscures areas of low reliability (see Fig. 6 and the text for details). The red triangle and gray rect-angle above each panel mark the position of active volcanoes and the Kyushu Mountains, respectively. Circles indicate the epicenters of the relocated events. Earthquake hypocenters (circles) within 15 km of each cross-section are plotted.
0 100 200
0
30
Y Y'
Depth (km)
Distance from the origin (km) Y
Y'
X=0
Y= 0
50 km
7.0
8.0 6.0
3.5 6.8 7.2 8.0 8.6 Miyazaki
plain
Fig. 14. Vertical cross-sections ofVp images along a Kyushu Moun-tains-Miyazaki Plain-Hyuganada line. Thick lines and thin lines indi-cate contour lines ofVp. Position of the cross-sections is shown in the insert map. Masking obscures areas of low reliability (see Fig. 6 and the text for details). The gray rectangle above each panel marks the position of the Kyushu Mountains. Circles indicate the epicenters of the relocated events. Earthquake hypocenters (circles) within 15 km of each cross-section are plotted. Areas surrounded by red line show lower
Oita-Kumamoto Tectonic Line (OKTL) in the HVZ, re-spectively. Nishimura and Hashimoto (2006) analyzed the GPS-derived velocity eld in Kyushu during a period from 1996 to 2002. They interpreted strain eld by a N-S ex-tension along the Beppu-Shimabara Graben and E-W right lateral slips and its de cits along the Median Tectonic Line and the Beppu-Shimabara Graben. Low-velocity zones are likely to be spatially restricted below active volcanoes and in the uppermost crust in the case of the pull-apart basin scenario, and rather more extensive in the case of a rift zone formation mechanism. Our tomographic results re-veal a low-velocity anomaly extending from the surface to approximately 5 km in depth, a result compatible with the volcano-tectonic depressions model.
The Miyazaki Plain is also characterized by signi cant negative gravity anomalies (Fig. 11) and is inferred to have undergone aseismic crustal uplift in the Late Pleistocene and Holocene (Kono and Furuse, 1989; Nagaoka et al., 1991). Taharaet al.(2008) reported a low-velocity anomaly in the mantle wedge beneath the Hyuganada region between the Miyazaki Plain and the Hyuga Basin, based on seismic tomography, and estimated that 60% of the gravity anomaly was accounted for by buoyancy of the subducting Kyushu-Palau ridge. Miyamachi and Goto (1999), by means a seis-mic refraction experiment, revealed the existence of low-velocity layers with a thickness of about 10 km beneath the Miyazaki Plain. They reported that a probable cause of the low-velocity layer is the presence of accretionary sediments on a continental crust by subduction of the PHS plate. The buoyancy in the mantle wedge and the low density sedi-mentary body possibly yield the signi cant negative gravity anomaly.
Other high-velocity anomalies exist beneath the
Nagasaki Peninsula and Chikushi Mountains (Fig. 6 (0 km, 5 km)). These high-velocity anomalies correlate well with the gravity anomalies calculated by the Gravity Research Group in Southwest Japan (2001). According to Nishimura (1998), the Nagasaki Peninsula and the Chikushi Moun-tains are composed of the Sangun metamorphic rocks, which originated as a Paleozoic to Mesozoic accretionary complex. The high seismic velocities characteristic of metamorphic rocks (e.g., Burke and Fountain, 1990) provide a straightforward explanation for the high-velocity anomalies beneath Nagasaki Peninsula and the Chikushi Mountains.
5.2 Beneath active volcanoes
Using the regional seismic network, we obtained a high-resolution velocity structure in the crust, especially beneath central Kyushu. This enables us to discuss low-velocity anomalies beneath active volcanoes in central Kyushu, such as the Kujyu, Aso and Unzen volcanoes. In terms of the upper crust, some studies have obtained details on velocity structures beneath the active volcanoes using the local seis-mic network (e.g. Ohmi and Lees, 1995; Sudo and Kong, 2001; Yoshikawaet al., 2005). Therefore, here we compare their results and discuss a linkage of shallow structures and structures in the lower crust beneath the active volcanoes.
Yoshikawaet al.(2005) revealed a low-velocity anomaly related to a geothermally active area in the northwest part of the Kujyu volcano. Our results also show a low-velocity
anomaly in the uppermost crust and, furthermore, we ob-tain a low-velocity anomaly in the lower crust beneath Ku-jyu volcano (Fig. 9 (Y = 60 km)). The anomaly in the lower crust is 9.3% forP-wave and 7.8% forS-wave, while
Vp/Vsis 1.76. Satoet al.(1989) indicated a decrease in the compressional velocity in peridotite with increasing tem-perature under high-temtem-perature and high-pressure condi-tions. Mavko (1980) explained a decrease ofVpandVs by a volume fraction of melt in a rock. The velocity anoma-lies of our result correspond to about 5% of partial melting. Thus, we suggest the existence of a high-temperature zone with partially molten rocks under the Kujyu volcano. This magma activity is probably related to the geothermal activ-ity in the uppermost crust.
Below the Aso volcano, Sudo and Kong (2001) showed a large amount of low-velocity anomaly, over 20% bothP -and S-waves, in the upper crust below the central cones. Our results do not show such an anomaly. These results suggest that our regional tomography has an insuf cient resolution to detect a locally distributed anomaly. We ob-tained a low-velocity anomaly in the lower crust that ex-tends widely along a volcanic front; high Vp/Vs exists at the bottom of the crust below the Aso volcano. These re-sults suggest the existence of a high-temperature region in the lower crust along the volcanic front (Fig. 6 (20 km), Fig. 9 (Y=40 km)) and a partially molten rock at the bot-tom below the Aso volcano (Fig. 6 (30 km), Fig. 9 (Y= 40 km)).
Ohmi and Lees (1995) presented velocity structures of
P- and S-waves below the Unzen volcano. They showed the presence of a low-velocity anomaly around a 10-km depth below the Unzen volcano. Our results show that low-velocity anomalies extend to a depth from 10 to 35 km (Fig. 9 (Y=0 km)). Furthermore, a highVp/Vsarea locally exists below the Unzen volcano, suggesting the existence of a high-temperature region in the lower crust and partially molten rock below the Unzen volcano.
5.3 Beneath the Kyushu Mountains
Fig. 15. A schematic model of our interpretation of the low-velocity area beneath the Kyushu Mountains. (a) Low-density rocks due to subduction of the Kyushu-Palau Ridge, and an acquisition of buoyancy. (b) A detachment of the uppermost crust of the Kyushu-Palau ridge (c) An accretion of low-density rocks at the bottom of the crust beneath the Kyushu Mountains.
into the tectonics of this region. Oda and Ushio (2007) es-timated Moho relief from refracted P-wave data. As noted in Introduction, they inferred that the depth of the Moho is increases eastward and that the maximum depth is found in the area where Kyushu-Palau Ridge subducted. The low-velocity area beneath the Kyushu Mountains is westward of the area of the inferred deepest Moho, but the depth of the Moho is still deep in the low-velocity area. Moreover, grav-ity data reveal extensive lows in central Kyushu. The low-velocity area therefore corresponds to low-density rocks at the base of the crust below the Kyushu Mountains. The Kyushu Mountains are the northern extension of Kyushu-Palau Ridge. Nishizawaet al.(2009) showed the existence of a thick oceanic crust related to the subducting Kyushu-Palau Ridge in the eastern part of the Hyuganada region. They observed a low-velocity zone (Vp =6.0–6.8 km/s) at the oceanic middle crust (10–15 km depth). Taharaet al.
(2008) also observed a low-velocity zone around the upper surface of the subducting oceanic crust (around the 20 km depth) below the western part of the Hyuganada region. They suggest the existence of the subducting Kyushu-Palau Ridge with a lower density than the surrounding uppermost mantle and that the subducting Kyushu-Palau Ridge yields detachment due to buoyancy caused by the density
con-trast. Figure 14 shows the cross-section of the P-wave ve-locity structure along a Kyushu Mountains-Miyazaki Plain-Hyuganada line. Low-velocity areas are observed below the Kyushu Mountains and the Hyuganada region, and these are remarkable on contour lines of 6.5 and 7.0 km/s. The low-velocity area beneath the Kyushu Mountains may indicate low-density rocks of a detached Kyushu-Palau Ridge due to such buoyancy. Figure 15 depicts a schematic figure of a plausible tectonic process beneath the Kyushu Mountains. Low-density rock likely plays an important role in uplift of the mountains, and our results provide the motivation for further study of the Moho in order to better understand the tectonics of the Kyushu Mountains.
5.4 The northern edge of Okinawa Trough
No obvious velocity anomalies related to the Okinawa Trough are seen in the crust of western Kyushu. Nakamura
et al.(2003) showed a low-velocity anomaly in an upper-most mantle beneath the Okinawa Trough, which they sug-gested as an upward flow of mantle materials. A possible explanation of why no such anomaly has been observed in the present study is that there is neither an upward flow un-der the crust nor partial melting of lower crust in western Kyushu, a northern extension of the Okinawa Trough.
6.
Conclusions
We have obtained high-resolution velocity models be-neath Kyushu, and, in particular, its western regions us-ing 71,462 P-wave and 46,465 S-wave arrival time data from 2128 earthquakes observed at 182 seismic stations. Our results reveal detailed velocity structures in the upper crust that correlate well with gravity anomalies. Prominent low-velocity anomalies exist beneath the Miyazaki Plain and along the Beppu-Shimabara Graben, and high-velocity anomalies lie below the Nagasaki Peninsula and Chikushi Mountains. We observed low-velocity anomalies in the lower crust beneath the active volcanoes, and associated highVp/Vs ratios. Another low-velocity region exists near the bottom of the crust below the Kyushu Mountains and be-tween the active volcanoes. This extensive feature exhibits lowVp/Vsratios and may correspond to a low-density sub-ducted ridge at the base of the crust.
Acknowledgments. We would like to thank the Institute of Seis-mology and Volcanology, Kyushu University (SEVO), Nansei-Toko Observatory for Earthquakes and Volcanoes, Kagoshima University (NOEV), Disaster Prevention Research Institute, Kyoto University (DPRI), JMA and National Research Institute for Earth Science and Disaster Prevention (NIED) for the use of the seis-mic data. We are grateful to H. Zhang for the use of the Double-Difference tomography program tomoDD. A. Kato, R. Parithusta, and N. Hirata’s support was invaluable for improving this paper.
References
Burke, M. M. and D. M. Fountain, Seismic properties of rocks from an exposure of extended continental crust—new laboratory measurements from the Ivrea Zone,Tectonophysics,182, 119–146, 1990.
Gravity Research Group in Southwest Japan, Gravity database of south-west Japan,Bull. Nagoya Univ. Museum, Spec. Rep.,9, 2001. Handa, S., Y. Tanaka, and A. Suzuki, The electrical high conductivity layer
beneath the northern Okinawa Trough, inferred from geomagnetic depth sounding in northern and central Kyushu, Japan,J. Geomag. Geoelectr., 44, 505–520, 1992.
1998 (in Japanese with English abstract).
Hatanaka, Y. and K. Shimazaki, Rupture process of the 1975 Central Oita, Japan, Earthquake,J. Phys. Earth,36, 1–15, 1988.
Honda, S. and I. Nakanishi, Seismic tomography of the uppermost man-tle beneath southwestern Japan: Seismological constraints on modeling subduction and magmatism for the Philippine Sea slab,Earth Planets Space,55, 443–462, 2003.
Kamata, H. and K. Kodama, Tectonics of an arc-arc junction: an example from Kyushu Island at the junction of the southwest Japan arc and the Ryukyu arc,Tectonophysics,233, 69–81, 1994.
Kamata, H. and K. Kodama, Volcanic history and tectonics of the South-west Japan arc,Island Arc,8, 393–403, 1999.
Kono, Y. and N. Furuse,Gravity Anomaly Map in and Around the Japanese Island, 88 pp, University of Tokyo Press, 1989.
Matsubara, M., K. Obara, and K. Kasahara, Three-dimensional P- and S-wave velocity structures beneath the Japan Islands obtained by high-density seismic stations by seismic tomography,Tectonophysics,454, 86–103, 2008.
Matsumoto, Y., Some problems on volcanic activities and depression struc-tures in Kyushu, Japan,Mem. Geol. Soc. Jpn.,16, 127–139, 1979 (in Japanese with English abstract).
Mavko, G. M., Velocity and attenuation in partially molten rocks,J. Geo-phys. Res.,85, 5173–5189, 1980.
Miyamachi, H. and K. Goto, Structural exploration of Kyushu District from the standpoint of the island arc,Chikyu Monthly,extra issue 27, 222–226, 1999 (in Japanese).
Nagaoka, S., The landform evolution of late Pleistocene in the Miyazaki plain, south Kyushu, Japan,Quat. Res. (Jpn.),25, 139–163, 1986 (in Japanese with English abstract).
Nagaoka, S., Tectonics and mountains landform in Kyushu, Japan,Chikyu Monthly,21(10), 637–643, 1999 (in Japanese).
Nagaoka, S., H. Maemoku, and Y. Matsushima, Evolution of Holocene coastal landforms in the Miyazaki plain, southern Japan, Quat. Res. (Jpn.),30, 59–78, 1991 (in Japanese with English abstract).
Nakamura, M., Y. Yoshida, D. Zhao, H. Katao, and S. Nishimura, Three-dimensional P- and S-wave velocity structures beneath the Ryukyu arc,
Tectonophysics,369, 121–143, 2003.
Nishimura, S. and M. Hashimoto, A model with rigid rotations and slip de cits for the GPS-derived velocity eld in Southwest Japan, Tectono-physics,421, 187–207, 2006.
Nishimura, Y., Geotectonic subdivision and areal extent of the Sangun belt, inner zone of southwest Japan,J. Metamor. Geol.,16, 129–140, 1998. Nishizawa, A., K. Kaneda, and M. Oikawa, Seismic structure of the
north-ern end of the Ryukyu Trench subduction zone, southeast of Kyushu, Japan,Earth Planets Space,61, e37–e40, 2009.
Oda, H. and T. Ushio, Topography of the Moho and Conrad discontinuities in the Kyushu district, Southwest Japan,J. Seismol.,11, 221–233, 2007. Ohmi, S. and J. M. Lees, Three-dimensional P- and S-wave velocity struc-ture below Unzen volcano,J. Volcanol. Geotherm. Res.,65, 1–26, 1995. Paige, C. C. and M. A. Saunders, LSQR: sparse linear equations and least squares problems,ACM Trans. Math. Software,8(1), 195–209, 1982. Sadeghi, H., S. Suzuki, and H. Takenaka, Tomographic low-velocity
anomalies in the uppermost mantle around the northeastern edge of Ok-inawa Trough, the backarc of Kyushu,Geophys. Res. Lett.,27(2), 277–
280, 2000.
Sato, H., I. S. Sacks, and T. Murase, The use of laboratory velocity data for estimating temperature and partial melt fraction in the low-velocity zone: comparison with heat ow and electrical conductivity studies,J. Geophys. Res.,94, 5689–5704, 1989.
Seno, T., Syntheses of the regional stress elds of the Japanese islands,
Island Arc,8, 66–79, 1999.
Shimizu, H., K. Umakoshi, and N. Matsuwo, Seismic activity in mid-dle and western Kyushu,Mem. Geol. Soc. Jpn.,41, 13–18, 1993 (in Japanese with English abstract).
Shimoizumi, M., T. Mogi, M. Nakada, T. Yukutake, S. Handa, Y. Tanaka, and H. Utada, Electrical conductivity anomalies beneath the western sea of Kyushu, Japan,Geophys. Res. Lett.,24(13), 1551–1554, 1997. Sudo, Y. and L. S. L. Kong, Three-dimensional seismic velocity structure
beneath Aso volcano, Kyushu, Japan, Bull. Volcanol.,63, 326–344, 2001.
Tada, T., Spreading of the Okinawa Trough and its relation to the crustal deformation in the Kyushu (2),J. Seismol. Soc. Jpn.,38, 1–12, 1985 (in Japanese with English abstract).
Tada, T., Crustal deformation in central Kyushu, Japan and its tectonic im-plication: rifting and spreading of the Beppu-Shimabara Graben,Mem. Geol. Soc. Jpn.,41, 1–12, 1993 (in Japanese with English abstract). Tahara, M., K. Uehira, H. Shimizu, M. Nakada, T. Yamada, K. Mochizuki,
M. Shinohara, M. Nishino, R. Hino, H. Yakiwara, H. Miyamachi, K. Umakoshi, M. Goda, N. Matsuwo, and T. Kanazawa, Seismic velocity structure around the Hyuganada region, Southwest Japan, derived from seismic tomography using land and OBS data and its implications for interplate coupling and vertical crustal uplift,Phys. Earth Planet. Inter., 167, 19–33, 2008.
Takayama, H. and A. Yoshida, Crustal deformation in Kyushu derived from GEONET data, J. Geophys. Res., 112, B06413, doi:10.1029/ 2006JB004690, 2007.
Um, J. and C. H. Thurber, A fast algorithm for two-point seismic ray tracing,Bull. Seismol. Soc. Am.,77(3), 972–986, 1987.
Waldhauser, F. and W. L. Ellsworth, A Double-Difference earthquake lo-cation algorithm: Method and applilo-cation to the northern Hayward fault, California,Bull. Seismol. Soc. Am.,90(6), 1353–1368, 2000.
Wang, Z. and D. Zhao, Vp and Vs tomography of Kyushu, Japan: New insight into arc magmatism and forearc seismotectonics,Phys. Earth Planet. Inter.,157, 269–285, 2006.
Yoshikawa, M., Y. Sudo, H. Masuda, S. Yoshikawa, and S. Taguchi, Deep geothermal structure of the Otake-Hatchobaru geothermal area in the central Kyushu, Japan, revealed by seismic velocity structure,J. Geotherm. Res. Soc. Jpn.,27(4), 275–292, 2005 (in Japanese with En-glish abstract).
Zelt, C. A., Lateral velocity resolution from three-dimensional seismic refraction data,Geophys. J. Int.,135, 1101–1112, 1998.
Zhang, H. and C. H. Thurber, Double-Difference Tomography: The method and its application to the Hayward fault, California,Bull. Seis-mol. Soc. Am.,93(5), 1875–1889, 2003.