Transactions of the 17th International Conference on Structural Mechanics in Reactor Technology (SMiRT 17)
Prague, Czech Republic, August 17 –22, 2003
Paper # M01-3
Reliability Assessment of Structural Impact/Contact Mechanics
K.Petkevicius1), R.Kulak2), and P.Marchertas2) 1) Kaunas University of Technology, Lithuania 2) Argonne National Laboratory, USA
ABSTRACT
Structural reliability methods were used for the assessment of structural impact-contact solutions. The structural integrity is evaluating in terms of output functions, such as strain, stress and displacement. Deterministic solutions for several different problems involving impact/contact mechanics were performed. A selected set from the input parameters were considered to be random variables and a set of output functions were defined as response variables. Then a sensitivity analysis was performed and the reliability index for those functions were estimated. Specific features by use of reliability methods for impact-contact problems were discussed. A probabilistic tool has been developed that can evaluate the reliability of structural impact/contact problems when coupled with the deterministic NEPTUNE FEA software.
KEY WORDS: structural reliability, impact, contact, Monte Carlo simulation, first order reliability method, second order reliability method, explicit time integration.
INTRODUCTION
The determination of the integrity of structures subjected to impact by an object depends on a number of parameters with values that can vary greatly. An estimate of the reliability of a solution can be obtained by using the Monte Carlo simulation method, first order reliability method, second order reliability method, response surface method, mean value method, importance sampling algorithm or others. The most accurate reliability estimations of structural impact/contact problems can be obtained by using the Monte Carlo simulation (MCS) method. In this method, sample values of the input variables are generated based on functions or their probability density functions (PDF). An output is then evaluated from each input sample. MCS is flexible for all types of input distributions and all forms of model functions. Neglecting the errors of algorithms caused by simulations, if a sufficient number of simulations are used, MCS often gives results of solutions with a high accuracy. An important aspect of MCS compared to other numerical methods is that its accuracy does not depend on the number of the random model input variables. Unfortunately, the cost of computations using the Monte Carlo method can be very high. The applicability of this method is therefore offset by its computational expense The CPU time increases greatly for real 3D nonlinear dynamic problems. This increase is related to the necessity to execute a large number of finite element analyses (FEA) solutions with random parameter values. A complete finite element analysis that is performed for each of the vectors of random variables is costly in itself.
In order to reduce the total CPU time, several alternative methods have been proposed [1,2]: first order reliability method (FORM), second order reliability moment method (SORM), response surface method, tangent multi-plane surface method, interior multi plane surface method, importance sampling algorithm and others. The alternatives to MCS are faster but have limitations. They are based on the assumptions that the state of the structure is defined in the outcome space of a vector of random variables. An important assumption for a structural failure probability is that the structure can be in one of two states, the safe state or the failed state. The boundary between those two states is known as the limit state surface.
STRUCTURAL RELIABILITY TECHNIQUES
In practice, the most desirable probabilistic evaluations are for quantities developed during analysis. Since the most widely used engineering programs do not directly support probabilistic methods, there is a need for interfacing probabilistic codes with existing deterministic structural analysis programs. An initial value of an output function, corresponds to the solution for the vector of input parameters P0=P1,0, P2,0, … , Pn,0 with nominal values of each
parameter. Potential parameters may include: material properties, loads, geometrical dimensions, computational parameters and FE mesh size near irregularities. When approximation methods such as FORM/SORM are used, then the random function value F can be computed by the equation:
∑
=
∆ ∂
∂ +
= N
m
i m m
i P
P F F
F
1
,
where F0,Fi
are the initial and random value of output function
;
m P F ∂ ∂,
n m P P F ∂ ∂ ∂2are the partial derivatives of the
parametersintheregion ofinitialsolution
;
are the randomvaluesof parametersalterations.
Thederivativescan byevaluated usingpolynomialleast squaresapproximation offunctions.
Becausethosederivativesareobtainedfrom approximatedpolynomialfunctiontheirconfidenceintervalscanbeevaluated:
i m P, ∆ s t P F P F n a m low m 1 , 2 / − − ∂ ∂ = ∂ ∂
,
s t P F P F n a m up m 1 , 2 / − + ∂ ∂ = ∂∂
(3)
where lup m low m P F P F ∂ ∂ ∂ ∂ ,
are the lowerandupperbounds ofthederivativesaccordingto theassumedconfidencelevel
;
n
s=σ,i is the standard error of the estimate
;
n is the number of FEA analysis points.
The standard error of theestimatecanbefoundforthelinearapproximation
:
(
)
∑
∑
= = − − − ∂ ∂ − = n j m j m n j m j m m j P P n P F Intercept P P F F s 1 2 , 2 1 , ) 2 ( ) , ((4)
where F(P0),F(Pi) is the initial solution and Most Probable Point (MPP);
m
P F
∂
∂ are the partial derivatives of the
parameters the in region of initial solution; ∆Pm,i are random values of parameters alterations.
An estimation of the necessary number of FEA solutions for every output functions can be determined by a test for goodness of fit on the approximations used. This analysis can by performed using the χ2 based approach [9], which is convenience for multi-parametric model. According to this approach, a model has a “goodness of fit” with assumed confidence if:
2 2
cr
r
r
<
(5)where r2 =dTV−1d and
; n
) ( 2
95 . 0 np
)
(
2 95 . 0 2 pcr
l
n
r
=
pis the numberof comparedcouplepointsofthe approximatedandFEAresults
;
l is the valueassociated withthe 95%confidence region forn
p couple pointsinthe model throughthe χ2 distribution
.
Vectordisa vector of differences and V is a matrix of covariance, which in case of un-correlated parameters can be written:
= + + + + + + + + + + + + + + + + + + 2 , 1 , , 2 , 1 , 1 2 1 1 , 1 , 2 1 , 1 , 1 , 2 , 2 1 , 2 2 2 , 1 1 , 1 2 1 0 0 0 0 0 0 m n m n n m n n m n m n m n n n n n n n m n n n n n m n n m n n CV CV CV CV CV CV CV CV CV CV CV CV CV CV σ σ σ σ σ K K K K K K K K K K K K K K K K K K K K K K K K V
;
,
(6) ∆ ∆ ∆ ∆ ∆ = + + m n n n K K 1 2 1 d
where is the standard deviation of a parameter or approximated function; is the difference between the mean and the current value of the parameters and output functions, n is a number of parameters; m is the number of compared functions, CV
2
n
σ
∆
ni,j are the co-variances between parameters and output functions. Differences between
2 2 2 2 0
2
2 1
∆ ∂ ∂ + ∆ ∂ ∂ + − =
∆ + +
∑
∑
i
i i i
i i m
n m n
P F P
F F
F
.
(7)If CVi,j = 0, then r2 can be calculated:
∑
∆ +∆ + +∆ +∆ + +∆
=
+ + +
+
2 2
2 1 2
1 2 2
2 2 2 2 2 1 2 1 2
m n
m n n
n n n
r
σ σ
σ σ
σ K K
.
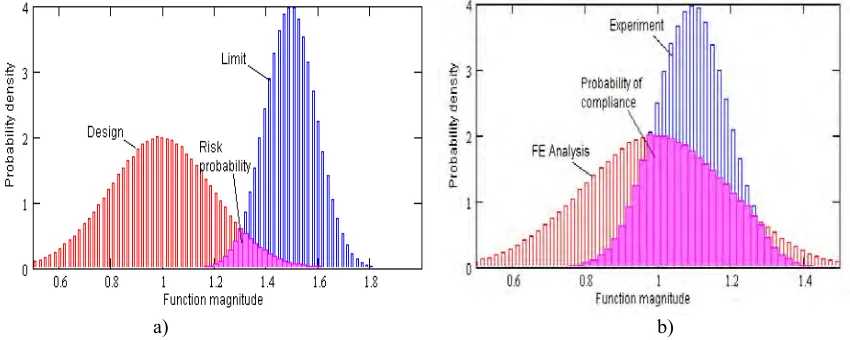
(8)The reliability of the estimated output functions from FE structural analysis can be estimated by the risk probability shown in the Fig. 1a or the reliability index β:
G G
σ µ
β = , (9)
where µG, σGare the mean and standard deviation of the new probability distribution function, which is the intersection
of the design and the limit (or load and strength) probability distribution functions or histograms.
a) b)
Fig. 1 Risk probability (a) and probability of compliance (b)
The verification and validation stage of the developed methodology, software and numerical models is related to the comparison of FEA results with a multiple of experimental tests. Output uncertainty of the FE analysis can be characterized by stress, displacements, velocities and other response parameters. It can be caused by uncertainty of input variables, model and software uncertainty. Random input variables as parameters can come to a considerable list. Model uncertainty can be predetermined by physics, model and mesh uncertainties. Software uncertainty can by based on coding, algorithm and numerical errors. Results of experimental tests depend the measurement technique (methods, equipment, software, human factor, etc.) and scatter of structural parameters (materials, loads, dimensions, BC etc.). In this relation conclusions of comparison of FEA and experimental results can be very sensitive to mentioned aspects. An easy deterministic compare can strongly limit a reliability of those conclusions.
The reliability of compliance between FEA output functions and experimental functions can be evaluated taking into account the probabilistic nature. For an estimation of the agreement between FEA and experimental results a reliability of compliance can be helpful. Then instead of using design and limit histograms, which are shown in the Fig. 1a., the FEA and experimental results should be used (Fig. 1b). Intersection of those PDFs results in a probability of compliance between FEA and experimental results.
In general for problems involving contact/impact mechanics, the compliance between FE analysis results and experiment results could be evaluated in several steps. Initially a list of all FEA output functions, which must be verified, should be defined. Then a composition of PDFs of numerical analysis is performing. This will include the following:
- setting a list of significant parameters for each defined output function (physical and mathematical assumptions, dimensions, material properties, loading, boundary conditions, mesh characteristics and etc.);
- FEA for establishment of parametric sensitivity;
- evaluation of the confidence of the established derivatives and test for goodness of fit of FE solutions; - calculation of probabilistic distribution using FORM/SORM techniques;
- characterization of computed probabilistic distribution of analytical results. Second the composition of PDFs of experimental (or other analytical) results:
- setting a list of significant parameters for each defined output function (dimensions, material properties, loading, boundary conditions, measurement errors and etc.);
- FEA for establishment of parametric sensitivity;
- least squares analysis for the evaluation of necessary derivatives of each output function by each parameter from corresponding parameter list;
- evaluation of confidence of calculated derivatives and, if available, then estimation of experimental bias; - calculation of probabilistic distribution using FORM/SORM techniques;
- characterization of computed probabilistic distribution of experimental (or other analytical ) results; Finally an estimation of the probability of compliance can be calculated.
Numerous commercial codes for the evaluation of probabilistic structural estimations are available. For the problems that are presented in this paper, an original procedure, PRONEP, for probabilistic estimations was used. This software is based on the FORM/SORM methods.
The FE probabilistic structural evaluations were performed using the determinist finite element code NEPTUNE [6] and the newly developed probabilistic software, PRONEP, which was developed for the implementation of the FORM approach. This procedure was made for the establishment of parameter list, capability to correlate several parameters, generation of FEA input files, managing of FEA solution process, extraction of requested output functions and calculation of the cumulative probability and reliability index. PRONEP was developed using VBA scripts. PRONEP inputted necessary information and performed structural reliability evaluations. The capability to correlate related parameters is needed for such parameters as nodal coordinates, points on stress – strain diagram etc. The correlation coefficient between these parameters is assumed to be equal to one. Response variables, which are necessary for reliability calculations, are extracting from NEPTUNE output files and processed by PRONEP. Minimum, maximum or average values of selected output variables can be extracted for examination.
NUMERICAL RESULTS
In this paper several problems are presented to illustrate the use of the above procedure in the calculation of a probabilistic safety assessment. The first and third problems simulate impact of a whipping pipe onto a reinforced concrete structure. The second problem is a cylindrical panel subject to a blast load. These problems are highly nonlinear involving large displacements, material plasticity and contact/impact.
Impact of pipe onto a concrete wall
The impact of a pipe onto a concrete wall is an important problem in the structural integrity assessment of nuclear power plants. The problem assumes that a pipe, cantilevered at one end, experiences a guilotine break at the other end that creates transverse hydrodynamic forces, which cause the pipe to whip into a nearby concrete wall. The interaction between the wall and the pipe is taken into account by using contact elements. The FE model is shown in Fig. 2a. Quadrilateral reinforced concrete plate elements are used to model the wall; pipe elements are used to model the pipe; and and point-to-line contact elements are used to model the contact mechanics. The boundary conditions for the wall do not allow translation but do allow rotations. Because the point-to-line contact element was used, the pipe was constrained to move in the x-y plane. At the guilotine end of the pipe, a hydrodynamic force is applied perpendicular to the pipe; this is the force that drives the pipe into the reinforced concrete wall. Note, for the first study the force is assumed constant and remains on througthout the simulation. The FE analyses were performed using the NEPTUNE [6] structural analysis software. The deflection-time histories for the pipe and gap between wall and elbow are shown in Fig. 2b.
Figure 3a shows wall deflections for the case with elasto-plastic rebars and Fig. 3b for the case with elastic rebars. In Fig. 3a it is seen that the wall deflection starts to increase rapidly at 0.25 sec. Recall that in this simulation, the hydrodynamic force is continuously being applied to the pipe and this is causing the pipe and wall to vibrate. The vibrations cause the concrete to continuously crack and, thus, have its stiffness reduced. This results in the large deflections of the wall as shown in Fig. 3a. When elastic concrete material was assumed, then the deflections of the wall changed its character as shown in Fig. 3b. Without the ability to crack, the deflections are bounded even with the continually applied load. Also, several problems were solved by modifying the load-time history. The first modification was to set the value of the hydrodynamic force to zero after 50 ms and the second was to use a damping ratio of 0.2 for the contact element.
(a) (b)
Fig. 2 (a) FE model for a pipe impacting onto a concrete wall, and (b) the temporal history of the pipe elbow node deflection (uy_43) and the gap of the contact element (h_51)
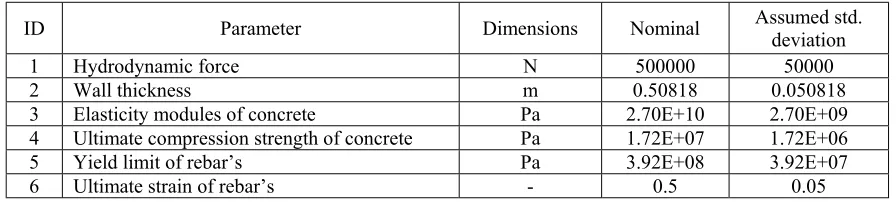
Structural reliability analysis was performed using six parameters, with the nominal magnitudes and standard deviations shown in the Table 1.
(a) (b)
Fig. 3 Deflection of wall at impact area: (a) – elastic-plastic reinforcement, (b) - elastic reinforcement
Table 1. Nominal magnitudes and standard deviations of the random variables (parameters)
ID Parameter Dimensions Nominal Assumed std. deviation
1 Hydrodynamic force N 500000 50000
2 Wall thickness m 0.50818 0.050818
3 Elasticity modules of concrete Pa 2.70E+10 2.70E+09
4 Ultimate compression strength of concrete Pa 1.72E+07 1.72E+06
5 Yield limit of rebar’s Pa 3.92E+08 3.92E+07
6 Ultimate strain of rebar’s - 0.5 0.05
The following output functions (response variables) were chosen for the probabilistic structural analysis:
- maximum displacement of the wall at the impact area;
Fig. 4 Parameter sensitivity illustration of wall deflection on contact area
This interpretation of the sensitivity study represents quantitative and qualitative character of the examined parameters. For the case analyzed the largest influence on the maximum wall deflection during whip pipe impact are the wall thickness and magnitude of hydraulic force (parameters #1 and #2). The elasticity modulus and ultimate compression strength of concrete and the yield limit and ultimate strain of the rebar’s are not so significant for this case.
Whipping pipe impact on a concrete slab
The problem of a whipping pipe impacting onto a concrete slab was used to verify the development of a pinball algorithm by direct localization of the impact area [7]. The FE model, which is shown in the Fig. 5, was made according to detail description of experimental conditions and results presented in [8]. For the evaluation of compliance between FEA and experimental results, the following output functions (response variables) were selected:
- time to impact,
- total reactions, which are measured on concrete slab.
The following random variables and their standard deviations for probabilistic structural analysis were assumed: - elasticity of concrete (Ec=2.50·106 psi, σEc =5.00·105 psi),
- cross section area of reinforcement (Ar=1.12·10-1 in2, σAr=2.24·10-2 in2),
- distance from mid-surface axis to rebar location (tr=2.80 in, σt=0.20 in),
- impact location xc (Fig. 5) (xc=20.0 in, σx=5.0 in),
- fluid force inside of pipe (f=1.30·103 lbf, σf=1.30·102 lbf),
- elasticity of pipe steel (Es=2.90·107 psi, σEc =2.90·106 psi),
- pipe wall thickness (δ=0.3 in, σδ=0.03 in),
- yield stress of pipe steel (Ry=3.90·104 psi, σRy =3.90·103 psi),
- ultimate stress of pipe steel (Ru=5.85·104 psi, σRy =5.85·103 psi).
x
ca) b)
Sensitivity analysis has shown that the most important parameters for time to impact of whipping pipe are wall thickness of pipe and internal pressure after pipe break. For the maximum of total reactions the most important parameters are area of cross section of concrete reinforcement bars and location of impact region.
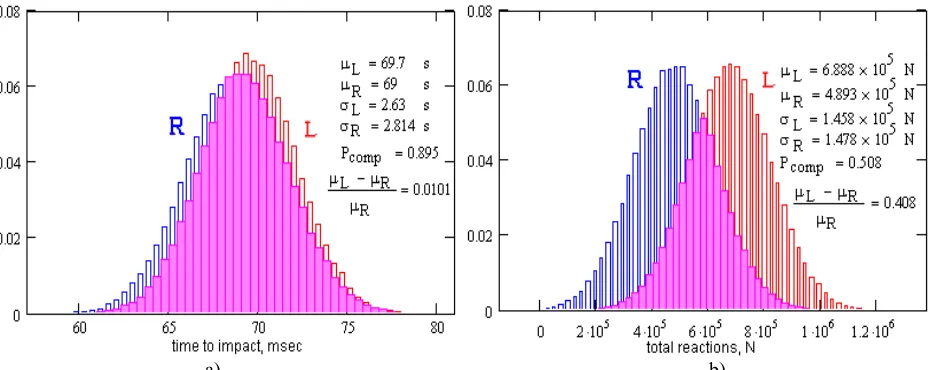
PDFs of the total reaction of concrete slab during impact for FEA and the experiment are shown in the Fig. 6. Normal distributions were assumed for all parameters. Since only one experiment was performed, the experimental result was taken to be the mean value for the PDF representing the experiment. The standard deviations for the PDF representing the experiment were here assumed based on engineering judgment of the accuracy of the measurements. For the time-to-impact, the probability of compliance was 0.895, and for the total reaction force, the probability of compliance was 0.508.
a) b)
Fig. 6 Comparison of analytical and experimental probability density functions for time-to-impact (a) and total reaction (b). L and R are FEA and experimental PDFs.
Presented results shown a probability of compliance between FEA and experimental results for total reactions. The sensitivity study showed that the most important influence on the final results are the fluid flow rate, which determines the fluid force inside the pipe, and the location of the impact.
SUMMARY
A structural reliability assessment of impact/contact applications was studied. The probabilistic evaluation was described for control, design and verification of structural impact/contact problems using reliability methods FORM and SORM. New probabilistic software, PRONEP, was developed for coupling with the deterministic FE program, NEPTUNE. Several examples that illustrate the reliability assessment of structural impact/contact mechanics are presented. These examples illustrate deterministic modeling and FE analysis, definition of random variables, description of failure criterion or limit state function, running the probabilistic analysis and reviewing the final results.
ACKNOWLEDGEMENT
The work of the U. S. authors was performed under the auspices of the U. S. Department of Energy, Office of International Nuclear Safety and Cooperation, under Contract W-31-109-Eng-38. The work of the first author was founded by IAEA as fellowship program at ANL.
NOMENCLATURES
P0 – parameters vector at initial point,
Pi,0 – ith parameter at initial point,
n m
m P P
F , P
F
∂ ∂
∂ ∂
∂ 2
µG, σG – mean and standard deviation of a new probability distribution function, which is the intersection of
load and strength functions
2 2
cr
r ,
r
-
calculated and critical value of squared differencesnp
–
numberofcomparedcouplepointsofapproximatedandFEAresults) ( 2
95 . 0 np
l
-
is the value associated with the 95% confidence region for np couple points in the modelaccordingtheχ2distribution
.
d
-
a vector of differencesV - is a matrix of covariance, which in case of un-correlated parameters can be written
:
2
n
σ
-
standard deviation of parameter or approximated function;n
∆
- difference between mean and current value of parameters,n, m - numbers of parameters and compared functions,
CVi,j – co-variances between parameters and output functions.
REFERENCES
1. Putko, M. M., Newman, P. A., Taylor III, A. C., Green, L. L., “Approach for uncertainty propagation and robust design in cfd using sensitivity derivatives”. American Institute of Aeronautics and Astronautics. AIAA 2001-2528, 2001.
2. Marek, P., Gustar, M., Anagnos, T., Simulation-based reliability assessment for structural engineers. CRC Press, Inc., 1996.
3. Maymon G., “Probability of failure of structures without a closed-form failure function”, Computers & Structures, Vol. 49, No.2, 1993, pp.301-313.
4. Mitteau J.C., “Error evaluations for the computation of failure probability in static structural reliability problems”,
Probabilistic Engineering Mechanics, Vol. 14, 1999, pp.119-135.
5. Cesare M.A., Sues R.H., “ProFES probabilistic finite element system bringing probabilistic mechanics to the desktop”, American Institute of Aeronautics and Astronautics, AIAA 99-1607, 1999.
6. Kulak, R. F., and Fiala, C., “NEPTUNE: A system of finite element programs for three-dimensional nonlinear analysis. Nuclear Engineering and Design”, Vol, 106, 1988, pp. 47-68.
7. Petkevicius, K., Kulak, R., and Marchertas, A., “A Pinball Method by Direct Localization of the Impact Area”,
Transactions of Structural Mechanics in Reactor Technology, SMiRT 17, Paper G350, 2003.
8. Garcia, J.L., Chouard, Ph. and Sermet, E., “Experimental studies of pipe impact on rigid restrains and concrete slabs”, Nuclear Engineering and Design, Vol. 77, 1984, pp. 357-368.