ABSTRACT
CHEN, PIN-CHIA, Spray and Atomization of Diesel and its Alternative Fuels from a Single Hole Injector Using a Common Rail Fuel Injection System. (Under the direction of Dr. Tiegang Fang).
Spray characteristics of transportation fuels play an important role in the combustion
performance. Generally, small droplet size and large spread area of fuel sprays are
considered as important factors to improve the atomization ability and enhance the
combustion efficiency. As petroleum fuel is expected to be depleted in a few decades, the
number of studies of finding alternative fuels that are competitive to replace the petroleum
fuel has arisen.
In this work, we tested the spray and atomization characteristics of commercial No. 2
diesel fuel, biodiesel derived from waste cooking oil (B100), 20% biodiesel blended diesel
fuel (B20), refined biofuel produced by university laboratory and civil aircraft jet fuel (Jet-A)
under the same experiment conditions and made comprehensive comparisons among these
fuels.
The microscopic spray properties such as droplet diameters and particle size
distributions were measured by a laser diffraction particle analyzing system while the
macroscopic spray properties such as spray tip penetrations and cone angles were acquired
from the images captured by a high speed digital video camera. All experiments were
conducted by employing a common rail high pressure fuel injection system with a
single-hole nozzle. Sprays were horizontally injected into atmosphere under room temperature and
The experimental results showed that pure waste cooking oil biodiesel (B100) and
Jet-A had different features compared with diesel fuel. Longer spray tip penetration was
observed for pure biodiesel due to its higher density, but also large droplets. Smaller droplet
sizes for Jet-A were believed caused by its relatively lower viscosity, however, the spray
volume of it is the smallest. B20 showed similar characteristics to diesel fuel but with slightly
larger droplet sizes and the properties of refined biofuel were closer to Jet-A. As a result, it is
difficult to find a certain kind of fuel which has both benefits of wide spray volume and small
droplet size.
In summary, the trade-off between spray volume and droplet size while using
different kinds of fuels remained a great challenge of deciding the fuel kind. However, this
struggling can be dealt with utilizing different injection strategies to reduce the differences. It
can be seen from the results that higher injection pressure achieved the task of producing
longer spray penetrations and smaller droplets for every kinds of fuels. Therefore, using
common rail to maintain a stable and high injection pressure has a benefit to the fuel
© Copyright 2011 by Pin-Chia Chen
Spray and Atomization of Diesel and its Alternative Fuels from a Single Hole Injector Using a Common Rail Fuel Injection System
by Pin-Chia Chen
A thesis submitted to the Graduate Faculty of North Carolina State University
in partial fulfillment of the requirements for the degree of
Master of Science
Mechanical Engineering
Raleigh, North Carolina
2012
APPROVED BY:
______________________________ Dr. Tiegang Fang
Committee Chair
________________________________ ______________________________
ii
DEDICATION
To my dearest familiesand
iii
BIOGRAPHY
Pin-Chia Chen was born in Kaohsiung City, Taiwan to parents Ming-Huei Chen and
Tsu Ho. He started his study of Mechanical Engineering at National Cheng Kung University,
Taiwan and received his Bachelor of Science degree in the Department of Mechanical
Engineering in 2008. After taking the obligatory military service for one year, he decided to
continue his study for the Master of Science degree in the US. In spring, 2010, he joined the
research group of Dr. Tiegang Fang in the Department of Mechanical and Aerospace
Engineering in North Carolina State University and focused his research on spray
characteristics of high pressure fuel injections. He finished his study in spring, 2012 and is
iv
ACKNOWLEDGMENTS
First of all, I would like to give appreciation to my research advisor, Dr. Tiegang
Fang for his kindness and patience of guiding students. Thank the senior students in Spray
and Engine Diagnostic Lab, Ji Zhang, Shan shan Yao, Dolanimi Ogunkoya and Wei Jin for
their unconditional help when I faced problems.
I am grateful to Dr. William Roberts and Dr. Alexei Saveliev for being my committee
members and giving helpful advice. The efforts of machine shop technician, Rufus
Richardson (Mr. Skip) on helping us building the experiment equipment are really
appreciated.
Special thanks for Dr. Foegeding and Dr. Farkas of department of food science for
their cooperation of being willing to let us use their instruments to measure the fuel
properties.
Best regards for my friends, Wilson Wang for being my best accompany and living
guide in NC State; Marco Yang and Hsieng-Tzer Tseng for helping everything of school and
life; Amy Huang and Ya-Lin Chen for preparing the delicious food during my experiment
and thesis writing time.
Finally, I want to thank Vivian Tseng for her sturdy support and careful concerns
v
TABLE OF CONTENTS
LIST OF TABLES ... vii
LIST OF FIGURES ... viii
1.Introduction ... 1
1.1.Study background ... 1
1.2.Biodiesel ... 2
1.3.Refined green fuel ... 3
1.4.Jet fuel ... 4
2.Literature review ... 6
2.1.Macroscopic spray properties ... 6
2.1.1.Diesel ... 6
2.1.2.Biodiesel ... 8
2.1.3.Jet fuel ... 9
2.2.Microscopic spray properties ... 10
2.2.1.Diesel ... 10
2.2.2.Biodiesel ... 11
2.2.3.Jet fuel ... 13
2.3.Summary ... 13
3.Experimental apparatus and measurement ... 15
3.1.Common rail high pressure injection system ... 15
3.2.Injection pressure control system ... 15
3.3.Particle size measurement system ... 16
3.4.Spray image acquisition system ... 17
3.5.Experiment difficulty ... 18
3.6.Investigation scope ... 19
4.Result and discussion ... 26
4.1.Microscopic spray properties ... 26
vi
4.1.2.Derived parameters ... 29
4.1.3.Relative span factor ... 30
4.1.4.Droplet size distribution ... 31
4.2.Macroscopic spray property ... 33
4.2.1.Spray tip penetration ... 33
4.2.2.Spray cone angle ... 35
4.2.3.Spray volume ... 36
4.2.4.Spray image ... 37
5.Conclusion ... 59
6.Future work ... 63
vii
LIST OF TABLES
Table 1.1 – Physical properties of fuels...5
Table 3.1 – Investigated spray properties in this study...20
viii
LIST OF FIGURES
Figure 1.1 – Fuels used in this study...5
Figure 3.1 – Experiment set up illustration...21
Figure 3.2 – LabVIEW PID loop interface and block diagram...22
Figure 3.3 – Pressure regulator circuit...22
Figure 3.4 – Injector driver circuit...23
Figure 3.5 – Example of detected signals...24
Figure 3.6 – Photo of spray interception device...24
Figure 3.7 – Definitions of spray tip penetration and cone angle...25
Figure 4.1 – SMDs of spray droplet with injection pressure...39
Figure 4.2 – SMDs of different fuels with time after start of injection trigger signal...39
Figure 4.3 – SMDs with different injection duration time...40
Figure 4.4 – SMDs with different spray axial distance from injector nozzle tip...40
Figure 4.5 – SMDs with different radial distance from the spray axis...41
Figure 4.6 – Dv10 of different fuels with injection pressure...42
Figure 4.7 – Dv10 of different fuels with time after start of injection trigger signal...42
Figure 4.8 – Dv50 of different fuels with injection pressure...43
Figure 4.9 – Dv50 of different fuels with time after start of injection trigger signal...43
Figure 4.10 – Dv90 of different fuels with injection pressure...44
Figure 4.11 – Dv90 of different fuels with time after start of injection trigger signal...44
ix
Figure 4.13 – Span factors of different fuels with time after start of injection trigger signal...
...45
Figure 4.14 – Diesel droplet size distribution, particle diameter with volume frequency...46
Figure 4.15 – Diesel droplet size distribution, particle diameter with cumulative volume...46
Figure 4.16 – Comparison of particle size distribution of different fuels under 300 bar injection pressure...47
Figure 4.17 – Comparison of particle size distribution of different fuels under 500 bar injection pressure...47
Figure 4.18 – Comparison of particle size distribution of different fuels under 800 bar injection pressure...48
Figure 4.19 – Comparison of particle size distribution of different fuels under 1000 bar injection pressure...48
Figure 4.20 – Spray tip penetration of different fuels at 300 bar with time after start of injection trigger signal...49
Figure 4.21 – Spray tip penetration of different fuels at 500 bar with time after start of injection trigger signal...49
Figure 4.22 – Spray tip penetration of different fuels at 800 bar with time after start of injection trigger signal...50
Figure 4.23 – Spray tip penetration of different fuels at 1000 bar with time after start of injection trigger signal...50
Figure 4.24 – Spray cone angle of different fuels at 300 bar with time after start of injection trigger signal...51
x
Figure 4.26 – Spray cone angle of different fuels at 800 bar with time after start of injection trigger signal...52
Figure 4.27 – Spray cone angle of different fuels at 1000 bar with time after start of injection trigger signal...52
Figure 4.28 – Spray volume of different fuels at 300 bar with time after start of injection trigger signal...53
Figure 4.29 – Spray volume of different fuels at 500 bar with time after start of injection trigger signal...53
Figure 4.30 – Spray volume of different fuels at 800 bar with time after start of injection trigger signal...54
Figure 4.31 – Spray volume of different fuels at 1000 bar with time after start of injection trigger signal...54
Figure 4.32 – Comparison of spray development images with time after injection trigger signal at 300 bar injection pressure...55
Figure 4.33 – Comparison of spray development images with time after injection trigger signal at 500 bar injection pressure...56
Figure 4.34 – Comparison of spray development images with time after injection trigger signal at 800 bar injection pressure...57
1
1.
Introduction
1.1.
Study background
Since the energy crises arose during the 1970’s, people around the world started to
notice the limited storage of fossil fuels under the stratum. Fossil fuels such as petroleum,
natural gas and coal have been covering the most industrial and commercial demands for
decades. However, as being the main supply of transportation fuels, petroleum was
estimated to be running out within 50 years [1]. On the other hand, burning fossil fuels in
internal combustion engine (ICE) generates greenhouse gases, for example, CO2 (carbon
dioxide), methane, N2O (nitrous oxide) and ozone into the atmosphere of earth, which
raise the global temperature. According to a U.S. Environmental Protection Agency (EPA)
report, more than 90% of greenhouse gas emissions come from the combustion of fossil
fuels [2]. Other air pollutants from burning fossil fuels such as SO2 (sulfur oxide) and
NOX (nitrogen oxide) fall back to Earth as acid rain, harming not only civilized
constructions but the entire natural environment. In order to retard the depletion of fossil
fuels and reduce the global warming effect, discovering alternative, renewable and
reliable fuel sources to replace the usage of fossil fuels had become an essential issue for
scientists.
In this study, we compared the differences of commercial No. 2 diesel fuel and
2
studied in this work are biodiesel derived from wasted cooking oil, refined biofuel
synthesized by laboratory of university and jet fuel purchased from a local civil airport.
1.2.
Biodiesel
Biodiesel is commonly produced by the transesterification process of vegetable oil
or animal fat feedstock such as peanut, rapeseed, canola, coconut, corn, palm, sunflower,
soybean, cottonseed, butterfat, beef tallow and lard, etc. The most common process uses
methanol to transfer these oil and fat into fatty acid methyl ester (FAME). As an
alternative of diesel fuels, biodiesel has been studied for many years. It is well-known
that biodiesel can reduce the greenhouse gases and pollutant emissions from the engine
because the oxygen components in biodiesel fuel promote combustion in a compression
ignition engine. Biodiesel has similar physical and chemical characteristics to
conventional diesel, which makes it used for diesel engines as different levels of blend
with diesel without engine modifications [3]. However, biodiesel has different properties
from conventional diesel, such as viscosity, density and surface tension. These
differences in properties impact the fuel atomization characteristics while applied in a
diesel engine. In the case of a direct injection diesel engine, the spray characteristics
through the injector nozzle determine the quality of air/fuel mixture which influences the
engine combustion performance and thermal efficiency [4]. Therefore, the investigation
of fuel spray characteristics is important for understanding the difference of engine
performance while using different kinds of fuels. The conventional biodiesel chosen in
3
at Pittsboro, North Carolina. Producing biodiesel based on waste cooking oil has better
environment protection and less land usage compared with other feed stocks. These
advantages are the main reasons of studying waste cooking oil biodiesel in this work.
1.3.
Refined green fuel
The refined green fuel (biofuel) used in this study was made by Renewable Energy
Research (RER) Laboratory in the Department of Mechanical and Aerospace Engineering,
North Carolina State University. The lab converted waste cooking oils and fats, which
composed mostly triglycerides, into high quality FFA (free fatty acid) and then turned the
hydrolyzed FFA into long-chain hydrocarbons through deoxygenation. FFA product from
continuous hydrolysis reaction, composed of various acids, was fed into a catalytic
fed-batch deoxygenation process at an average deoxygenation rate. With a constant
temperature and pressure over 100g of 5% Pd/C catalyst in H2 and He atmosphere, the
liquid product, which contained mostly heptadecane, was considered as a drop in
replacement for petroleum fuel [5]. This kind of biofuel has different properties compare
with conventional biodiesel derived from waste cooking oil, which is mainly composed
of FAME (fatty acid methyl ester). Due to the different compounds and more production
procedures, the newly refined cooking oil biofuel has relatively lower viscosity and
density than conventional biodiesel and is closer to those properties of diesel fuel.
The biofuel made by RER laboratory was used in vehicle diesel engine and jet
4
fuel. However, the spray characteristics and atomization ability of this fuel have not been
studied yet. Thus, we also studied the spray characteristics of jet fuel as a comparison.
1.4.
Jet fuel
Jet fuel is refined with a similar process to diesel fuel but has some different
properties, such as higher flash point and lower freezing point for safer usage in aircrafts.
It is also commonly used in ground support vehicles at airports, instead of diesel to
reduce the types of fuels. Recent studies of running jet fuels in diesel engines indicated
similar performance with diesel fuel [6]. However, the poor lubricating ability of jet fuel
in comparison to diesel raised the issues of significant wear and damages on fuel pumps
and other engine parts. Adding fuel additives in jet fuel is considered as a helpful method
to restore its lubricity [7]. Jet fuel has many types according to the purposes, such as Jet
A and Jet A-1 for civil aircrafts while JP-4, JP-5 and JP-8 for military supplies. The jet
fuel used for our work is Jet A purchased from a local airport. It has the lowest viscosity
and purest color but most pungent smell among the fuels in this study.
Table 1.1 lists the physical properties of different kinds of fuels used in this study.
Biodiesel has the largest values of density, viscosity and surface tension. Refined green
fuel has the lowest density but it is close to Jet-A, which has a very low viscosity.
Interestingly, the value of surface tension of B20 is not between biodiesel and diesel but
is the smallest among other fuels. Figure 1.1 shows the picture of the samples of these
fuels. They are Jet-A fuel, refined green fuel, waste cooking oil biodiesel (B100), 20%
5
Table 1.1 - Physical properties of fuels.
Figure 1.1- Picture of fuels used in this study.
Fuel Abbreviation Density (g/ml)(40˚C)
Viscosity (mm2/s)(40˚C)
Surface tension (mN/m)
Diesel D 0.83 2.65 30.3
Biodiesel B 0.87 4.60 34.7
20% biodiesel blend B20 0.84 3.04 27.7
Refined green fuel R 0.76 2.48 30.3
6
2.
Literature review
Studies of the fuel spray behavior can be classified into two categories: macroscopic
and microscopic. Macroscopic parameters such as tip penetration and cone angle can be
measured by direct visualization methods. Charge-coupled device (CCD) and intensified
charge-couple device (ICCD) cameras are commonly used in research labs for taking spray
images with a light source. Microscopic parameters such as velocity, droplet size and size
distribution can be surveyed through particle image velocimetry (PIV), phase Doppler
particle analyzer (PDPA) or laser diffraction particle analyzer (LDPA) systems [8].
2.1.
Macroscopic spray properties
2.1.1.
Diesel
The break-up length of diesel fuel spray injecting into high pressure gas was
measured by Yule et al.[9] . Their measurement results showed the break-up length of
diesel sprays are consistently 35% (about one third) of the length of whole spray
penetration, which is in a good agreement with published data. In addition, the break-up
length slightly increased with larger nozzle hole diameter but it decreased while using
higher injection pressure. Spray experiment and simulation results were compared by
Ryu et al. [10]. They found that the spray penetration was proportional to the injection
pressure by an exponent of 1/4. This is similar to the experimental result of Hiroyasu
[11]. The fuel evaporation and air fuel mixture result in their study indicated that the
influence of the ambient density on spray impingement was bigger than that of the
7
stroke. Spray formation from diesel fuel injection through a common rail multi-holed
injector was studied in a high pressure, high temperature cell using digital high speed
shadowgraph method by Klein-Douwel et al. [12]. Their results showed that the growth
of spray penetration was proportional to tb where t is the time after injection, and b = 0.57 ± 0.02, for a common rail pressure of 150 MPa and a gas density 33 kg/m3. The exact value of b is very sensitive to uncertainties in synchronization and the start of
injection determination. The spray cone angle was not constant, but varies with time
during an injection, mainly as a result of spray shape changes. Other authors [13] [14]
also derived equations describing the relation between spray penetration and time. An
investigation on the effect of injection pressure on the macroscopic spray characteristics
was developed by Delacourt et al. [15]. The experimental results showed that the diesel
spray tip penetration increased with time after injection and with increase in injection
pressure. On the other hand, the diesel spray angle was slightly influenced by injection
pressure and remained nearly constant during the whole injection process. Delacourt et
al. also evaluated the spray volume by combining the information of spray tip
penetration and spray angle, and observed that spray volume also increased with
injection pressure but seemed to reach a limit, due to the combined effects of increasing
penetration and constant cone angle. Suh et al. [16] studied the effect of injector driver
energizing duration (injection duration) and ambient pressure on diesel spray
characteristics. Their results illustrated that spray tip penetration increased
proportionally with injection pressure and duration time, and the spray became diluted
8
increasing ambient pressure. It can be seen that the higher drag force created by the
increased ambient gas density slowed the spray development. However, spray cone
angle was enhanced by higher ambient pressure.
2.1.2.
Biodiesel
Alam et al. [17] conducted experiments of investigating spray and combustion
visualization in an optical turbocharged direct-injection (DI) diesel engine. As a result,
the start of injection (SOI) and start of combustion (SOC) of neat biodiesel were the
earliest compared with diesel fuel and biodiesel blended fuels. These effects were
mainly due to the higher density and bulk modulus of biodiesel than diesel fuel. Spray
characteristics of diesel and biodiesels (derived from palm and cooked oil) under
ultra-high injection pressure (up to 300 MPa) were studied by Wang et al. [18]. This study
showed that biodiesels had longer spray tip penetrations than diesel fuel, due to higher
density and viscosity of biodiesel, but these differences became smaller at higher
ambient pressure (>30 kg/mm3). The Spray cone angles of biodiesels were smaller than that of diesel fuel, thus generated smaller spray area and volume. In the study of Gao et
al. [19], they indicated that although biodiesels were produced from different inedible
oils, their viscosities and densities and therefore their macroscopic spray characteristics
were similar among different feed stocks. Spray tip penetration and spray velocity
increased with increasing the blend ratios of biodiesel, but the spray cone angle
deceased. This result indicated a reduction in spray atomization quality while
9
on the physical properties such as kinematic viscosity, surface tension and cetane
number were investigated by Lee et al. [20]. They compared 10%, 20% and 40% of
unpolished rice and soybean oil blended fuel with diesel fuel and found out that those
physical properties all increased with increasing the blend ratio. However, the
differences of spray tip penetrations among biodiesel blended fuel and diesel were not
significant in low blending ratios (<40%). Lee and Yoon [21] also studied the effect of
temperature on the fuel properties of biodiesel and its blends. In their experimental
results, they found the specific gravity of biodiesel gradually decreased with increasing
the fuel temperature while viscosity and density decreased linearly with increasing the
fuel temperature.
2.1.3.
Jet fuel
Liquid-phase penetration length, vapor penetration, and ignition delay of JP-8
were measured in an optical combustion vessel and compared with diesel fuel by
Pickett and Hoogterp [6]. Results showed that the liquid-phase penetration of JP-8 was
less than that of diesel, due to the lower boiling point of JP-8. Dispite the more rapid
vaporization of JP-8, its vapor penetration rate matched that of diesel, therefore, no
significant ignition advances occurred. The ignition delay of 38-cetane-number JP-8
was 25-50% longer than 46-cetane-number #2 diesel fuel. Lee et al. [22] used the
Mie-scattering method to analyze the macroscopic spray characteristics of JP-8 and diesel
fuel in an optically-accessible single-cylinder heavy duty diesel engine equipped with a
10
tip penetration and wider spray angle than diesel fuel mainly due to the faster
vaporization characteristic of JP-8.
2.2.
Microscopic spray properties
2.2.1.
Diesel
An experimental investigation of diesel and coal-water slurry SMDs near the
spray tip region was conducted by Kihm et al. [23]. They used an automatic and precise
synchronization device to assist LDPA technique measuring spray SMDs within an
acceptable accuracy. Their experiment results of showed that average SMDs of both
fuels increased with ambient pressure and distance from the nozzle but decreased
significantly with increasing injection pressure. No significant effect of nozzle
diameter on SMD was found from 0.2 to 0.4 mm. Suh et al. [16] studied the effects of
injector driver type on spray and atomization characteristics using PDPA system. They
concluded that piezo-driven injection system had a smaller droplet size than
solenoid-driven injection system due to the more rapid opening of injector nozzle and
piezo-driven injector generated higher spray velocity at the beginning of injection. Yeom et al.
[24] analyzed the behavior of evaporating diesel fuel spray and made a comparison
between the liquid and vapor-phase of injected fuel. As a result, they found that in the
region of liquid-phase fuel, there were very small droplets in the spray periphery and
larger droplets in the spray tip because of droplets classification effected by Stokes
number (stk). Labs and Parker [25] characterized the interior properties of diesel spray
11
combusting spray could be divided into three periods: development period (0-0.75ms),
steady-state period (0.5-3.0ms), and spray dissipation (>3.0ms). Additionally, results
from both cases indicated that the central region of the jet is fuel-vapor saturated.
Droplets of small size (< 5µm) can only exist if the surrounding gas is saturated. The
trend of SMD over the spray was increased with radial and axial distance from the
nozzle tip. Thus, the smallest droplets were on axis and close to the injector tip.
2.2.2.
Biodiesel
An analytical study of atomization characteristics of 7 different kinds of
biodiesels were developed by Ejim [26]. Results from statistical analysis showed that
B100 coconut biodiesel had similar atomization characteristics to No. 2 diesel, because
of its similar properties, i.e. density, surface tension, and viscosity. Other biodiesels
such as palm, soybean, cottonseed, peanut and canola had slightly larger droplet sizes
compared with diesel. It implies these stocks of biodiesels and their blends can be used
in a DI engine with similar atomization properties, however, the different solvent
property of biodiesels can degrade the rubber gasket and hose in the fuel system, and
thus shorten the engine life. A similar work has been done by Allen et al. [27], they
mathematically analyzed and compared the atomization characteristics of 15 biodiesel
fuels by predicting their viscosities and surface tensions directly from their fatty acid
compositions. According to the comparison, they indicated that all kinds of biodiesels
have similar atomization characteristics, except for coconut and rapeseed biodiesels.
12
as jatropha oil, palm oil and used fried oil blended fuel and compared with 0# diesel. In
their result, SMD of blended fuels was greater than that of diesel, and spray was more
concentrated, due to the higher viscosity and surface tension of biodiesel, compared
with conventional diesel fuel. However, at lower blend ratios such as 5%, 10% and
20%, the spray properties of biodiesel were similar to diesel. Choi et al. [28]
investigated the droplet properties of fuel spray under different blending ratios of
biodiesel (palm oil). They found that the peak of the particle size volume frequency
distribution increased as increasing the injection pressure but the peak decreased while
increasing the blending ratio. Furthermore, the cumulative volume distribution moved
toward the large droplet direction when increasing the blending ratio. Choi also
indicated that as the biodiesel blending ratio increased, the SMD, mass median
diameter (MMD) and span factor increased. The deviation between spray size
distribution and mean diameter became large while increasing blending ratio, therefore
the spray size was distributed in a wider range than that of common diesel. Effect for
the combination of non-esterification biodiesel and fuel additive WDP and IPA were
also studied by Choi et al. through a LDPA system. When blending WDP and IPA with
biodiesel, atomization and spray characteristics were improved. Through their
experimental result, SMD of blended fuel, WDP 25% and biodiesel 75%, was 33.9%
13
2.2.3.
Jet fuel
Mao et al. [30] compared the SMD of diesel, Jet A and JP-8 under different
injection pressures from 1 to 50 psi. The compared result indicated the SMDs of Jet A
and JP-8 are both smaller than that of diesel fuel, however SMDs of jet fuels showed
the same decreasing trend as diesel while increasing the injection pressure. The smaller
SMDs of jet fuels were mainly due to their relatively lower viscosity than diesel fuel.
Another kind of droplet size experiment of Jet fuel was demonstrated by
Prommersberger et al. [31]. They developed a distillation curve model to calculate the
droplet size change among different fuels when exposing to a constant hot atmosphere
(800K) at 1 bar ambient pressure. Their result showed that the droplet sizes of Jet A and
JP-4 both decreased faster than that of diesel fuel. The droplet lifetimes for different
fuels varied mainly due to their different volatilities, the volatility was reversely
proportional to the molar weight and the normal boiling temperature of the fuels. The
higher boiling temperature of diesel prolonged the droplet existing time in a high
temperature atmosphere.
2.3.
Summary
We can sort a summary from the above literature review that the spray tip
penetration and spray volume of conventional diesel fuel increased along the time after
injection, the injection pressure and injection duration but decreased with ambient
pressure. The spray cone angle of diesel fuel remained constant during the injection.
14
with increasing the ambient pressure. The smallest SMDs were on the axis and near the
injector nozzle tip.
Biodiesels could be derived from many kinds of feed stocks but all have similar
atomization characteristics. Biodiesels had longer penetration and smaller cone angle
than diesel fuel. These differences became bigger while increasing the blend ratio. SMDs
of biodiesels are larger than that of diesel fuel due to the higher viscosities and surface
tensions.
Jet fuels were commonly used in airport transportation vehicles to follow the single
fuel usage policy. They have shorter spray tip penetrations and wider spray cone angles
compared with conventional diesel. These atomization characteristics and their relatively
smaller SMDs made themselves being evaporated faster.
In this study, we conducted experiments of waste cooking oil biodiesel and its 20%
blend, Jet-A fuel, and a newly refined biofuel which is also derived from waste cooking
oil and compare the effects of different injection pressures on their atomization
characteristics with commercial No. 2 diesel fuel. A comprehensive comparison of
macroscopic and microscopic spray characteristics of these fuels had been made to
illustrate the availability of biodiesel derived from waste cooking oil and the advantage of
the newly refinement process which generate clean and similar fuel suited for diesel and
15
3.
Experimental apparatus and measurement
3.1.
Common rail high pressure injection system
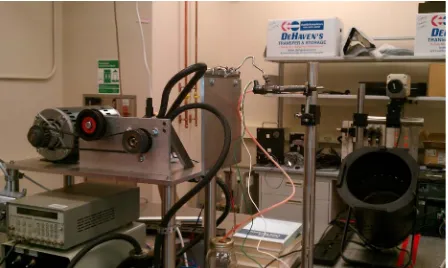
The injection system is illustrated in Figure 1. A first generation common rail fuel
system is built to control and maintain the fuel at a given constant injection pressure (up
to 1350 bar). The fuel stored in a fuel tank is delivered by a low pressure pump and
passes through a fuel filter (Caterpillar 1R-0751). The filtration media inside the filter is
able to remove 98 percent of any particles larger than 2 𝜇𝜇𝜇𝜇 in the fuel. The flitted fuel is transported to the high pressure pump (BOSCH CR/CP1S3/R70/10-16S) which is driven
by a 3 phases, 2 horsepower AC motor (GE K1496, maximum speed: 1725 rpm) with
timing belt and pulleys. An idler pulley was provided to enhance the tension of belt. The
common rail (BOSCH 0-445-214-122) has a pressure sensor (BOSCH 07-05-08-03135)
providing the pressure values inside the common rail. A specially machined single holed
injector nozzle with a diameter of 100 𝜇𝜇𝜇𝜇 is used in this work. The vibration caused by operating the AC motor and high pressure pump shook the equipment while conducting
experiment, therefore, an injector holder is added to the tip of injector to make injector
remains stable during the experiment.
3.2.
Injection pressure control system
The fuel pressure in the rail is controlled by a DAQ (NI 195509D-01L) with a PID
loop program built in LabVIEW 2010. The PID loop control software interface and block
diagram are illustrated in Figure 2. The DAQ acquires the pressure signal from the
16
operator. When the fuel pressure inside common rail is not consistent with the set
pressure, the PID controller changes the driving output voltage to the pressure regulator
circuit, which is shown in Figure 3, to control the opening and closing of the pressure
regulator solenoid valve and to adjust the amount of fuel returned from the high pressure
pump to the low pressure fuel lines. This way, the pressure in the rail can be maintained
at the pre-set levels. The activation of injection is controlled by a pulse/delay generator
(Stanford research system, Inc.), by which we were able to control the length of injection
signal (injection duration) and output a single shot signal to the injector driver circuit as
illustrated in Figure 4. The injector driver circuit then controls the opening and closing of
the injector valve. Safety equipment, a 3 amp fuse was placed between the power supply
and inlet voltage of injector driver circuit to prevent overloading of the circuit
components. The chosen injection pressures in this study are 300, 500, 800 and 1000 bar.
3.3.
Particle size measurement system
The particle size of fuel spray was measured by a LDPA (laser diffraction particle
analyzer) which is made by Malvern Instruments (SprayTec, MAL 1009475). In laser
diffraction particle size analysis, an ensemble of particles passes through a broadened
beam of laser light which scatters the incident light onto a Fourier lens. This lens focuses
the scattered light onto a detector array. By using an inversion algorithm, a particle size
distribution is inferred from the collected diffracted light data. Sizing particles with this
technique ensures full characteristics of the sample depending on accurate, reproducible
17
process the data. The data acquisition rate was set to be 10 kHz and 300 mm lens was
chosen for the size range (0.1 𝜇𝜇𝜇𝜇- 900 𝜇𝜇𝜇𝜇). The measurement trigger was connected to
the same pulse generator as the injector driver to make sure these two devices were
synchronously triggered. The measurement duration was 5 ms after the trigger which
covered the whole process of spray formation and atomization. The detector range was
selected 15-26 of 36 laser beams to eliminate false signals and avoid erroneous results as
illustrated in Figure 5. The LDPA instrument was located at different positions
downstream of the spray to study the droplet size distribution inside the spray structure.
The compared results will be discussed in later chapters.
At the beginning of an experiment, we got relative smaller droplet sizes compared
with literatures and suspected the dense stream in the center of spray would affect the
acquisition of laser diffraction signals. A spray interception device was added to help us
figure out the suspicion. As shown in Figure 6, the interception device cut the spray and
only allowed half of the spray volume passing through the lasers. The measurement
reading after mounted the interception device has just a little difference. Since the error
between two results was within 5%, we confidently believe that the original measurement
data is correct.
3.4.
Spray image acquisition system
A high speed camera (Phantom 4.3) with a Nikon® 50-mm f/1.8 lens was used to
capture the images of the fuel spray. It provided a frame rate of 7312 frames per second
18
light was used as the light source for the image acquisition. The measurement trigger is
also synchronous with the injector trigger. After an averaged injection delay of 0.5 ms,
the spray images were acquired up to 15 ms which is also the injection appearance
duration time. Spray tip penetration and spray cone angle data were calculated based on
the spray images as shown in Figure 7. Frames at every mini second after the trigger was
collected and analyzed by locating the pixel coordinates. The distance between injector
tip and the longest spot was defined as spray tip penetration. On the other hand, at 1/3 of
the length of penetration and the edge of spray stream and background, two sets of
coordinates were collected. The angle between these two spots and injector tip was
defined as spray cone angle. Spray volumes were calculated using the following equation
V =�𝜋𝜋
3� 𝑆𝑆3�𝑡𝑡𝑡𝑡𝑡𝑡2�
𝜃𝜃
2��
�1+2𝑡𝑡𝑡𝑡𝑡𝑡 �𝜃𝜃2��
�1+𝑡𝑡𝑡𝑡𝑡𝑡 �𝜃𝜃2��3
(3.1)
where S is the spray tip penetration and θ is the cone angle of spray. The spray volume V
is in cm3.
3.5.
Experiment difficulty
We have encountered several problems while building the experiment apparatus,
especially for the injection system. Problems happened in the reliabilities of the driving
motor, high pressure pump and injector due to inappropriate operations in the beginning
of conducting experiments. Trouble shooting of the damaged circuit components also
cost lots of time to figure them out and sometimes we even had to rebuild the whole
19
The detector range of LDPA system and the resolution of high speed camera both
affect the accuracy of measurement readings. We have tried many different parameters
and compared their accuracies before getting the final data shown in the result paragraph.
By solving the problems faced during experiments, we could get more information
about how the equipment work under different operation conditions and thus helped us to
avoid the same error happened again.
3.6.
Investigation scope
In this study, we investigate the different spray characteristics of conventional
diesel, traditional biodiesel derived from wasted cooking oil, 20% biodiesel blend, newly
refined biofuel (refined green fuel) and civil jet fuel (Jet-A). The experiment was
conducted with various pressure, injection duration and locations of spray for
microscopic spray properties. Macroscopic properties were investigated with different
pressure and fuels. Table 3.1 is a collation of these properties and Table 3.2 is a list of
20
Table 3.1 – Investigated spray properties in this study.
Table 3.2 – Experiment parameters.
Microscopic Properties
Macroscopic Properties
SMD
Tip penetration
Dv 10, Dv 50, Dv 90
Cone angle
Span Factor
Spray volume
Particle size distribution
Spray image
Equipment
Number
Particle size measurement system
SprayTec, MAL 1009475
Data acquisition rate 10 kHz
Lens 300 mm
Detect size range 0.1 - 900 μm
Detector range 15-26
Spray image acquisition system
Phantom 4.3
Lens Nikon® 50-mm f/1.8
Frame rate 7312 fps
Resolution 608×128
21
22
Figure 3.2 – LabVIEW PID loop interface and block diagram.
23
24
(a) Selected signal (b) Un-selected signal
Figure 3.5 – Example of detected signals.
25
26
4.
Result and discussion
4.1.
Microscopic spray properties
Results discussed in this part are the averaged values of 10 times of experiments for
each case. The standard deviations of these averaged results are varied but all under 5%
of the value presented.
4.1.1.
SMD
Sauter Mean Diameter (SMD, also known as D32) is equal to the sum of the
cube of all diameters of measured droplets divided by the sum of the square of all
diameters. This yields a characteristic droplet diameter which has a volume to surface
area ratio equal that of the entire spray [32]. Figure 4.1 shows the SMDs of different
fuels under 300, 500, 800 and 1000 bar injection pressures with injection duration 1.5
ms. The distance between laser beam locations of LDPA system and injector tip was 8
cm.
It is clear to see from Figure 4.1 that SMDs decrease as increasing the injection
pressure for all kinds of fuels. The SMD variation of different fuels is mainly
dominated by their viscosity and surface tension as listed in Table 1.1 The higher
viscosity leads to a lower fuel jet velocity, which generates larger droplet size of the
spray. The lower surface tension of fuel makes the spray easier to break into small
droplets. According to Figure 4.1, biodiesel has much bigger droplet size than diesel
27
biodiesel blending diesel fuel) is higher than diesel but its surface tension is lower.
These combined fuel properties affect the SMD of B20 by showing a close value to
diesel at lower pressures (<500 bar). Jet-A has the smallest droplet size due to its lowest
viscosity and surface tension as well. Refined green fuel has about the same surface
tension with diesel, however, it has smaller droplet size than diesel and is closer to
Jet-A. From the above observations, we found that the effect of viscosity is more
significant on the SMD than that of surface tension due to the fact that viscosity
variations among fuels are higher than that of surface tension.
SMDs at different times after the start of injection trigger signal up to 1.5 ms are
illustrated in Figure 4.2. The injection pressure for this was 800 bar and injection
duration was 1.5 ms. Under this injection strategy, all kinds of fuels experience an
injection delay of about 0.5 ms. Figure 4.2 shows that the SMDs do not change
apparently (the standard deviations were under 2%) for biodiesel and B20, but for
diesel, refined green fuel and Jet-A, SMDs slightly increase with time during the steady
state period (> 0.75ms) of spray. SMD of refined green fuel is very close to Jet-A under
higher injection pressure (>800 bar).
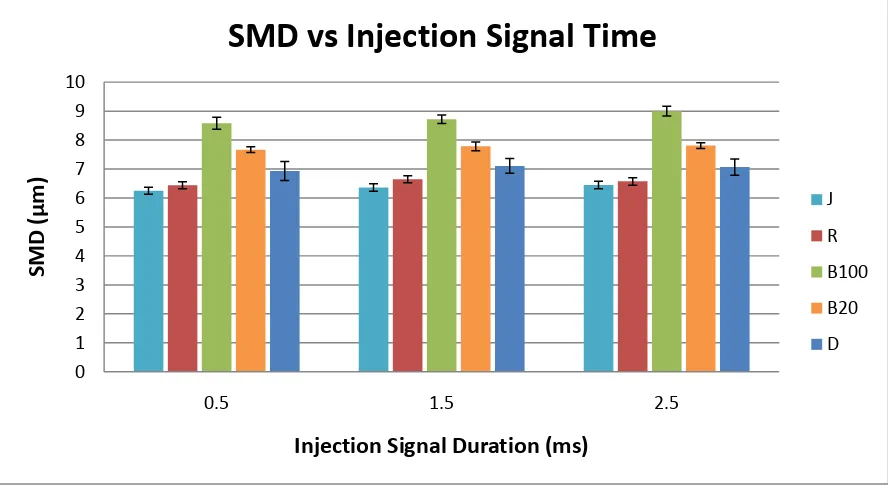
The effect of injection duration on SMD is shown in Figure 4.3 under 800 bar
injection pressure. The changes of SMDs are not obvious with different injection
durations, but comparing SMDs of 0.5 and 2.5 ms injection durations, we can still see a
28
Locating the laser beams of LDPA system at different positions can help us to
understand the droplet sizes distribution within spray plume and thus, we can simulate a
spray model according to these data in the future. Figure 4.4 and Figure 4.5
demonstrate the SMD changes at different spray axial and radial distances with 1.5 ms
injection duration. Under 800 bar injection pressure, the SMDs increase as increasing
the distance between the measuring point and injector nozzle tip due to the effect of
momentum loss of the droplets along the penetration development. The SMDs get
larger while moving away from the nozzle tip.
Figure 4.5 shows the variation of measured SMDs at different radial distances
from the axis of the spray under 500 bar injection pressure because the result difference
is not obvious at higher pressures for this experiment and the detector signal becomes
weak at distance further than 1 cm. The smallest SMDs are in the axis locations of
sprays and increase about 1 micron on the spray peripheries. This phenomenon is
considered due to the spray pressure dropped to ambient pressure on the peripheries
therefore decrease the effect of high injection pressure. At radial distance of 1 cm, it is
already outside of the spray periphery, the sprays become loose and dilute. Therefore,
their droplet sizes decrease again.
As a brief conclusion so far, SMDs from the largest to the smallest one in this
study are biodiesel (B100), 20% biodiesel blended diesel fuel (B20), diesel, refined
green fuel and jet-A, respectively. Smaller SMD of spray plays an important role in
29
4.1.2.
Derived parameters
There are other representative diameters, which can also be measured from
cumulative particle size distributions by the LDPA system, such as Dv10, Dv50 and
Dv90 are commonly used. These parameters are illustrated from Figure 4.6 to 4.11.
Dv10 (also known as D0.1) is defined as the value which 10% of the total
volume of the measured spray is made up of droplets with diameters smaller or equal to
it. Figure 4.6 shows the variation of Dv10 of different fuels with injection pressures.
The difference between diesel and B20 for Dv10s is larger than that of SMD.
Furthermore, Dv10 of Jet-A decreases slower than refined green fuel while increasing
injection pressure, thus it becomes larger than refined green fuel at higher injection
pressures (>800 bar). This phenomenon indicates that the effect of injection pressure on
droplet size distribution of Jet-A is smaller than that of refined green fuel. In Figure 4.7,
Dv10s show the same trend as SMDs with time after start of injection trigger, which is
varying around the averaged values and conventional diesel and jet fuel show the
largest variations.
Dv50 (also known as D0.5) is the same as the Volume Median Diameter (VMD)
or Mass Median Diameter (MMD). This is the representative diameter where 50% of
the total volume of the spray is made up of droplets with diameters larger than the
stated value and 50% is made up of droplets with diameters smaller than the stated
value. Figure 4.8 shows the Dv50 of different fuels under different injection pressures
30
that the calculated SMD of spray is slightly smaller than the droplet size of median
volume. In Figure 4.9, the variations of droplet sizes with time become smaller
compared with Dv10 indicating that volume or mass median diameters of spray
droplets are more stable after injection.
Dv90 (also known as D0.9), has a similar definition with Dv10, is the
representative diameter where 90% of the total volume of the liquid spray is made up of
droplets with diameters smaller than or equal to the stated value. As illustrated in
Figure 4.10, the frequency of large droplets increases with higher viscosity, and
frequency of small droplets are reduced. Dv90s of B20 are close to diesel fuel due to
the composition of B20 is similar to diesel. Interestingly, the standard deviations of
Dv90s were smaller than those of Dv10s and Dv50s indicating the diameter variation is
relatively smaller for larger droplets. Dv90s of different fuels as a function of time after
start of injection trigger is shown in Figure 4.11. The difference between refined green
fuel and Jet fuel becomes clear that refined green fuel has more large droplets than
Jet-A due to its higher viscosity and surface tension.
4.1.3.
Relative span factor
Relative Span Factor (RSF) is a dimensionless parameter indicative of the
uniformity of the drop size distribution. It is given by:
RSF =(𝐷𝐷𝑣𝑣90−𝐷𝐷𝑣𝑣10)
31
The smaller RSF means it is more consistent of droplet sizes in the spray. As
shown in Figure 4.12, span factors of the fuels used in this study perform the same
order as droplet sizes. Biodiesel is larger than B20, diesel fuel, and refined green fuel.
Jet-A is the smallest due to its smallest viscosity breaks the droplets into small sizes fast
and being stable at those sizes, thus have more uniform diameters than other fuels.
From Figure 4.12, it can be seen that averaged span factors decrease while increasing
the injection pressure and the variation of span factors of different fuels becomes large
as increasing the injection pressure as well.
Figure 4.13 shows the span factors as a function of time after start of injection
trigger under 800 bar injection pressure. An interesting phenomenon can be found is
that span factors are close to each other between 1.3 and 1.4 at the beginning of
injection, disperse, and decrease along time after injection trigger. Fuels with lower
viscosities and surface tensions such as diesel, refined green fuel and Jet-A are hard to
maintain their droplet sizes, and thus have wider variations of span factors compared
with biodiesel. B20 has the lowest surface tension but its relatively high viscosity
overcomes the attempt to easily break up. From this figure, we can tell that spray
droplet size distributed in a narrower range while increasing injection pressure. This
phenomenon will be more distinct in the discussion of next paragraph.
4.1.4.
Droplet size distribution
Understanding the distribution of droplet size with different diameters is another
32
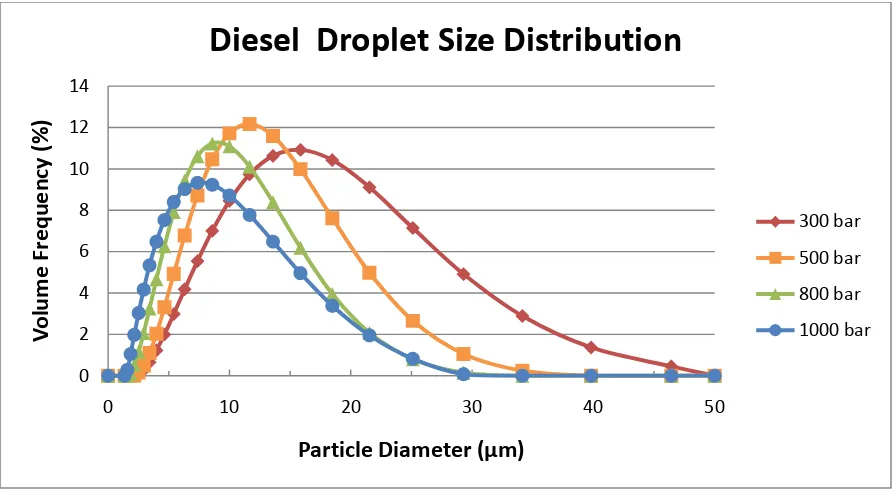
show the effect of injection pressure on droplet size distribution. These figures are
demonstrated by particle diameters with volume frequencies and cumulative volume
fractions for diesel fuel under different injection pressures. It can be seen that the
droplet size of diesel distributed in a wide range (from 1 to 50 µm) at 300 bar compared
with a narrower range (from 1 to 30 µm) at 1000 bar. Therefore, a decreasing droplet
size distribution range is observed while increasing the injection pressure. This also
explains the smaller span factors we find under higher injection pressure. In Figure 4.15,
the cumulative volumes of 1000 bar reaches 100% much earlier than that of 300 bar,
which indicates that the deviation of droplet diameters of higher injection pressure was
smaller than that of lower injection pressure.
Particle size distribution of other fuels compared with conventional diesel under
different injection pressures are illustrated from Figure 4.16 to Figure 4.19. At 300 bar,
biodiesel, B20 and refined green fuel shows similar distribution, slightly narrower than
diesel, but the peak of volume frequency of these fuels and diesel are all about 16 µm.
Jet-A shows distinct distribution in smaller diameter regions and its peak is about 13
µm for 300 bar injection pressure. At 500 bar, the droplet size distribution of biodiesel
and B20 are still narrower than diesel but that of refined green fuel becomes close to
diesel fuel, Jet-A remains in the smallest region. All distributions of different fuels
show a trend of moving toward the region of smaller particle diameter. For 800 bar, all
kinds of fuels have similar droplet size distributions with each other within a smaller
range (from 1 µm to 30 µm) with peaks around 10 µm. This is the reason we chose 800
33
droplet sizes of different fuels are the smallest under 800 injection pressure; therefore,
we can clearly distinguish the effect of changing other experiment conditions on droplet
size with this injection strategy. For the highest injection pressure used in this study,
1000 bar, the peaks of refined green fuel, diesel and Jet-A go down into smaller
diameter regions while the changes of biodiesel and B20 are not obvious compared
with 800 bar.
As an overview, the droplet sizes of all kinds of fuels used in this study
distributed in a relatively smaller region with increasing injection pressure. From the
results, it is interesting that although B20 has close composition and SMD with diesel
fuel, it shows similar frequencies of larger droplet diameter distribution with biodiesel.
4.2.
Macroscopic spray property
The results discussed in this part are the averaged values of 5 videos taken by high
speed camera. The images derived from high speed camera videos were analyzed by
image process software and calculated by Microsoft Excel. The standard deviations of
these results are within 5% of the averaged values.
4.2.1.
Spray tip penetration
Spray tip penetration is defined as the length of spray from injector tip to spray
tip. The longer penetration of spray at a specific time indicates the spray developed in a
faster velocity. Spray tip penetrations of the fuels used in this study at different
34
grow up with time after being injected from the injector and higher injection pressure
improves this growing. This trend can be easily observed by looking at diesel
penetration under 300 bar in Figure 4.20. At 1.5 ms after injection, it is 10 cm
compared with 14 cm under 1000 bar in Figure 4.23.
Biodiesel shows significantly longer penetration beyond other fuels at low
injection pressure (300 bar) but the difference becomes small at higher injection
pressures. This may be attributed to the fact that the relatively higher density and bulk
modulus of biodiesel make it hard to be compressed and being ejected from the nozzle
faster than other fuels, thus increasing injection pressure has less effect on biodiesel to
enhance the growing of spray tip penetration. Another interesting phenomenon is for
B20 which has the physical fuel properties between diesel and biodiesel. However, it
shows shorter penetrations than diesel under every injection pressures. This might due
to the higher viscosity of B20 raises the friction between fuel and the injector nozzle
surface, and thus drags the injection started from the nozzle and induce. But for pure
biodiesel, B100, this dragging effect is overcome by its large density and bulk modulus
which keep biodiesel has the longest penetration.
Refined green fuel and Jet-A have shorter spray tip penetration than diesel and
biodiesel due to their small density. Furthermore, it can be seen from the figures that
the spray tip penetration of refined green fuel is slightly shorter than Jet-A. We consider
this phenomenon is caused by the effect of the significantly smaller viscosity of Jet-A
35
mm2/s. The smaller viscosity reduces the friction between fuel and the surface of injector nozzle hole and makes the spray injected faster from the injector nozzle.
The spray speed of biodiesel under standard experiment condition (800 bar) is
faster than other fuels before 1 ms and the increasing slope seems reduced after that.
Diesel fuel and B20 have similar spray speed and that of refined green fuel is close to
Jet-A.
4.2.2.
Spray cone angle
The curved boundaries of spray induce difficulties to define and measure spray
cone angle. Several different definitions of spray cone angle exist in the literature and
we choose the angle of injector tip and two points on the spray periphery located at one
third of spray penetration as our measurement target. This definition was introduced by
He et al.[3] in their work of spray cone angle measurement. Figure 4.24 to Figure 4.27
illustrates the results of spray cone angle under different injection pressures with time
after the start of injection. As the spray penetrates, the droplets on the boundaries
become smaller and diffuse easily, generating a decreasing trend of spray cone angle.
The spray cone angles decrease rapidly after injection to about 10 degrees for
each injection pressure, however, with different reducing speed. As we can see from the
figures, the spray cone angles of the five fuels converge to a constant value (steady
state of the spray) at around 0.8 ms after start of injection at 300 bar injection pressure
and it becomes to 0.7 for 500 and 800 bar. Under 1000 bar injection pressure, the spray
36
that the distinction of different fuels after the convergence decreases while increasing
the injection pressure.
More obvious disparity of different fuels can be seen before their convergence.
The spray of biodiesel starts with the smallest cone angel according to its highest
viscosity reduces the atomization efficiency. This also explained that the larger initial
cone angle of diesel than B20. From the above-mentioned observations, we know that
increasing the biodiesel blend ratio reduces the cone angle of fuel spray due to the
increase of viscosity. As for refined green fuel and Jet-A, the effect of density is more
significant than the effect of viscosity and makes the cone angle of Jet-A being smaller
than refined green fuel under different injection pressures.
By collecting the comprehensive data of spray tip penetration and cone angle,
we can calculate the spray volume by using Equation (3.1) developed by Delacourt et al.
[15]. Spray volumes demonstrate a clear concept of the spray range and its atomization
property.
4.2.3.
Spray volume
Figure 4.28 – 4.31 evaluate the calculated spray volumes of different fuels used
in this study with time after the start of injection. The spray volumes develop as
exponential curves under low injection pressure (300 bar) and become proportional
when increasing the pressure. This is considered as the effect of higher injection
pressure delivers the fuel faster than low pressure and causes the spray reaches its
37
pressure by comparing Figure 4.28 and Figure 4.31. Spray volume of diesel increases
from 9 cm3 to 19 cm3 at 1.5 ms after the start of injection trigger.
The distribution of different fuels in spray volume has the same trend with spray
tip penetration, which is biodiesel, diesel, B20, Jet-A, and then refined green fuel, from
large to small, respectively. According to this result, we can see that spray volume is
mainly determined by the length of spray, since the variation of spray cone angles
among different fuels is not evident. In the aspect of comparing the mainly useful fuels
in real diesel engines such as diesel fuel, B20 and refined green fuel, the biofuels have
smaller spray volumes than petroleum fuel due to their shorter spray penetration. Thus,
we can make a short conclusion that biofuels spray in a narrower range than
conventional diesel fuel in room environment. The relatively impaired macroscopic
spray properties knock down the atomization ability of biofuels.
4.2.4.
Spray image
The spray images taken by the high speed camera capture the transient shape of
sprays at different timings. By collecting these images in the order of time after
injection, it clearly demonstrates the gradual formation of fuel sprays and gives a great
support to the calculated results of spray volumes discussed in the previous section.
These images are sorted in Figure 4.32- Figure 4.35 by 3 stages of time periods (0.7,
1.0, and 1.5 ms) after the injection trigger signal. The relatively lower viscosity and
38
0.7 ms are chosen instead to be presented. Proportional scales in centimeter are attached
in the left hand side of these figures to show the length of spray penetrations.
It can be seen from this figures that biodiesel has the largest spray projected
area and thus the largest spray volume due to its high viscosity, density and surface
tension. This phenomenon is most obvious in the images at 1.0 ms after injection
trigger. At this time period, the spray already achieves steady state and develops in a
constant velocity, therefore, the acceleration of increasing volume reduces after 1.0 ms.
This trend can be observed by comparing the volume difference of 0.7 ms and 1.5 ms
with 1.0 ms. The penetration slows down and the perturbation area increases at 1.5 ms.
An interesting characteristic of fuel sprays can be found in these figures are the
perturbation regions of sprays occur earlier at higher injection pressures by comparing
the images under different pressures at 0.7 ms after injection. This effect is due to the
higher spray speeds under high injection pressures make the sprays penetrate and
39
Figure 4.1- SMDs of spray droplet with injection pressure. (Axial distance: 8 cm, Radius distance: 0 cm, Injection Duration: 1.5 ms)
Figure 4.2- SMDs of different fuels with time after start of injection trigger signal. (Axial distance: 8 cm, Radius distance: 0 cm, Injection Pressure: 800 bar, Injection Duration: 1.5 ms)
0 2 4 6 8 10 12 14 16
300 500 800 1000
SM
D (
μm)
Injection Pressure (bar)
SMD vs Injection Pressure
J R B100 B20 D 4 5 6 7 8 9 10
0.4 0.6 0.8 1 1.2 1.4 1.6
SM
D (
μm)
Time after Start of Injection Trigger Signal (ms)
SMD vs Time
40
Figure 4.3- SMDs with different injection duration time. (Axial distance: 8 cm, Radius distance: 0 cm, Injection Pressure: 800 bar)
Figure 4.4- SMDs with different spray axial distance from injector nozzle tip. (Injection pressure: 800 bar, Injection duration: 1.5 ms, Radius distance: 0 cm)
0 1 2 3 4 5 6 7 8 9 10
0.5 1.5 2.5
SM
D (
μm)
Injection Signal Duration (ms)
SMD vs Injection Signal Time
J R B100 B20 D 0 2 4 6 8 10 12
6 8 10 12
SM
D (
μm)
Axial Distance from Nozzel Tip (cm)
SMD vs Spray Axial Distance
41
Figure 4.5- SMDs with different radial distance from the spray axis. (Axial distance: 8 cm, Injection pressure: 500 bar, Injection duration: 1.5 ms)
0 2 4 6 8 10 12 14
0 0.5 1
SM
D (
μm)
Radius Distance from the center of spray (cm)
SMD vs Spray Radial Distance
42
Figure 4.6- Dv10 of different fuels with injection pressure. (Axial distance: 8 cm, Radius distance: 0 cm, Injection duration: 1.5 ms)
Figure 4.7- Dv10 of different fuels with time after start of injection trigger signal. (Axial distance: 8 cm, Radius distance: 0 cm, Injection Pressure: 800 bar, Injection duration: 1.5 ms)
0 2 4 6 8 10 12
300 500 800 1000
D
v 10
(μ
m)
Injection Pressure (bar)
Dv 10 vs Pressure
J R B100 B20 D 2 3 4 5 6
0.4 0.6 0.8 1 1.2 1.4 1.6
D
v 10
(μ
m)
Time after Start of Injection Trigger Signal (ms)
Dv 10 vs Time
43
Figure 4.8- Dv50 of different fuels with injection pressures. (Axial distance: 8 cm, Radius distance: 0 cm, Injection duration: 1.5 ms)
Figure 4.9- Dv50 of different fuels with time after start of injection trigger signal. (Axial distance: 8 cm, Radius distance: 0 cm, Injection Pressure: 800 bar, Injection duration: 1.5 ms)
0 2 4 6 8 10 12 14 16 18
300 500 800 1000
D
v 50
(μ
m)
Injection Pressure (bar)
Dv 50 vs Pressure
J R B100 B20 D 5 6 7 8 9 10 11
0.4 0.6 0.8 1 1.2 1.4 1.6
D
v 50
(μ
m)
Time after Start of Injection Trigger Signal (ms)
Dv 50 vs Time
44
Figure 4.10- Dv90 of different fuels with injection pressure. (Axial distance: 8 cm, Radius distance: 0 cm, Injection duration: 1.5 ms)
Figure 4.11- Dv90 of different fuels with time after start of injection trigger signal. (Axial distance: 8 cm, Radius distance: 0 cm, Injection Pressure: 800 bar, Injection duration: 1.5 ms)
0 5 10 15 20 25 30
300 500 800 1000
D
v 90
(μ
m)
Injection Pressure (bar)
Dv 90 vs Pressure
J R B100 B20 D 11 12 13 14 15 16 17
0.4 0.6 0.8 1 1.2 1.4 1.6
D
v 90
(μ
m)
Time after Start of Injection Trigger Signal (ms)
Dv 90 vs Time
45
Figure 4.12- Span factors of different fuels with injection pressure. (Axial distance: 8 cm, Radius distance: 0 cm, Injection duration: 1.5 ms)
Figure 4.13- Span factors of different fuels with time after start of injection trigger signal. (Axial distance: 8 cm, Radius distance: 0 cm, Injection Pressure: 800 bar, Injection duration: 1.5 ms) 0.8 1 1.2 1.4 1.6
0 200 400 600 800 1000 1200
Sp
an
F
act
or
Injection Pressure (bar)
Span Factor vs Pressure
J R B100 B20 D 0.8 1 1.2 1.4
0.4 0.6 0.8 1 1.2 1.4 1.6
Sp
an
F
act
or
Time after Start of Injection Trigger Signal (ms)
Span Factor vs Time
46
Figure 4.14- Diesel droplet size distribution, particle diameter with volume frequency.
Figure 4.15- Diesel droplet size distribution, particle diameter with cumulative volume. 0 2 4 6 8 10 12 14
0 10 20 30 40 50
Vol ume F req uen cy (% )
Particle Diameter (μm)
Diesel Droplet Size Distribution
300 bar 500 bar 800 bar 1000 bar 0 20 40 60 80 100
0 10 20 30 40 50
Cu mu la ti ve V ol ume (% )
Particle Diameter (μm)