Rates of DNA Evolution in Drosophila Depend on Function and
Developmental Stage
of
Expression
Jeffrey R. Powell, Adalgisa Caccone,’ Jennifer M. Gleason and Loredana Nigro2
Department of Biology, Yale University, New Haven, Connecticut 0651 1 Manuscript received April 15, 1992
Accepted for publication October 7, 1992
ABSTRACT
DNA-sequence divergence of genes expressed in the embryonic stage was compared with the divergence of genes expressed in adults for 13 species of Drosophila representing various degrees of relatedness. DNA-DNA hybridization experiments were conducted using as tracers complementary DNA (cDNA) reversed transcribed from poly(A)+ mRNA isolated from different developmental stages. The results indicate: (1) cDNA is less diverged than total single-copy DNA; (2) cDNA sequences are not in the rapidly evolving fraction of the single-copy genome of Drosophila; (3) early in evolutionary divergence embryonic messages are about half as diverged as adult messages; sequence data from some of the species compared indicate this is likely due to differences in rates of silent substitutions in genes expressed at different stages of development; and (4) at greater evolutionary distance, the differences in embrvonic and adult messages disappear; this could be due to lineage- specific shifts in codon usage.
I
T is well established that the genomes of eukaryotic organisms are heterogeneous with respect to rate of DNA evolution. In some cases t h e basis of variabil- ity in rates is fairly obvious, for example introns gen- erally evolve faster than exons, pseudogenes evolve faster than active genes, etc. [for a review see LI, LUO a n d W u (1 985)l. More recently we (CACCONE, AMATO a n d POWELL 1988; POWELL a n d CACCONE 1989; CAC- CONE a n d POWELL 1990) and others (MARTIN a n d MEYEROWITZ 1986; WERMAN, DAVIDSON a n d BRIT- TEN 1990) have found extreme heterogeneity of rates within the genomes of Drosophila; these studies refer to the single-copy sequences and not to repetitiveDNA. An exceptionally rapidly evolving fraction is detected by its inability t o cross-hybridize under con- ditions requiring about 75% base matching to form stable hybrid DNA duplexes. Even between very closely related sibling species of Drosophila this frac- tion may represent up to 50% of the total single-copy genome. This rapidly evolving fraction can even be detected in hybridizations between genomes within a species (CACCONE, AMATO a n d POWELL 1987).
T o better understand DNA evolution in Drosophila we have performed DNA-DNA hybridization experi- ments between species pairs that vary in degrees of relatedness. We used seven very closely related species belonging to the melanogaster subgroup as well as the somewhat more distantly related Drosophila takahashii, which is a member of the melanogaster group but not
’
On leave from: Dipartimento di Biologia, I1 Universid di Roma, Rome, ‘On leave from: Dipartimento di Biologia, Universiti di Padova, Padua, I talItaly.
Genetics 133: 291-298 (February, 1993)
subgroup. We also included members of the two other major groups in the subgenus Sophophora: Drosophila pseudoobscura belonging to the obscura g r o u p a n d Drosophila willistoni of the willistoni group. The most distant comparisons were with two members of the subgenus Drosophila, Drosophila immigrans a n d Dro- sophila melanica.
We studied three different fractions of the genome: that part which is coding for amino acid sequences
(cDNA), the noncoding intergenic DNA (igDNA), and total single-copy DNA (scDNA). These three fractions were used as tracers in separate DNA-DNA hybridi- zation experiments. Elsewhere we have presented the results from using cDNA prepared from adult mRNA and emphasized the phylogenetic implications (CAC- CONE, GLEASON a n d POWELL 1992). Here we expand this data set to include messages expressed at a differ- ent developmental stage, the embryo. Because of their importance in controlling early development, genes specifically expressed in the embryo may be more constrained by selection compared to predominantly “housekeeping” genes expressed in the adult stage. This prediction has been partly confirmed in the present study, although the results are more complex than implied by this simple prediction.
MATERIALS AND METHODS
studies reported here, RNA prepared from embryos up to 12 hr post-oviposition was the starting material. The integ- rity of mRNA preparations was monitored by agarose-gel electrophoresis. Some preparations were further studied by probing Northern blots with a cDNA clone of the alcohol dehydrogenase gene; single bands of the appropriate size for intact Adh message were obtained, thus confirming little or no degradation. The recovered poly(A)+ RNA was re- verse transcribed (cDNA Synthesis System, BRL) using poly- dT primers. T o radioactively label the cDNA, ['HIdTTP and ['HIdCTP were included in the reaction. RNA was removed by alkaline denaturation, followed by neutraliza- tion and recovery of cDNA by Geneclean (American Bioan- alytical). The labeled cDNA was used as tracer in DNA- DNA hybridization experiments. Because the mass of cDNA formed is not known, the ratio of tracer to driver cannot be determined. However, because there are no complements for the tracer sequences, the precise ratio is not critical. We generally used 300,000 to 400,000 cpm of tracer, which we estimate represents much less than 0.1 Hg of DNA, to 10 r g driver DNA which was made single-copy. For all duplex and heteroduplex reassociations with a given tracer, the ratio of tracer to driver was identical (but unknown) and the reas- sociation Cot [(moles/liter) sec] was identical.
T o prepare intergenic or igDNA, an approximately 1,000-fold excess by mass of poly(A)+ RNA from adults was hybridized to labeled scDNA to equilibrium (Cot > 2,000). T h e resulting mixture was passed over a hydroxylapatite (HAP) column and the unbound single-stranded DNA was used as a tracer. This method of preparing tracer strips the total scDNA not only of the DNA coding for amino acids, but also largely of the introns and regions immediately adjacent to the coding regions. Thus, we call this prepara- tion intergenic DNA, igDNA.
DNA-DNA hybridizations were carried out using the TEACL (tetraethylammonium chloride) method. The con- ditions of hybridization, determination of median melting temperatures, determination of tracer lengths, correction for tracer lengths, and calculations of standard errors are described elsewhere (CACCONE, AMATO and POWELL 1987,
1988; CACCONE and POWELL 199 1). However, a few details are needed to appreciate the results presented here. First, during hybridization the conditions are adjusted to require approximately 75% base pair matching to form stable DNA duplexes. After coming to equilibrium (Cot > 2,000), the degree of reassociation is determined by digestion with S1 nuclease, a single-stranded specific nuclease. Digestion con- ditions were adjusted to assure no overdigestion, ie., no digestion of double-stranded duplexes. The relative amount of radioactivity in the digested us. undigested fraction is used to calculate the percent reassociation. It is important to note that this first S1 digestion will remove overhanging ends of reassociated duplexes as well as remove loops formed by insertion/deletion differences between sources of DNA. T h e determination of the thermal stability of the reasso- ciated duplexes is done in a buffer (2.4 M TEACL) which compensates for the difference in strength of A-T bonds relative to G-C bonds so that the thermal stability is inde- pendent of base composition (MELCHIOR and VON HIPPEL
1973; OROSZ and WETMUR 1977). Also the effect of duplex length on thermal stability is accounted for by measuring the length of the duplexes before melting and correcting appropriately (HALL et al. 1980; HUNT, HALL and BRITTEN
1981; POWELL and CACCONE 1990). The median melting temperature measured is designated tm; after correcting for duplex length we use the upper case Tm to signify this corrected tm. Our results will be presented as ATm, the change in median melting temperature of that fraction of
the hybridizing genomes which actually hybridized under the conditions used. We (CACCONE, DESALLE and POWELL 1988) and others (SPRINGER, DAVIDSON and BRITTEN 1992) have shown that this is an accurate linear measure of the degree of base pair mismatch between the sets of DNAs compared.
Two embryonic cDNA tracer preparations each were made from D. melanogaster and Drosophila yakuba, which will be referred to as MELl and MELP, and YAK1 and YAK2. Two igDNA tracers were prepared from D. mela- nogaster and are designated igMELl and igMEL2. Driver DNAs were prepared from adults of all species by standard methods of phenol-chloroform extraction (WERMAN, DAV- IDSON and BRITTEN 1990). When more than one driver preparation was used, they are designated by letters, e.g.,
MELa, MELb. In all cases a single strain of wild-type was used [see CACCONE, GLEASON and POWELL (1992) for details of strains].
RESULTS
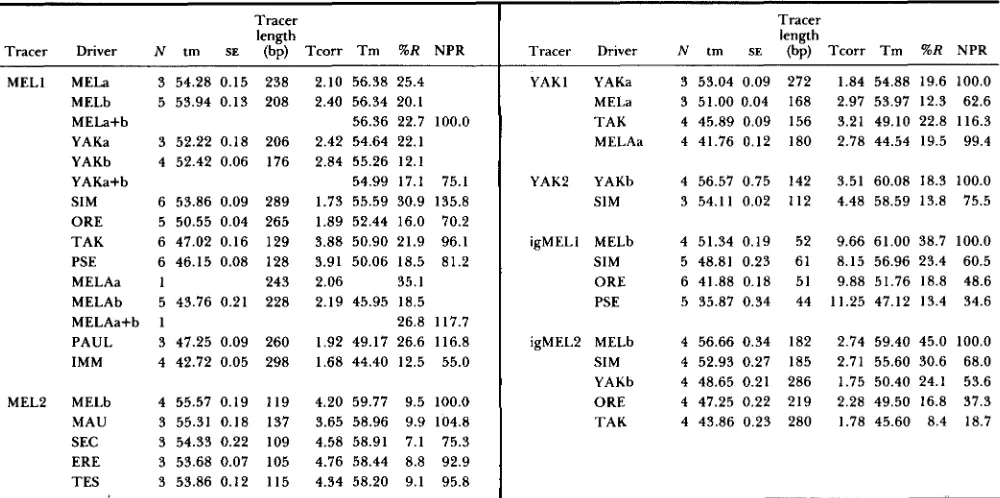
The primary data are presented in Table 1, several aspects of which warrant discussion. First, t h e sizes of the tracers (100-300 base pairs) for the cDNA exper- iments are appropriate for accurate measurement of Tms. However, the lengths are less than expected for intact message. This shorter size is the consequence of randomly shearing driver DNAs; it would be rare for a coding sequence to remain intact in the drivers. T h u s , t h e initial S1 nuclease treatment of tracer- driver duplexes after reassociation will "trim off" the ends of overhanging tracers hybridized to incomplete driver sequences. Second, the percent reassociations
(%R column) are less than typically seen in DNA hybridizations with total scDNA. This is also expected as the tracer cDNAs were not made single-copy. If some messages a r e in much higher frequency than others, they will reassociate faster than rare messages; the higher frequency messages may not be repre- sented in sufficient copies in the driver to allow com- plete reassociation. We do not know the ratio by mass or sequence frequency of tracer:driver in the reasso- ciation reactions (see discussion later). Note, however, that the cDNA tracer sequences do not have comple- ments in the tracer, so no tracer-tracer duplexes will be formed. However, we again emphasize, that in all homologous and heterologous reactions with the same tracer we used a constant amount of tracer (as deter- mined by counts/min) and the same amount of driver (determined by mass). Thus when normalized, the percent reassociations yields consistent a n d useful in- formation.
TABLE 1
Data from cDNA hybridization experiments
Tracer length
Tracer Driver N tm SE (bp) T c o r r T m %R NPR MELl
MEL2
MELa 3 54.28 0.15 238 MELb 5 53.94 0.13 208 MELa+b
YAKa 3 52.22 0.18 206 YAKb 4 52.42 0.06 176 YAKa+b
SIM 6 53.86 0.09 289 ORE 5 50.55 0.04 265 TAK 6 47.02 0.16 129 PSE 6 46.15 0.08 128
MELAa 1 243
MELAb 5 43.76 0.21 228 MELAa+b 1
PAUL 3 47.25 0.09 260 IMM 4 42.72 0.05 298
MELb 4 55.57 0.19 119 MAU 3 55.31 0.18 137 SEC 3 54.33 0.22 109 ERE 3 53.68 0.07 105 TES 3 53.86 0.12 115
2.10 56.38 25.4 2.40 56.34 20.1
56.36 22.7 100.0 2.42 54.64 22.1 2.84 55.26 12.1 54.99 17.1 75.1 1.73 55.59 30.9 135.8 1.89 52.44 16.0 70.2
3.88 50.90 21.9 96.1 3.91 50.06 18.5 81.2 2.06 35.1
2.19 45.95 18.5 26.8 117.7 1.92 49.17 26.6 116.8 1.68 44.40 12.5 55.0
4.20 59.77 9.5 100.0 3.65 58.96 9.9 104.8 4.58 58.91 7.1 75.3 4.76 58.44 8.8 92.9 4.34 58.20 9.1 95.8
Tracer length
Tracer Driver N tm SE (bp) T c o r r T m %R NPR
YAK1 YAKa MELa TAK MELAa
YAK2 YAKb SIM
igMELl MELb SIM ORE PSE
igMEL2 MELb SIM YAKb ORE TAK
3 53.04 0.09 272 1.84 54.88 19.6 100.0 3 51.00 0.04 168 2.97 53.97 12.3 62.6
4 45.89 0.09 156 3.21 49.10 22.8 116.3 4 41.76 0.12 180 2.78 44.54 19.5 99.4
4 56.57 0.75 142 3.51 60.08 18.3 100.0 3 54.11 0.02 112 4.48 58.59 13.8 75.5
4 51.34 0.19 52 9.66 61.00 38.7 100.0 5 48.81 0.23 61 8.15 56.96 23.4 60.5 6 41.88 0.18 51 9.88 51.76 18.8 48.6 5 35.87 0.34 44 11.25 47.12 13.4 34.6
4 56.66 0.34 182 2.74 59.40 45.0 100.0 4 52.93 0.27 185 2.71 55.60 30.6 68.0
4 48.65 0.21 286 1.75 50.40 24.1 53.6
4 47.25 0.22 219 2.28 49.50 16.8 37.3 4 43.86 0.23 280 1.78 45.60 8.4 18.7
I
The first four tracers are embryonic cDNA and the igMEL is for intergenic DNA. N is the number of replicate melts, tm is the median
melting temperature uncorrected, SE is the standard error of tm, Tcorr is temperature correction for tracer length, Tm is the tm corrected
for tracer length, % R is the percent of tracer reassociated, and NPR is the normalized percent reassociation with homoduplex equal to 100%.
Species abbreviations are MEL, melanogaster; YAK, yakuba; SIM, simulans; ORE, orena; TAK, takahashii; PSE, pseudoobscura; MELA, melanica;
PAUL, paulistorum; IMM, immigrans; MAU, mauritiana; SEC, sechellia; ERE, erecta; and TES, teissieri. When more than one tracer or driver
preparation was used in separate experiments, a number (tracer) or a letter (driver) is placed after the species abbreviations. When replicates
were done using more than one driver preparation, the means (indicated by a+b) were used in all analyses.
the same tracer were used. For ATm (in contrast to T m ) the different tracer preparations yielded very similar results.
For the igDNA experiments (lower part of Table 1) we again observe a tracer effect with igMELl yielding shorter tracer lengths and lower percent reas- sociations than igMEL2. T h e percent reassociations, 38-45%, of igDNA in homologous reassociations is lower than normally observed. We have no simple explanation for this. Nonetheless, the normalized per- cent reassociations in the last column are quite con- sistent and replicable between the two series of reas- sociations using different tracer preparations.
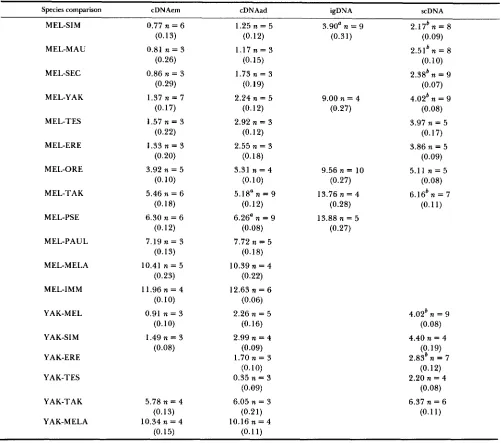
Table 2 summarizes these results by showing ATms for the data in Table 1 as well as for the similar studies using adult cDNAs (CACCONE, GLEASON and POWELL 1992) and total scDNA (CACCONE, AMATO and Pow- ELL 1988). All experiments were conducted in the same laboratory using virtually identical techniques,
so that minor differences due to methodologies should not compromise the comparisons across studies. T h e cDNA divergences are 50-70% less than the meas- ured divergence of hybridizing total scDNA. This is similar to the pattern ROBERTS et al. (1 985) found for sea urchins: cDNA was about 50% as diverged as total scDNA (both hybridizing and nonhybridizing in their
studies). Drosophila igDNA is more diverged than either scDNA or cDNA. However, the approximately twofold greater divergence of igDNA compared to scDNA (Table 3) is somewhat surprising as one would expect the coding sequences stripped from the scDNA to be only a minor part of the total and thus not to affect it quite so strongly. We take up this point again in the DISCUSSION.
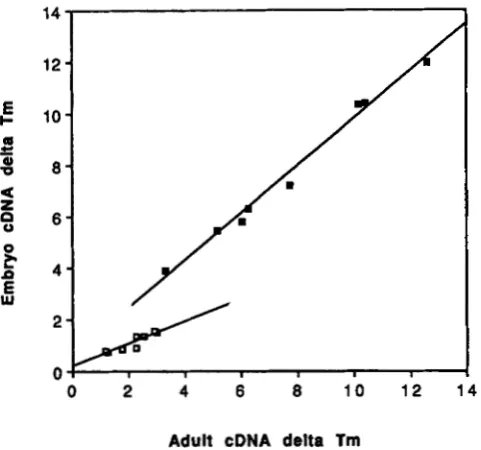
Perhaps the most remarkable finding is the pattern evident in the ratio of embryo-derived message diver- gence to adult-derived message divergence (Table 3). Up to a divergence of about ATm 3 (for adult cDNA), embryo-derived cDNAs are about half as diverged as adult-derived cDNA. At more distant comparisons above ATm 3, the two sets of messages are about equally diverged. This is graphically depicted in Fig- ure 1. T h e difference between adult and embryonic messages is probably even greater for stage-specific messages than the observed twofold difference be- cause messages expressed in both embryos and adults would tend to equalize the divergences measured.
TABLE 2
ATm determinations for embryonically expressed mRNA (cDNAem), adult expressed mRNA (cDNAad), intergenic DNA (igDNA) and single-copy DNA (=DNA) for the same pairs of species
Species comparison cDNAem cDNAad igDNA scDNA
MEL-SIM
MEL-MAU
MEL-SEC
MEL-YAK
MEL-TES
MEL-ERE
MEL-ORE
MEL-TAK
MEL-PSE
MEL-PAUL
MEL-MELA
MEL-IMM
YAK-MEL
YAK-SIM
YAK-ERE
YAK-TES
YAK-TAK
YAK-MELA
0.77 n = 6
(0.13)
0.81 n = 3
(0.26)
0.86 n = 3
(0.29)
1.37 n = 7
(0.17)
1.57 n = 3
(0.22)
(0.20)
(0.10)
1.33 n = 3
3.92 n = 5
5.46 n = 6
(0.18)
6.30 n = 6
(0.12)
7.19 n = 3
(0.13)
10.41 n = 5
(0.23)
11.96 n = 4
(0.10)
(0.10)
0.91 n = 3
1.49 n = 3
(0.08)
5.78 n = 4
(0.13)
10.34 n = 4
(0.15)
1.25 n = 5
(0.12)
1.17 n = 3
(0.15)
1.73 n = 3
(0.19)
(0.12)
(0.12)
2.24 n = 5
2.92 n = 3
2.55 n = 3
(0.18)
3.31 n = 4
(0.10)
(0.12)
5.18'12 = 9
6.26' n = 9
(0.08)
7.72 n = 5
(0.18)
10.39 n = 4
(0.22)
12.63 n = 6
(0.06)
2.26 n = 5
(0.16)
2.99 n = 4
1.70 n = 3
(0.09)
(0.10)
(0.09)
(0.21)
(0.1 1)
0.35 n = 3
6.05 n = 3
10.16 n = 4
3.90' n = 9
(0.31)
9.00 n = 4
(0.27)
9.56 n = 10
(0.27)
13.76 n = 4
(0.28)
13.88 n = 5
(0.27)
2.17'n = 8
(0.09)
(0.10)
2.51' n = 8
2.38' n = 9
(0.07)
4.02' n = 9
(0.08)
3.97 n = 5
(0.17)
3.86 n = 5
(0.09)
5 . 1 1 n = 5 (0.08)
6.16'n = 7
(0.1 1)
4.02' n = 9
(0.08)
4.40 n = 4
2.83'12 = 7
2.20 n = 4
(0.19)
(0.12)
(0.08)
6.37 n = 6
(0.1 1)
cDNAem and igDNA data are in this paper, cDNAad in CACCONE, GLEASON and POWELL (1992), and scDNA data in CACCONE, AMATO
a Replicate hybridizations were made.
'
Reciprocal hybridizations were performed.and POWELL ( 1 988). Standard errors are in parentheses; n is the number of replicate melts.
about 8 (for adult cDNA), there is virtually 100% NPR for cDNA. Note that in this figure the two sets of points (triangles and circles) are with respect to the ATm (x-axis) for two types of DNA, scDNA and cDNA. We have measured NPR for total scDNA for only the melanogaster group which is what is indicated in the line in Figure 2. T h e cDNA divergence is about half the scDNA divergence so the comparisons here are more dramatic than at first sight: the upper circles would be about twice as far to the right for the same species comparisons indicated by the circles and tri- angles. For example all the melanogaster subgroup
comparisons are in circle 1, while these same species comparisons are represented in all three triangles.
DISCUSSION
TABLE 3
Ratio of divergence of different types of DNA
Species cDNA
comparisons embryo:adult igDNA:scDNA - ~~~
MEL-SIM MEL-MAU MEL-SEC MEL-YAK MEL-TES MEL-ERE YAK-MEL YAK-SIM MEL-ORE MEL-TAK MEL-PSE MEL-PAUL MEL-MELA MEL-IMM YAK-TAK YAK-MELA
0.62 1.80
0.69 0.50
0.61 2.24
0.54 0.52 0.40 0.50
1.18 1.87
1.05 2.23
1.01 0.93
1
.oo
0.95
0.96
1.02
First column of numbers is ratio of ATm of cDNA from embryos
to A T m of cDNA from adults. Last column is the ratio of ATm for
igDNA to ATm for total scDNA. In species comparison column,
tracer is given first followed by driver.
14
12
E
10-
c 68
s
8
6
$ 4
a
z
0
W E
2
I /
Adult cDNA delta Tm
FIGURE 1 .-Relationship of divergence of mRNAs expressed at different developmental stages. The slope of the open boxes is for
closely related species and is about 0.5 (Table 2) while at greater
distance (closed boxes) the divergence is about the same for the two
sets of messages as indicated by a slope of about one. The slopes of
the linear regressions are significantly different from one another
a t the P < 0.01 level.
sages up to a distance of about ATm 3. T h e two YAK embryo tracers also confirm the findings in the recip- rocal tests although only one of the YAK tracers was used for both close and more distant species. In the primary data concerning the adult message diver- gence presented in CACCONE, GLEASON and POWELL
(1 992), multiple tracer preparations and reciprocals also confirm the robustness of the results for adult
0 1 0
0
0 0
K
z
n
2o
1
0
z
0 2 4 6 8 10 1 2 1 4
Delta Tm
FIGURE 2.-Normalized percent reassociation (NPR) us. ATm
for either scDNA (A) or adult cDNA (0). Each point represents the
average for the interval (e.g., 0-3, 3-6, etc.). The ATm for the
triangles corresponds to the fraction of total scDNA which hybrid-
ized; data are only for the melanagaster subgroup (CACCONE, AMATO
and POWELL 1988). The x-axis scale is the same for cDNA, but the
species comparisons are not vertically identical, e.g., all melanagaster
group species represented in the triangles are included in circle 1.
messages. Thus it is highly unlikely that the patterns noted in Table 3 and Figure 1 are experimental artifacts. For closely related species, embryonically expressed mRNA is about half as diverged as adult expressed mRNA; for more distantly related species, the divergence of the two sets of messages is about the same.
transcripts due to lack of sufficient numbers of driver complements. While this phenomenon would act to even the effect of heterogeneity in abundance, it is still likely the results are biased toward highly ex- pressed genes. In their study of sea urchins ROBERTS et al. (1985) used tracers in which the inequality in relative abundance of cDNAs was reduced by hybrid- izing the cDNAs to single-copy nuclear DNA and then using the bound cDNA as tracer. This would make the relative abundance the same as the representation in the nuclear genome. They found no difference between results with cDNAs made more equally abun- dant compared with total cDNA reversed transcribed from total message.
T h e second caveat is that there is evidence that not all messages in Drosophila are polyadenylated (ZIM-
MERMAN, FOUTS and MANNING 1980). Obviously, be-
cause we prepared the cDNA from material binding to oligo-dT columns, only polyadenylated messages have been studied.
Types of substitutions: In trying to understand this pattern it is instructive to compare these results to the available sequence data. By far more genes have been sequenced for the species pair MEL-SIM than for any other species pair. WERMAN, DAVIDSON and BRITTEN ( 1 990) compared five sequenced genes in both species and found that silent substitution divergence averaged about 9% (range 5.9-1 1%) with an average of about 0.3% replacement substitutions. Because silent substi- tutions represent about one-fifth to one-quarter of all possible substitutions, the average divergence across all the coding sequence is about 2%. Since there is no reason to think that these five genes are not repre- sentative of coding genes in general and all are ex- pressed in the adult, this divergence should be com- parable to our adult mRNA divergence of ATm 1.25 between MEL and SIM (Table 2). The conversion of ATm to base pair mismatch has been studied empiri- cally and the measured conversions range from 1 C representing 1.3-1.7% base pair mismatch (CACCONE, DESALLE and POWELL 1988; SPRINGER, DAVIDSON and BRITTEN 1992). Thus the ATm of 1.25 for adult cDNA divergence corresponds very well with the 2% divergence from sequence data.
The sequence data just discussed lead to another assertion: the majority (>95%) of substitutions in the coding regions between MEL and SIM, and presum- ably between any other pair of similarly distant spe- cies, are silent substitutions. Thus we are left with trying to understand why silent substitutions in em- bryonically expressed messages are more constrained than in adult expressed messages. A favored expla- nation for constraints on synonymous substitutions is the availability of iso-accepting tRNAs [e.g., GRAN- THAM et al. (1 98 l ) , GROSJEAN and FIERS (1 982), IKE- MURA (1 985), and ANDERSON and KURLAND (1990)l.
For genes which require high levels or rapid produc- tion of product, translation may be the limiting step. Consequently, codons corresponding to the most abundant tRNAs may be selectively favored. This leads to the prediction of lower rates of silent substi- tutions in genes showing more codon usage bias than in genes showing less bias, as has been demonstrated for both bacteria (SHARP and LI 1987) and Drosophila (SHARP and LI 1989). If this accounts for our obser- vation of embryo-derived messages being less diver- gent than adult-derived messages,, there are two pre- dictions: (1) embryonically expressed genes should show more codon usage bias than adult expressed genes and (2) there may be differences in tRNA pools in embryos compared to adults. For the first predic- tion, there are insufficient data to make any definitive statements [e.g., SHIELDS et al. (1988)l. However, for the second prediction some relevant data on devel- opmental changes in tRNA pools in Drosophila do exist. For at least four amino acids (Tyr, His, Asp and Asn) there are significant developmental changes in isoacceptor pools (WHITE et al. 1973). Guanosine (G) in the first anti-codon position in immature stages is modified to queuosine (Q) in adults (OWENBY, STUL-
BERG and JACOBSON 1979). It is known that Q is less
specific than G in its translational properties, i e . , Q allows more “wobble” (MEIER et al. 1985). Thus the developmental shifts in these four tRNAs are in the directions predicted from our results: in early stages the tRNAs are more specific than in later stages and thus may induce more codon constraints in earlier expressed genes.
within the genus Drosophila (STARMER and SULLIVAN 1989; ANDERSON, CAREW and POWELL 1992).
Why is igDNA so diverged? Since DNA actually encoding amino acid sequences is a small part of a eukaryotic genome, why should we have seen such a large effect when we removed coding sequences from the total scDNA? igDNA is about twice as diverged as scDNA (Table 3). It is important to recall that the ATms reported for scDNA are actually only for that fraction of scDNA which hybridizes under conditions requiring about 75% or more base pair matching to form stable duplexes. Thus the most diverged parts of the genome are not considered; this may be a very substantial fraction of the genome up to 50% or more in the species comparisons here (see Figure 2). Thus the fraction of the hybridizing scDNA which is coding is much greater than it would be in total intact nuclear DNA. Another part of the explanation for the large effect is that the method we used to prepare igDNA removes more than just the coding DNA. It also removes introns and other regions adjacent to coding sequences. This is because when cDNA hybridizes to nuclear DNA, introns form loops; HAP columns would bind both the paired coding region and loops attached. Similarly, DNA adjacent to the boundary of coding regions will also be removed by HAP so we would expect, on average, much of the immediately 5’ and 3’ regions to also be removed. T h e extent of removal of scDNA when hybridized to cDNA con- firms this explanation. One might expect coding DNA to comprise no more that 10% of scDNA yet the hybridization to cDNA resulted in about 50% of the total scDNA binding to HAP columns. If introns and the DNA immediately adjacent to coding regions, as well as the coding regions themselves, represent the more conserved part of the total scDNA, then prepar- ing the igDNA in this manner will have a greater effect than if only exonic DNA was removed.
Are coding sequences part of the slow evolving fraction? As mentioned in the introduction, a portion of the Drosophila genome evolves very rapidly. This is detected by its inability to cross-hybridize under conditions requiring about 75% base pairing to form stable hybrids (CACCONE, AMATO and POWELL 1988; POWELL and CACCONE 1989; CACCONE and POWELL 1990; WERMAN, DAVIDSON and BRITTEN 1990). When total scDNA is hybridized between even two closely related species like MEL and SIM, 35% of the DNA does not form stable duplexes. At greater dis- tance, the nonhybridizing fraction may reach 70% or more (e.g., SCHULZE and LEE 1986). T h e triangles in Figure 2 illustrate the relationship between ATm and the fraction of the total single-copy genome which cross-hybridizes indicated by NPR.
The circles in Figure 2, which represent the degree of hybridization of cDNA, indicate coding sequences
are not part of the fast-evolving, non-hybridizing frac- tion; at least if some coding sequences are in that fraction, we have not detected them. This is consistent with sequence data. T h e only gene which has been sequenced across enough species for comparison is A d h . SULLIVAN, ATKINSON and STARMER (1 990) sum- marize the results. For members of the melanogaster group the average divergence (both synonymous and nonsynonymous) across the coding region is 5% or less (these species comparisons are in the left most circle in Figure 2). Comparisons of MEL to the other members of Sophophora outside the melanogaster group indicate a coding sequence divergence of about 19% for A d h (corresponding to circles 2 and 3 in Figure 2). Only when comparing members of Sopho- phora to the subgenus Drosophila is there enough divergence (20-28%) in the coding region of Adh that we would expect it to have difficulty hybridizing un- der the conditions used. Circles 4 and 5 in Figure 2 are for these inter-subgeneric comparisons where we begin to see cDNA hybridization drop off.
This interpretation would seem to be inconsistent with the conclusion of WERMAN, DAVIDSON and BRIT-
TEN (1 990) who argued that coding sequences fell into an intermediate range of divergence. They based their conclusion on the observed 9% divergence of silent substitutions in coding sequences for the species pair MEL-SIM. T h e fast-evolving fraction is >20% vdi- verged and the hybridizing scDNA is only 2-4% di- verged between MEL and SIM. However, if one con- siders that only about one quarter of substitutions are silent, then across the entire coding sequence, the average divergence would place these sequences in the slow evolving fraction (as we argued above). While not explicitly stated, WERMAN, DAVIDSON and BRIT- TEN (1 990) were apparently referring to the underly- ing mutation rate in the regions of the genome which contain coding sequences (R. J. BRITTEN, personal communication). If the synonymous substitution rate reflects the neutral mutation rate, coding DNA is predicted to be located in regions experiencing a mutation rate leading to intermediate divergence, i e . ,
for MEL-SIM, divergence greater than the 2-4% divergence of the conserved fraction and less than over 20% divergence of the fast evolving fraction. But this would only be for neutral mutations. The average divergence across the whole coding region is less and likely reflects selective constraints.
while for the same species pairs as little as 15% or less of the total scDNA hybridizes (CACCONE, AMATO and POWELL 1988; SCHULTZE and LEE 1986). For closely related species, we also noted a difference in diver- gence of genes expressed at different developmental stages. Considering the close relationships among the species compared, one would expect the great major- ity of differences to reside in rates of synonymous substitutions. Thus we have the first evidence of pos- sible changes in silent substitution rate dependent upon the stage of expression. T h e testable prediction is that there may be changes in iso-accepting tRNA pools during development. T h e difference in diver- gence of adult and embryo messages is not observed at greater distances suggesting lineage-specific changes in codon usage occur rather rapidly in evo- lutionary time and may cause spurts in synonymous substitution rates.
We thank Yale University for financial support. PAUL SHARP,
ROY BRITTEN and DAVID HALE made critical comments on this
work which greatly helped in clarifying certain issues; NEIL BLACK-
STONE helped with the statistical analysis. J.M.G. was supported by a National Institutes of Health Genetics Training Grant, and A.C. and L.N. thank their home institutions for generous leave.
L I T E R A T U R E C I T E D
ANDERSON, C. L., E. A. CAREW and J. R. POWELL, 1992 Evolution
of the Adh locus in the Drosophila willistoni group: the loss of
an intron and shift in codon usage. Mol. Biol. Evol. (in press).
ANDERSSON, S. G. E., and C. G. KURLAND, 1990 Codon prefer-
ences in free-living microorganisms. Microbiol. Rev. 54: 198-
210.
CACCONE, A,, G. D. AMATO and J. R. POWELL, 1987 Intraspecific
DNA divergence in Drosophila: a study on parthenogenetic.
Mol. Biol. Evol. 4: 343-350.
CACCONE, A,, G. D. AMATO and J. R. POWELL, 1988 Rates and
patterns of scnDNA and mtDNA divergence within the Dro-
sophila melanogaster subgroup. Genetics 118: 671-683.
CACCONE, A,, R. DESALLE and J. R. POWELL, 1988 Calibration of
the change in thermal stability of DNA duplexes and degree
of base pair mismatch. J. Mol. Evol. 27: 212-2 16.
CACCONE, A,, J. ,M. GLEASON and J. R. POWELL,
1992 Complementary DNA-DNA hybridization in Drosoph-
CACCONE, A,, and J. R. POWELL, 1990 Extreme rates and heter-
ogeneity in insect DNA evolution. J. Mol. Evol. 30: 273-280.
GACCONE, A , , and J. R. POWELL, 1991 A protocol for the TEACL
method of DNA-DNA hybridization, pp. 385-407 in Molecular
Techniques in Taxonomy, edited by G. HEWITT, A. JOHNSTON
and J. YOUNG. Springer Verlag, Heidelberg.
GRANTHAM, R., C. GAUTIER, M. GOUY and R. MERCIER,
1981 Codon catalog usage is a genome strategy modulated
for gene expressivity. Nucleic Acids Res. 9 r43-r74.
GROSJEAN, H., and W. FIERS, 1982 Preferential codon usage in
prokaryotic genes: the optimal codon-anticodon interaction energy and the selective codon usage in efficiently expressed
genes. Gene 18: 199-209.
HALL, T. J., J. W. GRULA, E. H. DAVIDSON and R. J. BRITTEN,
1980 Evolution of sea urchin non-repetitive DNA. J. Mol.
Evol. 16: 95-1 10.
HUNT, J,A., T. J. HALL and R. J. BRITTEN, 1981 Evolutionary
distance in Hawaiian Drosophila measured by DNA reassocia-
tion. J. Mol. Evol. 17: 361-367.
ila. J. Mol. EvoI. 3 4 130-140.
IKEMURA, T., 1985 Codon usage and tRNA content in unicellular
and multicellular organisms. Mol. Biol. Evol. 2: 13-34.
LI, W.-H., C.-C. LUO and C.-I. Ww, 1985 Evolution of DNA
sequences, pp. 1-94 in Molecular Evolutionary Genetics, edited
by R. J. MACINTYRE. Plenum Press, New York.
MARTIN, C. H., and E. M. MEYEROWITZ, 1986 Characterization
of boundaries between adjacent rapidly and slowly evolving
regions in Drosophila. Proc. Natl. Acad. Sci. USA 83: 8654-
8658.
MEIR, F., B. SUTER, H. GROSJEAN, G. DEITH and E. KUBLI,
1985 Queuosine modification of the wobble base in tRNA””
influences “in vivo” decoding properties. EMBO J. 4 823-827.
MELCHIOR, W. B., and P. H. VON HIPPEL, 1973 Alteration of the
relative stability of dA-dT and dG-dC base pairs in DNA. Proc.
Natl. Acad. Sci. USA 7 0 298-302.
OHTA, T., 1987 Very slightly deleterious mutations and the mo-
lecular clock. J. Mol. Evol. 26: 1-6.
OROSZ, J. M . , and J. G. WETMUR, 1977 DNA melting temperature
and renaturation rates in concentrated alkylammonium salt
solutions. Biopolymers 1 6 1183-1 199.
OWENBY, R. K., M. P. STULBERC and K. B. JACOBSON,
1979 Alteration of the Q family of transfer RNAs in adult
Drosophila melanogaster as a function of age, nutrition, and
genotype. Mech. Ageing Dev. 11: 91-103.
POWELL, J. R., and A. CACCONE, 1989 Intraspecific and interspe-
cific genetic variation in Drosophila. Genome 31: 233-238.
POWELL, J. R., and A. CACCONE, 1990 The TEACL method of
DNA-DNA hybridization: technical considerations. J. Mol.
Evol. 30: 267-272.
ROBERTS, J. W., S. A. JOHNSON, P. KIER, T. J. HALL, E. H. DAVIDSON
and R. J. BRITTEN, 1985 Evolutionary conservation of DNA
sequences expressed in sea urchin eggs and early embryos. J.
Mol. Evol. 22: 99-107.
SCHULZE, D. H., and C. S. LEE, 1986 DNA sequence comparison
among closely related Drosophila species of the mulleri complex.
Genetics 113: 287-303.
SHARP, P. M., and W.-H. LI, 1987 The rate of synonymous
substitution in enterobacterial genes is inversely related to
codon usage bias. Mol. Biol. Evol. 4: 222-230.
SHARP, P. M . , and W.-H. LI, 1989 On the rate of DNA sequence
evolution in Drosophila. J. Mol. Evol. 2 8 398-402.
SHIELDS, D. C., 1990 Switches in species-specific codon prefer-
ences: the influence of mutation biases. J. Mol. Evol. 31: 71-
80.
SHIELDS, D. C., P. M. SHARP, D. G. HIGCINS and F. WRIGHT,
1988 “Silent” sites in Drosophila genes are not neutral: evi-
dence of selection among synonymous codons. Mol. Biol. Evol.
SPRINGER, M . , E. H. DAVIDSON and R. J. BRITTEN,
1992 Calculation of sequence divergence from the thermal
stability of DNA heteroduplexes. J. Mol. Evol. 34: 379-382.
STARMER, W. T., and D. T. SULLIVAN, 1989 A shift in the third
codon position nucleotide frequency in alcohol dehydrogenase
genes in the genus Drosophila. Mol. Biol. Evol. 6: 546-552.
SULLIVAN, D. T., P. W. ATKINSON and W. T. STARMER,
1990 Molecular evolution of the alcohol dehydrogenase
genes in the genus Drosophila. Evol. Biol. 24: 107-147.
WERMAN, S . D., E. H. DAVIDSON and R. J. BRITTEN, 1990 Rapid
evolution in a fraction of the Drosophila nuclear genome. J.
WHITE, B. N., G. M. TENER, J. HOLDEN and D. T. SUZWKI,
1973 Analysis of tRNAs during the development of Drosoph-
ila. Dev. Biol. 33: 185-195.
ZIMMERMAN, J. L., D. L. FOUTS and J. E. MANNING,
1980 Evidence for a complex class of nonadenylated mRNA in Drosophila. Genetics 95: 673-691
5: 704-716.
Mol. EvoI. 30: 281-289.