ABSTRACT
ULUS, HANDE ZEYNEP. Processing Human Milk to Increase Nutrient Density for Preterm Infants. (Under the direction of Dr. Jonathan C. Allen).
Breast milk is the optimal food for newborns. Preterm birth might result in problems with the initiation of lactation and limitation of suckling reflexes. Choices to feed preterm infants in neonatal intensive care units are mother’s milk, donor milk, or formula. Concerns regarding the selection of feed are catch-up growth and health effects. Even though formula acquires faster catch-up growth, it is not as tolerable as human milk and increases the risk of necrotizing enterocolitis. Preterm infants have better tolerance for human milk, but the lower caloric density of term mothers’ milk or donor milk might not meet preterm infant growth needs. Preterm infants have higher protein and energy requirements with a limited stomach capacity. Therefore, the best practice is using breast milk but with a need for increased nutrient density. Aims of this study were to concentrate donor breast milk to have a higher caloric density and protein, but at the same time avoiding side effects of high lactose concentration by precipitating lactose at low temperature. Donor breast milk was obtained from WakeMed Mothers’ Milk Bank. Half of the samples were homogenized. Preliminary data found that low-temperature removal of lactose from unprocessed human milk was minimal. Therefore, condensation was applied before lactose removal. Volume reductions were 80%, 60%, 50%, 40%, 30% and 0% respectively. Subsequently, samples were held at 0°C overnight, followed by refrigerated centrifugation for lactose removal at 0oC.
Processing Human Milk to Increase Nutrient Density for Preterm Infants
by
Hande Zeynep Ulus
A thesis submitted to the Graduate Faculty of North Carolina State University
in partial fulfillment of the requirements for the degree of
Master of Science
Nutrition
Raleigh, North Carolina 2017
APPROVED BY:
________________________ __________________________ Dr. Jonathan C. Allen Dr. April D. Fogleman
DEDICATION
BIOGRAPHY
ACKNOWLEDGEMENTS
Research was supported by funds from North Carolina State University, Department of Food, Bioprocessing and Nutrition Science summer teaching program. Hande Zeynep ULUS was supported by a grant from Fulbright program through the Turkish Fulbright Commission and Institute of International Education, Washington DC.
Also, I would like to thank to Dr. Jonathan Allen for being such a great advisor a graduate student could ask for. My advisory committee, Dr. April Fogleman and Dr. Josip Simunovic, thank you for your inspiring and guiding me.
To Ruth Watkins, Rong Reynolds, Paige Luck, Chris Pernell, Debra Clare and Dr. Ramon Malheiros, thank you for all your technical assistance. Special thanks Dr. Emily Griffith and Merve Yasemin Tekbudak for all the statistical assistance.
Also, I appreciate all the women who donate their milk to the milk bank.
TABLE OF CONTENTS
LIST OF TABLES ... vii
LIST OF FIGURES ... viii
CHAPTER 1: Introduction ... 1
1.1 References ... 3
CHAPTER 2: Literature Review ... 5
2.1Preterm birth ... 5
2.2 Necrotizing enterocolitis ... 7
2.3 Importance of nutritional decisions ... 8
2.4 Nutrient Requirements ... 9
2.5 Options for preterm infant feeding ... 15
2.5.1 Parenteral feeding ... 15
2.5.2 Enteral feeding ... 17
2.6. Osmolality ... 26
2.7. Lactose ... 27
2.8. Viscosity ... 30
2.9. Evaporated milk ... 31
2.10 References ... 32
CHAPTER 3: Material and Methods ... 41
3.1 References ... 47
CHAPTER 4: Results and Discussion ... 48
4.1 Lactose ... 48
4.1.1 Statistical Analysis ... 51
4.1.2 ANOVA Results for Lactose ... 51
4.2 Protein ... 52
4.3 Osmolality ... 54
4.3.1 Statistical Analysis ... 56
4.3.2 ANOVA Results for Osmolality ... 56
4.4 Viscosity ... 58
4.5 Discussion ... 61
LIST OF TABLES
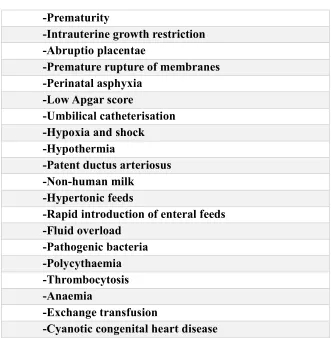
Table 1: Risk Factors for Necrotizing Enterocolitis ... 8
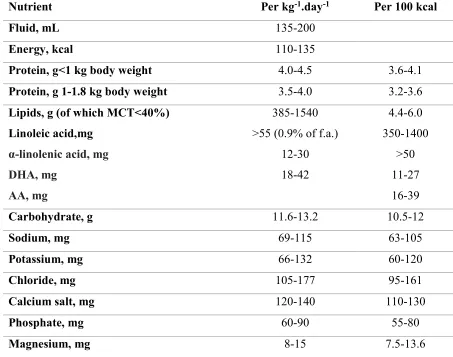
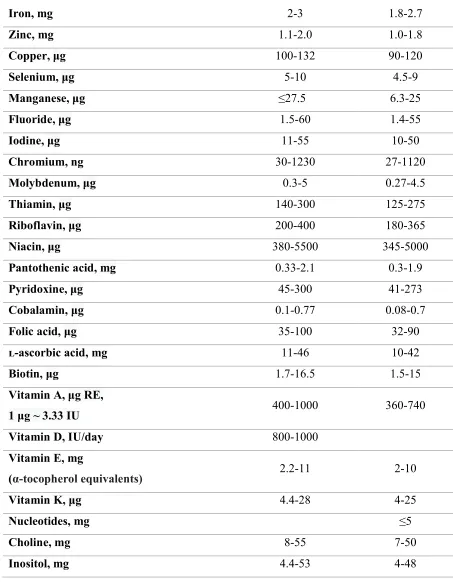
Table 2. Recommended Maximum - Minimum intakes of macro and micro-nutrients by ESPGHAN ... 12
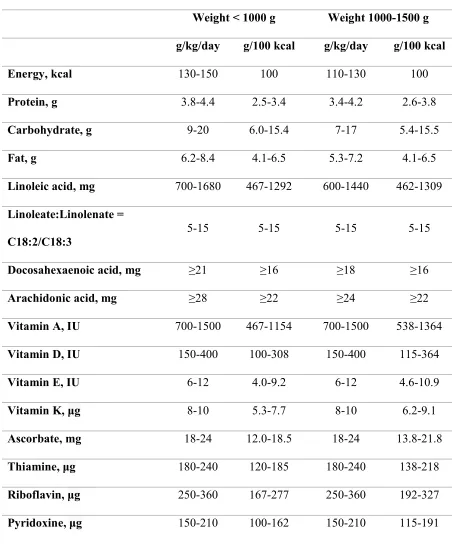
Table 3. Recommended enteral intake recommendation and comparison between ELBW and VLBW infants by AAP ... 14
Table 4. Difference in composition of milk of mothers who deliver preterm ... 19
Table 5. Guidelines for Initiating Milk Supply Without Infant Suckling ... 21
Table 6. Components of Milk and Effect of the Pasteurization ... 24
Table 7: Manufacturing stages of evaporated milk... 31
Table 8: Repeated Measures ANOVA Results for Lactose. ... 51
LIST OF FIGURES
Figure 1. 2 D chemical structure of α lactose (on the right) and β lactose (on the left) ... 28
Figure 2. Final solubility of lactose in water ... 29
Figure 3. The viscosity of Newtonian and Non-Newtonian fluids ... 30
Figure 4: Separation in a non-homogenized sample after the centrifugation ... 43
Figure 5. Comparison of average lactose levels for homogeneity, condensation and lactose removal ... 48
Figure 6. Comparison of lactose trends for the control and supernatant groups ... 50
Figure 7. Comparison of average protein levels for homogeneity, condensation and lactose removal ... 52
Figure 8. Comparison of average osmolality levels for homogeneity, condensation and lactose removal ... 54
Figure 9. Flow curves for all homogenized samples ... 58
Figure 10. Graphics of flow rate for lower condensation levels of homogen samples ... 59
Figure 11. Graphics of flow rate for all non-homogenized samples... 60
CHAPTER 1:
Introduction
Breastmilk is the optimal nutrition for newborns and is the recommended way to feed every newborn1,2. Preterm infants should receive breast milk, and it should be mother’s own milk if it’s possible1. Human milk banks provide breastmilk to preterm and sick infants when mother’s milk is not available. Human milk needs to be fortified to meet the high nutritional demand of a preterm infant1. Available fortifiers are cow’s milk based powder and liquid, and human milk-based fortifier.
Exclusive human milk diet (human milk + human milk-based human milk fortifier) gives better outcomes for preterm infants for necrotizing enterocolitis3. However,
commercial human milk based fortifiers are very costly. Therefore, there is a need in human milk banks to increase the nutrient density of human milk in their settings.
Preterm infants have a higher requirement for protein. The focus in the preterm infant nutrition has been shifting from energy alone to characterizing the protein to energy ratio4. High energy intake is associated with high fat deposition which might increase
Mothers, who donate their milk to the milk bank, are often term mothers with surplus milk supply. The composition of term mother’s milk is different than preterm mother’s milk6. Preterm mother’s milk is more compatible with preterm infant’s requirement. Preterm
mother’s milk is higher in protein and lower or similar in lactose compared to the term mother’s milk, which is closer to the preterm infant’s nutritional requirement6. Therefore, there is a need to increase energy and protein content in human milk while avoiding excessive levels of lactose.
Lactose is an osmotically active disaccharide. It can be crystallized when lactose concentration exceeds the solubility product constant for a given temperature7. The extreme concentration of lactose increases osmolality8. Hyperosmolar feeding is one of the proposed risk factors for necrotizing enterocolitis9. Therefore, lactose can be removed from milk by crystallizing and precipitating, which would also result in osmolality reduction. Increasing the energy and protein content of the milk can be achievable by concentrating the milk by removing the water from it. Evaporation, freeze-drying, reverse osmosis, and nanofiltration are possible methods to concentrate the milk. In this research, we used evaporation.
1.1 References
1. American Academy of Pediatrics. Breastfeeding and the Use of Human Milk.
Pediatrics. 2012;129(3):e827-e841. doi:10.1542/peds.2011-3552.
2. Agostoni C, Braegger C, Decsi T, et al. Breast-feeding: A Commentary by the ESPGHAN Committee on Nutrition. J Pediatr Gastroenterol Nutr. 2009;49(1):112-125. doi:10.1097/MPG.0b013e31819f1e05.
3. Sullivan S, Schanler RJ, Kim JH, et al. An exclusively human milk-based diet is associated with a lower rate of necrotizing enterocolitis than a diet of human milk and bovine milk-based products. J Pediatr. 2010;156(4):562-7.e1.
doi:10.1016/j.jpeds.2009.10.040 [doi].
4. Agostoni C, Buonocore G, Carnielli VP, et al. Enteral nutrient supply for preterm infants: commentary from the European Society of Paediatric Gastroenterology, Hepatology and Nutrition Committee on Nutrition. J Pediatr Gastroenterol Nutr. 2010;50(1):85-91. doi:10.1097/MPG.0b013e3181adaee0.
5. Thureen PJ. The neonatologist ’ s dilemma : Catch-up growth or beneficial
undernutrition in Very Low Birth Weight Infants — What are optimal growth rates ? J Pediatr Gastroenterol Nutr. 2007;45:F152-F154.
6. Lawrence RA, Lawrence RM. Breastfeeding: A Guide For The Medical Profession. 8th ed. Philadelphia: Elsevier; 2016 295 - 318.
8. McSweeney P, Fox P. Advanced Dairy Chemistry Volume 3 Lactose, Water, Salts and Minor Constituents. 3rd edition. New york: Springer Science & Business Media; 2009 1-7.
CHAPTER 2:
Literature Review
2.1 Preterm birth
The gestational period, under normal circumstances, is expected to last for 40 weeks and any birth that occurs before 37 weeks is a preterm birth. Preterm births can be subdivided into three categories based on the completed weeks of gestation: extremely preterm (<28 weeks), very preterm (< 28-32 weeks) and moderate/late preterm (<32-37 weeks)1. The completed weeks of gestation (or the gestational age) have an impact on the chance of survival at the birth. The gestational age is associated with the chance of survival, which means while the amount of time for intrauterine development gets lower, the chance of survival for the newborn decreases2. Any birth that happens before the 24th week has approximately 50% chance of survival when managed in neonatal intensive care units that can be found in high-income countries. In most of the low and middle-income countries, outcomes are much worse than high-income countries; births that happen up to the 34th week of gestation have the 50% chance of survival2.
sustainability, fighting against extreme poverty and hunger and infectious diseases, and also works on reducing child mortality and improving maternal health1. Due to actions triggered by Millennium Development Goals, the number of children who died under five years of age decreased from 9.6 million in 2000 to 5.9 million in 2015 with reductions in the primary causes of death such as pneumonia, preterm birth complications, diarrhea, intrapartum-related complications and malaria4. Although it is a significant improvement, there is still a lot of work needed, especially to increase healthy outcomes for preterm infants.
Another concern for the newborn baby is birth weight. Children who were born under 2500 g are classified as low birth weight (LBW), under 1500 g are classified as very low birth weight (VLBW) and under 1000 g are classified as extremely low birth weight (ELBW). Neonatologists consider the growth of the baby during gestation and the birth weight. If the infant is very preterm, then it is more likely to be extremely low birth weight (ELBW). Being very preterm, ELBW or intrauterine growth restricted (IUGR) adds more challenge to the newborn's life in the first days, weeks, years, or for even longer time5.
In the short term, preterm birth and ELBW are the challenges of survival for newborns. Preterm birth is the second largest cause of child death after pneumonia in children under five years of age and directly the biggest reason of neonatal death. When complications are included, it is estimated to cause 35% of neonatal mortality3. Preterm birth is the leading cause of child death under five years of age in middle and high-income
countries where infections are more likely to be prevented2.
lungs and respiratory system, skin, cardiovascular system, immune system, hematologic system, auditory system, ophthalmic system and central nervous system. And the most frequent complications are respiratory distress syndrome, necrotizing enterocolitis (NEC), retinopathy of prematurity (ROP), and neurodevelopmental diseases6.
2.2 Necrotizing enterocolitis
Necrotizing enterocolitis (NEC) is the inflammatory disease of the infant
gastrointestinal tract. It is more common in preterm and small for gestational age infants than term and appropriate for gestational age infants7. Also, it is the most common GI tract
Table 1: Risk Factors for Necrotizing Enterocolitis -Prematur ty
-Intrauter ne growth restr ct on -Abrupt o placentae
-Premature rupture of membranes -Per natal asphyx a
-Low Apgar score
-Umb l cal catheter sat on -Hypox a and shock -Hypotherm a
-Patent ductus arter osus -Non-human m lk
-Hyperton c feeds
-Rapid introduction of enteral feeds -Flu d overload
-Pathogen c bacter a -Polycythaem a -Thrombocytos s -Anaem a
-Exchange transfus on
-Cyanot c congen tal heart d sease
2.3 Importance of nutritional decisions
metabolism and weight loss after the birth14,15. The goal of nutrition for preterm infants is optimizing growth by avoiding the adverse outcomes such as neurodevelopmental problems, NEC, infections, and the long-term obesity.
One goal for nutritional decisions is to maintain intrauterine growth rate after the birth16. Achieving this is challenging because of the reasons mentioned above. In spite of the attempts to catch up with intrauterine growth rate, standard feeding methods provide higher glucose and lipids and significantly lower protein compared to the nutrient accretion of a fetus of the same gestational age17. Long-term nutritional interventions for catch-up growth that provide a higher intake of protein were found to be related to reduced
neurodevelopmental deficits. On the other hand, instead of long-term aggressive nutritional interventions, maintaining a beneficial undernutrition is related to lower risk for adverse health outcomes such as hypertension, obesity, cardiovascular disease and type 2 diabetes later in life. Due to the change in the body composition, catch-up growth strategy might be beneficial for the short term, but for the long term, aggressive nutritional interventions can be harmful. Even though there are minimal scientific data to create guidelines and strategies for preterm nutrition, decisions should be made individually by monitoring the growth rate17.
2.4 Nutrient Requirements
As mentioned, there are minimal data to create guidelines for preterm infant nutrition. Guidelines are usually prepared based on LBW infants because data collection is possible for that group18. Nutritional decisions in a NICU are often made by monitoring the growth and
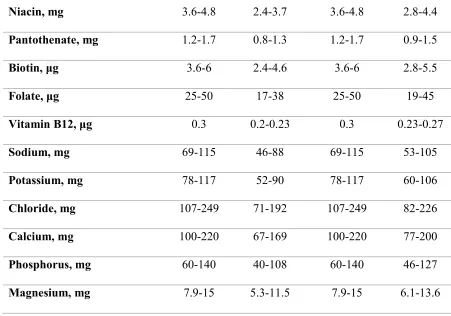
With the limited number of randomized control trials, American Academy of Pediatrics (AAP) and The European Society for Pediatric Gastroenterology Hepatology and Nutrition (ESPGHAN) stated lower and upper limits and recommendations for macro and micro nutrients. Tables 2. and 3. give the recommended level of intake for macro- and micro- nutrients.
For fluid intake, ESPGHAN stated that recommended intake would be between 135 – 200 mL/kg/day. Considerations when setting the level is that higher intake might increase the risk of morbidity due to complications such as pulmonary dysplasia, and lower intake would increase osmolality and increase renal solute load which would harm the kidney and causes dehydration. Another consideration would be the stomach capacity18.
Energy requirement may vary between infants due to activity, thermal balance, growth, absorption, and receive enteral or parenteral nutrition. Also, being SGA, IUGR, and appropriate for gestational age (AGA) makes a difference. SGA preterm infants might need more energy compared to AGA preterm infants, but the ratio between fat-free mass and fat mass should be monitored. Even though it is expected for a preterm infant to deposit more body fat to maintain thermoregulation, body composition should not change dramatically compared to the same gestational age fetus18,19. ESPGHAN states a range of 110-135
kcal/kg/day18. APA reports a range of 105 – 130 kcal/kg/day, but it can increase if the growth rate is low19.
Protein intake is essential for optimal growth and neurodevelopmental outcomes. A deficit might cause growth restriction and lower cognitive scores18,20. Amino acid
each amino acid is not clear. Therefore, quality of protein may interfere with the need. Protein requirement can be calculated by the need of the fetus at the same gestational age added to excretion of an infant18. Randomized control trials are made to define outcomes of the intake levels. ESPGHAN states that intakes in the range of 3 – 4.5 g/kg/day would give acceptable plasma protein results. And weight gain is positively correlated with protein intake up to 4.5 g/kg/day. For ELBW’s this number can go up to the upper level of this range due to a higher need for tissue build up. A lower level of 3.5 – 4.0 g/kg/day can meet the requirement of LBW infants18. AAP states the requirement of 3.8 – 4.4 g/kg/day for ELBW and 3.4 – 4.2 for VLBW infants. Also, AAP does not recommend the soy-based formulas for preterm infants because it interferes with bone growth21,22. Guidelines imply that protein deficit can impair the growth, but a slight excess does not do harm.
The lower limit of the carbohydrate requirement is calculated through the energy expenditure of glucose-dependent organs to avoid ketosis. The upper limit is calculated by the difference between the energy expenditure and minimum protein and fat intake.
ESPGHAN recommends a range of 11.6 – 13.2 g/kg/day carbohydrate intake for preterm infants18. AAP states that the recommended range for carbohydrate consumption for ELBW infants is 9-20 g/kg/day and for VLBW infants is 7 – 17 g/kg/day19.
Table 2. Recommended Maximum - Minimum intakes of macro and micro-nutrients by ESPGHAN
Nutrient Per kg-1.day-1 Per 100 kcal
Fluid, mL 135-200
Energy, kcal 110-135
Protein, g<1 kg body weight 4.0-4.5 3.6-4.1
Protein, g 1-1.8 kg body weight 3.5-4.0 3.2-3.6
Lipids, g (of which MCT<40%) Linoleic acid,mg
α-linolenic acid, mg DHA, mg
AA, mg
385-1540 >55 (0.9% of f.a.)
12-30 18-42 4.4-6.0 350-1400 >50 11-27 16-39
Carbohydrate, g 11.6-13.2 10.5-12
Sodium, mg 69-115 63-105
Potassium, mg 66-132 60-120
Chloride, mg 105-177 95-161
Calcium salt, mg 120-140 110-130
Phosphate, mg 60-90 55-80
Table 2 continued
Iron, mg 2-3 1.8-2.7
Zinc, mg 1.1-2.0 1.0-1.8
Copper, μg 100-132 90-120
Selenium, μg 5-10 4.5-9
Manganese, μg ≤27.5 6.3-25
Fluoride, μg 1.5-60 1.4-55
Iodine, μg 11-55 10-50
Chromium, ng 30-1230 27-1120
Molybdenum, μg 0.3-5 0.27-4.5
Thiamin, μg 140-300 125-275
Riboflavin, μg 200-400 180-365
Niacin, μg 380-5500 345-5000
Pantothenic acid, mg 0.33-2.1 0.3-1.9
Pyridoxine, μg 45-300 41-273
Cobalamin, μg 0.1-0.77 0.08-0.7
Folic acid, μg 35-100 32-90
ʟ-ascorbic acid, mg 11-46 10-42
Biotin, μg 1.7-16.5 1.5-15
Vitamin A, μg RE,
1 μg ~ 3.33 IU 400-1000 360-740
Vitamin D, IU/day 800-1000
Vitamin E, mg
(α-tocopherol equivalents) 2.2-11 2-10
Vitamin K, μg 4.4-28 4-25
Nucleotides, mg ≤5
Choline, mg 8-55 7-50
Table 3. Recommended enteral intake recommendation and comparison between ELBW and VLBW infants by AAP
Consensus Recommendations
Weight < 1000 g Weight 1000-1500 g g/kg/day g/100 kcal g/kg/day g/100 kcal
Energy, kcal 130-150 100 110-130 100
Protein, g 3.8-4.4 2.5-3.4 3.4-4.2 2.6-3.8
Carbohydrate, g 9-20 6.0-15.4 7-17 5.4-15.5
Fat, g 6.2-8.4 4.1-6.5 5.3-7.2 4.1-6.5
Linoleic acid, mg 700-1680 467-1292 600-1440 462-1309
Linoleate:Linolenate = C18:2/C18:3
5-15 5-15 5-15 5-15
Docosahexaenoic acid, mg ≥21 ≥16 ≥18 ≥16
Arachidonic acid, mg ≥28 ≥22 ≥24 ≥22
Vitamin A, IU 700-1500 467-1154 700-1500 538-1364
Vitamin D, IU 150-400 100-308 150-400 115-364
Vitamin E, IU 6-12 4.0-9.2 6-12 4.6-10.9
Vitamin K, μg 8-10 5.3-7.7 8-10 6.2-9.1
Ascorbate, mg 18-24 12.0-18.5 18-24 13.8-21.8
Thiamine, μg 180-240 120-185 180-240 138-218
Riboflavin, μg 250-360 167-277 250-360 192-327
Table 3 continued
Niacin, mg 3.6-4.8 2.4-3.7 3.6-4.8 2.8-4.4
Pantothenate, mg 1.2-1.7 0.8-1.3 1.2-1.7 0.9-1.5
Biotin, μg 3.6-6 2.4-4.6 3.6-6 2.8-5.5
Folate, μg 25-50 17-38 25-50 19-45
Vitamin B12, μg 0.3 0.2-0.23 0.3 0.23-0.27
Sodium, mg 69-115 46-88 69-115 53-105
Potassium, mg 78-117 52-90 78-117 60-106
Chloride, mg 107-249 71-192 107-249 82-226
Calcium, mg 100-220 67-169 100-220 77-200
Phosphorus, mg 60-140 40-108 60-140 46-127
Magnesium, mg 7.9-15 5.3-11.5 7.9-15 6.1-13.6
2.5 Options for preterm infant feeding
The following sections describes options to feed preterm infants which are parenteral nutrition and enteral nutrition. For enteral feeding, options are mother’s own milk, donor milk, and formula, or a combination. Also fortification also should be applied as necessary.
2.5.1 Parenteral feeding
nutrition in the first hours of life to avoid catabolism for a few weeks19,26. It is important to start early nutritional support for preterm infants because the protein and energy intake in the first week might affect developmental outcomes measured at 18 months27. Early aggressive nutrition, both parenteral and enteral, improves the outcomes in the short term27. Early aggressive nutrition can be defined as using a parenteral nutrition method to avoid the interruption of nutrient flow from birth until the establishment of full feeding by providing relatively high amino acids for a short term28.
Parenteral nutrition helps to meet the nutritional needs when enteral intake is minimal, keeps the infant metabolism anabolic, and increases the chance of survival, but prolonged parenteral nutrition might have detrimental effects such as enteral feeding intolerance, central venous catheter-related sepsis, and parenteral nutrition associated cholestasis26–28.
A fetus swallows large amounts of amniotic fluid in utero, which enhances the growth and maturity of the intestine29. Interrupting enteral intake with long-term exclusive parenteral nutrition causes villus atrophy. Therefore it should be avoided. Trophic feeding is a relatively recent concept that aims to prevent the adverse effects of enteral starvation26. As an initiation, a small volume of enteral feeding (10-20 mL/kg/day) is provided for at least five days.
Trophic feeding starts gut mobilization and hormone secretion while avoiding a full load of enteral feeding. It enhances the adaptation of the gastrointestinal tract to enteral feeding and prevents feeding intolerance later27.
is a controversial concept, failure to thrive should be avoided for optimal long-term growth and developmental outcomes.
2.5.2 Enteral feeding 2.5.2.1 Breastfeeding
Breastmilk is the optimal recommended nutrition for newborns. There are many benefits of breastfeeding for both infant and the mother. For mothers, breastfeeding empowers women, expedites postpartum recovery, decreases the risk for osteoporosis, reduces the risk for cardiovascular diseases and diabetes, protects against ovarian cancer30. For infants, breastfeeding reduces the risk of gastrointestinal infection, acute otitis media, respiratory infections, obesity, type 1 diabetes, type 2 diabetes, sudden infant death
syndrome, and leukemia31,32. Breastfeeding has a population-wide effect on reduction of the risk of blood pressure, hypertension, coronary heart disease and stroke later in life and might be advantageous for cognitive development32. Breastfeeding promotes optimal growth.
Human milk meets the requirements of newborns for six months. It is well tolerated by nearly all infants. Human milk protein provides well-balanced amino acids for infants which promotes tissue build up and growth with its high whey-to-casein ratio33. Human milk proteins also have the bioactive components that improve immunity, defend against
pathogenic bacteria, viruses, and yeast, and promote gut development and function, and enhance absorption33.
as both mother and child wish. AAP also recommends six months of exclusive breastfeeding followed by complementary feeding for at least one year or longer. WHO recommends breastfeeding to continue for at least for two years or longer30–32.
Another advantage of breastfeeding is that the contraindications of breastmilk are very rare. Contraindications can be seen due to infectious diseases, medical conditions in mother or infant, restrictive diet or malnutrition, exposure to environmental contaminants, medications and drug use. While some of these factors might interrupt breastfeeding temporarily, such as medication use due to bacterial infections, for most problems it is not necessary to discontinue breastfeeding. The only metabolic condition to contraindicate breastfeeding is classic galactosemia in an infant, which terminates breastfeeding.
Breastfeeding is also contraindicated with smallpox and yellow fever vaccinations, HIV, and human T-cell lymphotropic virus I and II infections in the mother. In other conditions
continuation of breastfeeding is still possible with some interventions34.
2.5.2.2 Use of breast milk for preterm infant
The use of breastmilk is usually promoted in NICUs. There are many significant long and short term benefits of breast milk for preterm infants. Human milk enhances immature defense systems and neurodevelopmental outcomes of preterm infants. It reduces re-hospitalization rates after NICU discharge. Also, it is associated with lower rates of
human milk fortifier) for VLBW infants meets the growth targets for weight gain, head circumference, and length and prevents EUGR35.
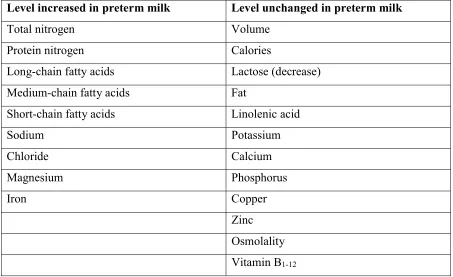
For breast milk, there are two options in some NICUs; mother’s own milk and donor milk. Mother’s own milk is the first choice for the infant feeding. The composition of preterm mother’s milk and term mother’s milk are different 30,36. Differences are shown in Table 4.
Table 4. Difference in composition of milk of mothers who deliver preterm
Level increased in preterm milk Level unchanged in preterm milk
Total nitrogen Volume
Protein nitrogen Calories
Long-chain fatty acids Lactose (decrease) Medium-chain fatty acids Fat
Short-chain fatty acids Linolenic acid
Sodium Potassium
Chloride Calcium
Magnesium Phosphorus
Iron Copper
Zinc Osmolality Vitamin B1-12
AAP recommends that every preterm infant receive human milk31. Mother’s own milk fresh or pasteurized is recommended to be the primary diet with appropriate
risk for NEC and late on sepsis37,38. Breast milk is protective against retinopathy of
prematurity. A positive correlation was observed between the amount of mother’s own milk consumed and IQ scores. Breastmilk is well tolerated, so it shortens the time to achieve full enteral feeding. Therefore, it usually reduces the length of the hospital stay39.
2.5.2.3. Lactation support in NICU
The use of mother’s milk in NICU should be encouraged and promoted.
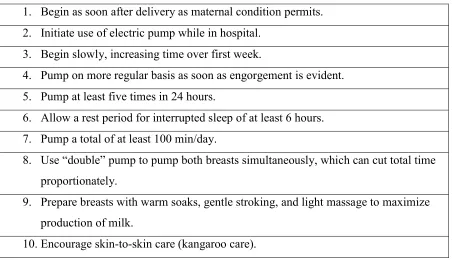
Interdisciplinary promotion of breastfeeding increases the rate of human milk feeding in NICU40. To increase the number of mothers that supply milk to their infants and the amount of the milk there are actions that need to be taken by healthcare professionals affecting the social environment of the mother. According to Schanler (1999) factors for effective lactation support are “initiating milk expression, maintaining milk volume, psychological support, and lactation, skin-to-skin contact, stress and lactation”41. For the first factor, to start milk expression, health care professionals should inform women about the importance of breast milk, expressing breast milk, using the breast pump and significance of regular
Table 5. Guidelines for Initiating Milk Supply Without Infant Suckling 1. Begin as soon after delivery as maternal condition permits. 2. Initiate use of electric pump while in hospital.
3. Begin slowly, increasing time over first week.
4. Pump on more regular basis as soon as engorgement is evident. 5. Pump at least five times in 24 hours.
6. Allow a rest period for interrupted sleep of at least 6 hours. 7. Pump a total of at least 100 min/day.
8. Use “double” pump to pump both breasts simultaneously, which can cut total time proportionately.
9. Prepare breasts with warm soaks, gentle stroking, and light massage to maximize production of milk.
10. Encourage skin-to-skin care (kangaroo care).
For the second factor, to maintain milk volume, it is important to monitor the amount of the total milk produced daily and pay attention to abnormal volumes when required. The third factor is giving the psychological support by building a maternal and paternal bond with infant or breastfeeding if it is possible. Fourth factor, Kangaroo care or skin-to-skin contact, is beneficial for both child and parent. It promotes milk production and improves
thermoregulation. The fifth factor, relieving maternal stress, enhances milk production performance41.
2.5.2.4. Donor milk
mother's own milk is not available, then the options for infant feeding are donor milk and formula. Both AAP and ESPGHAN recommend donor milk as the preferred choice for preterm infant nutrition31,42.
The main beneficial effect of using donor milk for preterm infants is its preventive effect against NEC43,44. A Cochrane review stated that formula increases the risk of feeding intolerance and NEC when compared to donor milk45. The same review stated that formula -fed infants have higher weight, length and head circumference at discharge but long-term growth and neurodevelopmental outcomes were not different. Also, donor milk has many observed promising beneficial health effects on sepsis, bronchopulmonary dysplasia, and long-term cardiovascular risk factors but more randomized controlled trials are needed42,44.
Donor milk should be obtained through donor milk banks, according to public health guidelines46. Especially for preterm infants in NICU, a milk bank is the best option to ensure the quality and safety of the milk. In North America, HMBANA sets the standards for human milk banking.
“The Human Milk Banking Association of North America (HMBANA) is a
professional association for supporters of non-profit donor human milk banking, and it was founded in 1985 to:
Develop guidelines for donor human milk banking practices in North America,
Provide a forum for information sharing among experts in the field on issues related to donor milk banking,
Encourage research into the unique properties of human milk for therapeutic and nutritional purposes,
Act as a liaison between member banks and governmental agencies,
Facilitate communication among member banks to assure adequate distribution of donor milk,
Facilitate the establishment of new donor milk banks in North America using HMBANA standards.”47
HMBANA has 26 member milk banks and serves 50 states and 264 cities in the US and three provinces and seven cities in Canada as of 201747. HMBANA milk banks screen the mothers who are volunteering to donate their milk. Mothers who get approved, after phone, medical record and blood screening, ship their expressed, frozen milk to closest milk bank48. The milk bank which receives the frozen donated milk, tests in the lab, pools,
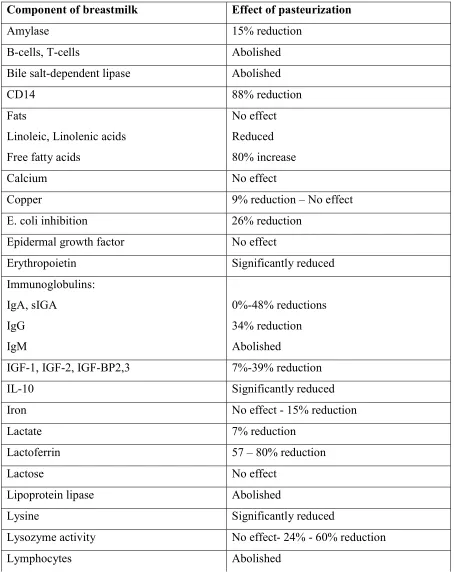
Table 6. Components of Milk and Effect of the Pasteurization
Component of breastmilk Effect of pasteurization
Amylase 15% reduction
B-cells, T-cells Abolished
Bile salt-dependent lipase Abolished
CD14 88% reduction
Fats
Linoleic, Linolenic acids Free fatty acids
No effect Reduced 80% increase
Calcium No effect
Copper 9% reduction – No effect
E. coli inhibition 26% reduction
Epidermal growth factor No effect
Erythropoietin Significantly reduced
Immunoglobulins: IgA, sIGA IgG IgM 0%-48% reductions 34% reduction Abolished
IGF-1, IGF-2, IGF-BP2,3 7%-39% reduction
IL-10 Significantly reduced
Iron No effect - 15% reduction
Lactate 7% reduction
Lactoferrin 57 – 80% reduction
Lactose No effect
Lipoprotein lipase Abolished
Lysine Significantly reduced
Lysozyme activity No effect- 24% - 60% reduction
Table 6 continued
Magnesium No effect
Mannose-binding lectin No effect
Oligosaccharides No effect
Phosphorus No effect
Potassium No effect
Protein No effect – Reduced
Sodium No effect
TGF-a, TGF-B No effect
Vitamin A No effect
Zinc No effect – 3% reduction
The human milk in milk banks is often milk from mothers of full-term infants. As mentioned before, preterm mother’s milk has some compositional differences compared to the term mothers’ milk. Both term and preterm mother’s milk might need to be fortified depending on the requirement and intake of the infant. Human milk fortifiers are cow’s milk based powder, cow’s milk-based liquid fortifiers, and human milk-based human milk
2.6. Osmolality
Osmolality is defined as “the concentration of a solution in terms of osmoles of solute per kilogram of solvent.” Compared to osmolarity, which can be defined as “the
concentration of a solution in terms of osmoles of solute per liter of solution.” It is simple and more common to use osmolality (mOsm/kg) for infant feeding54.
Osmotically active substances, which are vitamins, minerals, mono- and
di-saccharides, amino acids and fatty acids in infant feed, add up to the total osmolality of the feed. Osmotic load of carbohydrates is inversely associated with the length of
polysaccharide55. Therefore, excessive amounts of lactose might cause hyperosmolality and water retention in the gut which may result in dehydration56. Also, hyperosmolality is one of the many possible risk factors for NEC12,54,57. Willis et al. (1977) observed that extreme hyperosmolar feeds (>1700 mOsm/kg) increased the incidence of NEC58. Hyperosmolality was caused by calcium fortification, and the risk was reduced by dilution of the feed to 405 mOsm/kg. The elemental preterm formula which is high in osmolality (650 mOsm/kg), was found to be associated with increased risk for NEC compared to non-elemental preterm formula (359 mOsm/kg)59.
In 1976, AAP recommended 400 mOsm/L as the upper level for osmolarity60 which is approximately 450 mOsm/kg54. The osmolality of expressed human milk is 296 ± 1461, and it is isosmotic with blood and interstitial fluid30. There is not a more recent recommendation, and this level is still commonly used. However, fortification with fortifier, protein, and multivitamins cause the osmolality of the feed to go beyond this level62.
who found 3 of the 4 fortified milk tested exceeded 450 mOsm/kg and osmolality increased within 24 hours after preparation61. The osmolality of the fortified human milk increases during storage at 4oC due to enzymatic activity63. As mentioned before, fortification can be done with one nutrient or multi-nutrient, and multi-nutrient fortification might increase osmolality and density above tolerable levels and might cause gastrointestinal tract problems64. Therefore, multi-nutrient fortification should be monitored carefully to avoid hyperosmolality.
The osmolality of fortified breastmilk at clinically used levels for many fortifiers exceeds 400 mOsm/kg. The range of osmolality for breast milk (5 mL) fortified with various additives was 242 – 951 mOsm/kg65. Also, ESPGHAN stated that with some clinically used fortification applications osmolality levels increase up to 886 mOsm/kg62. Even though they did not interpret their results in osmolality; they claimed that combination of human milk, human milk fortifier, additional protein, and multivitamins cause hyperosmolarity. Therefore they should not be applied in combinations62. For safe fortification, clear cut-off levels for osmolality is needed66.
2.7. Lactose
Lactose is a disaccharide that is synthesized in the epithelial mammary gland cells as a molecule of glucose linked to a molecule of galactose with β 1-4 glycosidic bond67. Lactose serves as a ready energy source to newborns as mentioned before. Usual lactose
chain or a hemiacetal ring67,69. Therefore, there are two anomers of lactose: α and β lactose70. Figure 1. shows the structure of α and β lactose. Some physical properties are different, such as solubility and specific rotation67.
Figure 1. 2 D chemical structure of α lactose (on the right) and β lactose (on the left) Lactose molecules can switch between α and β forms (mutarotation), to establish equilibrium, depending on the temperature and concentration69. At body temperature, two parts of α-lactose and three parts of β-lactose are in equilibrium71. Under certain
Figure 2. Final solubility of lactose in water
Final solubility for both α and β lactose is shown in Figure 272. In order to initiate lactose crystallization concentration of lactose should be above the solubility curve. The solubility of lactose is proportionally associated with temperature. Thus, an attempt to crystallize lactose should be made at low temperature with saturated solutions.
At temperatures under 95 oC, α-lactose is the isomer that crystalizes69. Therefore, the following reaction occurs:
Β-lactose
α-lactose α-lactose hydrate crystals
72
Once lactose crystalizes, it is possible to precipitate the crystals by centrifugation.
0 20 40 60 80 100 120 140 160
0 10 20 30 40 50 60 70 80 90 100
La
ct
os
e
(g
/d
L)
2.8. Viscosity
Rheological characteristics of liquids differ depending on Newtonian behavior or non-Newtonian behavior. For a Newtonian fluid, the rate of strain is exactly proportional to the applied stress73. A single value can describe Newtonian viscosity. Newtonian viscosity is temperature dependent, but it is constant for the shear rate, whereas non-Newtonian fluids are dependent on shear rate67. These fluids can be shear thinning or shear thickening as shown in Figure 3.
Figure 3. The viscosity of Newtonian and Non-Newtonian fluids.
behavior, depending on the amount of total solid67. The viscosity of Non-Newtonian fluids can be described as a function of shear rate. Cream and other dairy products derived from milk with minimal processing are non-Newtonian fluids67.
2.9. Evaporated milk
There are different methods and technologies for increasing the milk concentration. Methods that are commonly used are evaporation of the milk under vacuum, freeze drying and membrane filtering74. Vacuum evaporation for evaporated milk production in industrial setting is illustrated in Table 774.
Table 7: Manufacturing stages of evaporated milk
Receiving and Selection of Milk Preliminary Treatment
Clarification, Fat separation / standardization)
Pre-heating (115 – 128oC, 1 – 6 min)
Vacuum Evaporation (45 – 70oC)
Homogenization (P1=15 – 25 mPa; P2=5 – 10 mPa) Packaging
Sterilization (100 – 120oC, 15 – 20 min or 140oC, 3 s)
2.10 References
1. Howson EC, Kinney M, Lawn. J, Geneva WHO. Born too soon. Born Too Soon, Glob Action Rep Preterm Birth Eds CP Howson, MV Kinney, JE Lawn World Heal Organ
Geneva. 2012;13(5):1-126.
doi:http://whqlibdoc.who.int/publications/2012/9789241503433_eng.pdf.
2. Liu L, Johnson HL, Cousens S, et al. Global, regional, and national causes of child mortality: An updated systematic analysis for 2010 with time trends since 2000.
Lancet. 2012;379(9832):2151-2161. doi:10.1016/S0140-6736(12)60560-1.
3. Blencowe H, Cousens S, Oestergaard MZ, et al. National, regional, and worldwide estimates of preterm birth rates in the year 2010 with time trends since 1990 for selected countries: A systematic analysis and implications. Lancet (London, England). 2012;379(9832):2162-2172. doi:10.1016/S0140-6736(12)60820-4 [doi].
4. UNICEF. Levels and trends in child mortality. New York UNICEF. 2015:1-30. http://www.who.int/maternal_child_adolescent/documents/levels_trends_child_mortal ity_2013/en/.
5. United Nations Children’s Fund and World Health Organization. Low Birthweight: Country, Regional and Global Estimates.; 2004.
6. Behrman RE, Butler AS. Preterm Birth: Causes, Consequences, and Prevention. Washington, D.C.: National Academies Press; 2007. doi:10.17226/11622.
7. Thompson AM, Bizzarro MJ. Necrotizing enterocolitis in newborns: Pathogenesis, prevention and management. Drugs. 2008;68(9):1227-1238.
&AN=2008285910.
8. Chen C, Walker WA. Probiotics and the mechanism of necrotizing enterocolitis.
Semin Pediatr Surg. 2013;22(2):94-100. doi:10.1053/j.sempedsurg.2013.01.006. 9. Hunter CJ, Upperman JS, Ford HR, Camerini V. Understanding the susceptibility of
the premature infant to necrotizing enterocolitis (NEC). Pediatr Res. 2008;63(2):117-123. doi:10.1203/PDR.0b013e31815ed64c.
10. Sullivan S, Schanler RJ, Kim JH, et al. An exclusively human milk-based diet is associated with a lower rate of necrotizing enterocolitis than a diet of human milk and bovine milk-based products. J Pediatr. 2010;156(4):562-7.e1.
doi:10.1016/j.jpeds.2009.10.040 [doi].
11. Schanler RJ, Shulman RJ, Lau C. Feeding strategies for premature infants: Beneficial outcomes of feeding fortified human milk versus preterm formula. Pediatrics.
1999;103(6):1150-1157. https://www.ncbi.nlm.nih.gov/pubmed/10353922.
12. Newell S. Rennie and Robertson’s Textbook of Neonatology. Fifth edit. (Rennie JM, ed.). Elsevier Ltd; 2012.
13. Raaijmakers A, Allegaert K. Catch-up growth in former preterm neonates: No time to waste. Nutrients. 2016;8(12):10-12. doi:10.3390/nu8120817.
14. Ehrenkranz RA, Younes N, Lemons JA, et al. Longitudinal growth of hospitalized very low birth weight infants. Pediatrics. 1999;104(2 1):280-289.
2008;32(1):20-27. doi:10.1053/j.semperi.2007.12.004.
17. Thureen PJ. The neonatologist ’ s dilemma : Catch-up growth or beneficial
undernutrition in very low birth weight infants — What are optimal growth rates ? J Pediatr Gastroenterol Nutr. 2007;45:F152-F154.
18. Agostoni C, Buonocore G, Carnielli VP, et al. Enteral nutrient supply for preterm infants: commentary from the European Society of Paediatric Gastroenterology, Hepatology and Nutrition Committee on Nutrition. J Pediatr Gastroenterol Nutr. 2010;50(1):85-91. doi:10.1097/MPG.0b013e3181adaee0.
19. Kleinman RE, Greer FR. Pediatric Nutrition. 7th ed. Chicago; 2013.
20. Lucas A, Morley R, Cole TJ. Randomised trial of early diet in preterm babies and later intelligence quotient. BMJ. 1998;317(7171):1481-1487.
doi:10.1136/bmj.317.7171.1481.
21. Kleinman RE, Greer FR. Pediatric Nutrition. 7th edition. Chicago: American Academy of Pediatrics; 2013.
22. Bhatia J, Greer F. Use of soy protein-based formulas in infant feeding. Pediatrics. 2008;121(5):1062-1068. doi:10.1542/peds.2008-0564.
23. Ziegler EE, Fomon SJ. Lactose enhances mineral absorption in infancy. J Pediatr Gastroenterol Nutr. 1983;2(2):288-294.
http://www.ncbi.nlm.nih.gov/pubmed/6875753.
24. Ballard O, Morrow AL. Human milk composition: nutrients and bioactive factors.
Pediatr Clin North Am. 2013;60(1):49-74.
microbiota. Clin Microbiol Infect. 2012;18(SUPPL. 4):12-15. doi:10.1111/j.1469-0691.2012.03863.x.
26. Ben XM. Nutritional management of newborn infants: Practical guidelines. World J Gastroenterol. 2008;14(40):6133. doi:10.3748/wjg.14.6133.
27. Su B. Optimizing nutrition in preterm infants. Pediatr Neonatol. 2014;55(1):5-13. doi:10.1016/j.pedneo.2013.07.003.
28. Puntis JWL. Nutritional support in the premature newborn. Postgr med j. 2006;82:192-198. doi:10.1136/pgmj.2005.038109.
29. Underwood MA. Human milk for the premature infant. Pediatr Clin North Am. 2013;60(1):189-207. doi:10.1016/j.pcl.2012.09.008.
30. Lawrence RA, Lawrence RM. Breastfeeding: A Guide For The Medical Profession. 8th ed. Philadelphia: Elsevier; 2016 220-221, 530, 549, 552.
31. American Academy of Pediatrics. Breastfeeding and the use of human milk.
Pediatrics. 2012;129(3):e827-e841. doi:10.1542/peds.2011-3552.
32. Agostoni C, Braegger C, Decsi T, et al. Breast-feeding: A Commentary by the ESPGHAN Committee on Nutrition. J Pediatr Gastroenterol Nutr. 2009;49(1):112-125. doi:10.1097/MPG.0b013e31819f1e05.
33. Lönnerdal B. Nutritional and physiologic significance of human milk proteins. Am J Clin Nutr. 2003;77:1537S–43S.
34. Lawrence RM. Circumstances when breastfeeding is contraindicated. Pediatr Clin North Am. 2013;60(2013):295-318.
adequate growth in infants ≤ 1250 grams birth weight. BMC Res Notes. 2013;6:459. doi:10.1186/1756-0500-6-459.
36. Lemons JA, Moye L, Hall D, Simmons M. Differences in the composition of preterm and term human milk during early lactation. Pediatr Res. 1982;16(2):113-117. http://www.ncbi.nlm.nih.gov/pubmed/7058078.
37. Montjaux-Regis N, Cristini C, Arnaud C, Glorieux I, Vanpee M, Casper C. Improved growth of preterm infants receiving mother’s own raw milk compared with
pasteurized donor milk. Acta Paediatr. 2011;100(12):1548-1554. doi:10.1111/j.1651-2227.2011.02389.x [doi].
38. Schanler RJ. Randomized trial of donor human milk versus preterm formula as substitutes for mothers’ own milk in the feeding of extremely premature infants.
Pediatrics. 2005;116(2):400-406. doi:10.1542/peds.2004-1974.
39. Ahrabi AF, Schanler RJ. Human milk is the only milk for premies in the NICU! Early Hum Dev. 2013;89(SUPPL2):S51-S53. doi:10.1016/j.earlhumdev.2013.08.006. 40. Gianni ML, Roggero P, Amato O, et al. Intervention for promoting breast milk use in
neonatal intensive care unit: a pilot study. J Matern Fetal Neonatal Med. 2014;27(5):475-478. doi:10.3109/14767058.2013.818971 [doi].
41. Schanler RJ, Hurst NM, Lau C. The use of human milk and breastfeeding in premature infants. Clin Perinatol. 1999;26(2):379-393.
42. Arslanoglu S, Corpeleijn W, Moro G, et al. Donor human milk for preterm infants: current evidence and research directions. J Pediatr Gastroenterol Nutr.
43. Boyd CA, Quigley MA, Brocklehurst P. Donor breast milk versus infant formula for preterm infants: systematic review and meta-analysis. Arch Dis Child - Fetal Neonatal Ed. 2007;92(3):F169-F175. doi:10.1136/adc.2005.089490.
44. Bertino E, Giuliani F, Baricco M, et al. Benefits of donor milk in the feeding of preterm infants. Early Hum Dev. 2013;89(SUPPL2):S3-S6.
doi:10.1016/j.earlhumdev.2013.07.008.
45. Quigley M, Mcguire W. Formula versus donor breast milk for feeding preterm or low birth weight infants ( Review ). Cochrane Database Syst Rev. 2014;(4):1-92.
doi:10.1002/14651858.CD002971.pub3.www.cochranelibrary.com. 46. Food and Drug Administration. Use of Donor Human Milk.
https://www.fda.gov/scienceresearch/specialtopics/pediatrictherapeuticsresearch/ucm2 35203.htm. Published 2015. Accessed July 6, 2017.
47. HMBANA. https://www.hmbana.org/. Accessed January 1, 2017. 48. WakeMed Mother’s Milk Bank. Donating Your Milk.
https://www.wakemed.org/mothers-milk-bank-donating-breast-milk. Accessed January 1, 2017.
49. WakeMed Mother’s Milk Bank. Follow the milk. https://www.wakemed.org/follow-the-milk. Accessed January 1, 2017.
50. Lonnerdale B. Effects of maternal dietary intake on human milk composition. J Nutr. 1986;116:499-513.
Nutr Metab. 2011;36(2):175-182. doi:10.1139/h11-008.
52. Kumar RK, Singhal A, Vaidya U, Banerjee S, Anwar F, Rao S. Optimizing nutrition in preterm low birth weight infants?Consensus summary. Front Nutr. 2017;4(May):20. doi:10.3389/fnut.2017.00020.
53. Abrams SA, Schanler RJ, Lee ML, Rechtman DJ. Greater mortality and morbidity in extremely preterm infants fed a diet containing cow milk protein products. Breastfeed Med. 2014;9(6):281-285. doi:10.1089/bfm.2014.0024.
54. Pearson F, Johnson MJ, Leaf A. Milk osmolality: does it matter? Arch Dis Child Fetal Neonatal Ed. 2013;98(2):F166-9. doi:10.1136/adc.2011.300492.
55. Koo WW, Poh D, Leong M, Tam YK, Succop P, Checkland EG. Osmotic load from glucose polymers. JPEN J Parenter Enter Nutr. 1991;15(2):144-147.
http://www.ncbi.nlm.nih.gov/entrez/query.fcgi?cmd=Retrieve&db=PubMed&dopt=Ci tation&list_uids=2051555.
56. Garcia-Arroyo FE, Cristóbal M, Arellano-Buendía AS, et al. Rehydration with soft drink-like beverages exacerbates dehydration and worsens dehydration-associated renal injury. Am J Physiol - Regul Integr Comp Physiol. 2016:ajpregu.00354.2015. doi:10.1152/ajpregu.00354.2015.
57. Sántulli TV, Schullinger JN, Heird WC, et al. Acute necrotizing enterocolitis in infancy: a review of 64 cases. Pediatrics. 1975;55(3):376-387.
http://www.ncbi.nlm.nih.gov/pubmed/1143976.
Pediatrics. 1977;60(4):535-538. http://www.ncbi.nlm.nih.gov/pubmed/905019. 59. Book LS, Herbst JJ, Atherton SO, Jung AL. Necrotizing enterocolitis in
low-birth-weight infants fed an elemental formula. J Pediatr. 1975;87(4):602-605. http://www.ncbi.nlm.nih.gov/pubmed/1174138.
60. Barness LA, Mauer AM, Holliday MA, et al. Commentary on breastfeeding and infant formulas, including proposed standards for formulas. Pediatrics. 1976;57(2):278-285. 61. Rosas R, Sanz MP, Fernandez-Calle P, et al. Experimental study showed that adding
fortifier and extra-hydrolysed proteins to preterm infant mothers’ milk increased osmolality. Acta Paediatr. 2016;105(12):e555-e560. doi:10.1111/apa.13522.
62. Kreissl A, Zwiauer V, Repa A, et al. Effect of fortifiers and additional protein on the osmolarity of human milk: is it still safe for the premature infant? J Pediatr
Gastroenterol Nutr. 2013;57(4):432-437. doi:10.1097/MPG.0b013e3182a208c7. 63. De Curtis M, Candusso M, Pieltain C, Rigo J. Effect of fortification on the osmolality
of human milk. Arch Dis Child Fetal Neonatal Ed. 1999;81(2):F141-3. http://www.ncbi.nlm.nih.gov/pubmed/10448185.
64. Brown JVE, Embleton ND, Harding JE, McGuire W. Multi-nutrient fortification of human milk for preterm infants. Cochrane database Syst Rev. 2016;(5):CD000343. doi:10.1002/14651858.CD000343.pub3.
65. Srinivasan L, Bokiniec R, King C, Weaver G, Edwards AD, Edwards P. Increased osmolality of breast milk with therapeutic additives. Arch Dis Child Fetal Neonatal Ed. 2004;89:514-517. doi:10.1136/adc.2003.037192.
preterm infants. Curr Opin Clin Nutr Metab Care. 2015;18(3):276-284. doi:10.1097/MCO.0000000000000167.
67. McSweeney P, Fox P. Advanced Dairy Chemistry Volume 3 Lactose, Water, Salts and Minor Constituents. 3rd editio. New york: Springer Science & Business Media; 2009 5-7, 710-723.
68. Jenness R. The composition of human milk. Semin Perinatol. 1979;3(3):225-239. 69. Jenness R, Walstra P. Dairy Chemistry and Physics. John Wiley & Sons; 1984 27-33. 70. PubChem. https://pubchem.ncbi.nlm.nih.gov/. Published 2017.
71. O’Neil MJ. The Merck Index: An Encyclopedia of Chemicals, Drugs, and Biological. Whitehouse Station: Merck and Co; 2006.
72. Wong NP, Jenness R, Keeney M, Marth EH. Fundamentals of Dairy Chemistry. 3rd Edition. New York: Van Nostrand Reinhold Company; 1988 279 - 306.
73. Prentice JH. Dairy Rheology: A Concise Guide. VCH Publishers; 1992 8-50. 74. Oliveira MN, Penna ALB, Garcia Nevarez H. Dairy Powders and Concentrated
CHAPTER 3:
Material and Methods
Donated human breast milk was obtained from the WakeMed Mother’s Milk Bank (Cary, NC). Milk banks experience milk shortages, therefore categorizing the milk by the factors that affect milk composition such as being expressed at the beginning or end of the feeding, time of the day, infant’s age, maternal diet, gestational age at birth1–3, is not always applicable. Therefore, the milk was not categorized according to these factors in this
research.
The milk was frozen at -20 oC when received and kept frozen until use. It was thawed in a shallow shaking water bath (Thermo Scientific Precision) at 27 oC for 30 minutes. Thirty-six samples of 200 mL each were prepared from separate milk donations collected in 60-180 mL containers. Samples from different mothers were pooled to achieve the required 200 mL volume. Homogenization, evaporation, and centrifugation were applied in order to achieve a lactose-reduced human milk concentrate. Eighteen of these samples were
homogenized, while the remaining eighteen were not. A benchtop homogenization machine (Niro Soavi, Panda2K, Italy) was used to do two-stage homogenization. After
homogenization, the samples were condensed with a rotary evaporator (Buchi R-300
were applied to the samples. There were three replicates for each combination of
Figure 4: Separation in a non-homogenized sample after the centrifugation
Lactose, protein, osmolality, and viscosity of each sample were measured. Lactose measurement was performed with the R-biopharm Lactose/D-galactose enzymatic kit. First, the samples were prepared for kit application by denaturation, precipitation, and filtration of proteins. For this procedure, 1 mL of each sample was mixed with 20 mL of water, and 1 mL of trichloroacetic acid (3M) then was incubated for 10 minutes. Then, the solution was neutralized with 1M sodium hydroxide and was brought up to 100 mL. Subsequently, the solutions were filtered with 0.45 µm nylon filters (EMD Millipore Corp. Germany) in order to prepare for the kit application. The lactose in solution was oxidized and coupled to NADH formation by the following enzymatic reactions.
Lactose + H2O D-glucose + D-galactose
D-galactose + NAD+ D-galactonic acid + NADH + H+
NADH formation stoichiometrically corresponds to the amount of lactose in the initial solution. The amount of lactose was calculated by measuring the difference in light absorption depending on the increase in NADH level. Measurements were taken at 340 nm wavelength with a spectrophotometer (Thermo Multiskan MCC Fisher Sci USA) in a 96-well plate with blanks and standard curve.
nitrogen consists of 20-25 % of the total nitrogen whereas in bovine milk it is only 3-5%4. Therefore, the conversion factor for bovine milk, which is 6.38, overestimates the protein in human milk. A correction is necessary for the conversion factor for application in human milk. With this correction, 5.18 was used as the conversion factor5. The aim for the protein measurement is to see if there is a significant nutrient loss into the lactose pellet. Protein requirement increases for the preterm infants, and a goal of the project was to increase protein concentration; hence, the protein was measured to observe the effect of the lactose removal process.
Osmolality (mOsm/kg) was measured with a freezing point depression osmometer, Advanced Micro Osmometer Model 3300 (Advanced Instrument Inc., Norwood, MA, USA) which requires 20 µL of each milk sample for the measurement. The instrument was
calibrated with standard solutions of 50 mOsm and 850 mOsm. The measurement was repeatable.
Viscosity measurement was performed with an Anton Paar modular compact rheometer MCR 302 at 25oC (Anton Paar GmbH, Austria). Parallel plate and double-gap concentric cylinder geometry were used. Most of our samples were non-Newtonian fluids, so we report flow curves instead of one value.
non-homogenized). The dependent variables are the lactose, protein, osmolality and viscosity measurements of the human milk.
In our study, data sets included 72 observations each for the lactose content, protein contents, and the osmolality levels. Thirty-six subjects’ milk donations were randomly assigned to six categories of condensation. Then, the lactose, protein, and osmolality
3.1 References
1. Allen JC, Keller RP, Archer P, Neville MC. Studies in human lactation -
milk-composition and daily secretion rates of macronutrients in the 1st year of lactation. Am J Clin Nutr. 1991;54(1):69-80.
http://search.ebscohost.com/login.aspx?direct=true&db=edswsc&AN=A1991FU35800013& site=eds-live.
2. Lonnerdale B. Effects of maternal dietary intake on human milk composition. J Nutr. 1986;116:499-513.
3. Hibberd CM, Brooke OG, Carter ND, Haug M, Harzer G. Variation in the
composition of breast milk during the first 5 weeks of lactation: implications for the feeding of preterm infants. Arch Dis Child. 1982;57(9):658-662. doi:10.1136/adc.57.9.658.
4. Atkinson S, Lönnerdal B. Protein and Non-Protein Nitrogen in Human Milk. Boca Raton, Florida: CRC Press; 1989.
CHAPTER 4:
Results and Discussion
4.1 Lactose
Figure 5. Comparison of average lactose levels for homogeneity, condensation and lactose removal
Figure 5 displays the variability in the lactose content of the milk samples before and after the lactose removal process, homogenization, and condensation were applied. The horizontal axis shows the combinations of categories for the homogeneity and condensation variables. The vertical axis indicates the amount of lactose content (g/dL) for each
combination. Orange columns represent the lactose amounts for milk samples that were not centrifuged (control), whereas blue columns represent the lactose levels for milk samples that
0 5 10 15 20 25 30 35 40 45
H Non-H H Non-H H Non-H H Non-H H Non-H H Non-H
0 0 30% 30% 40% 40% 50% 50% 60% 60% 80% 80%
La
ct
os
e
(g
/d
L)
Lactose levels of the milk samples (g/dL)
were centrifuged (supernatant). The results show that the lactose amount for the supernatant group is usually smaller than those for the control group except for the NonH-50% category. However, the lactose amount in the control and supernatant groups appears to vary for the homogenized and non-homogenized milk. In order to figure out if homogenization had an influence on the lactose precipitation, we compared the lactose content between the control-H and control-Noncontrol-H groups as well as the supernatant-control-H and supernatant-Noncontrol-H groups. Because the lactose measurements do not come from a normal distribution, we applied the nonparametric Wilcoxon signed rank test. We specified the significance level as α=0.05. The Wilcoxon test statistic for the control groups (W=370, P-value=0.2482) cannot reject the null hypothesis that the average lactose amounts in control-H and control-NonH groups are not significantly different from each other. Similarly, the Wilcoxon test statistic (W=360, P -value=0.4064) for the supernatant groups cannot reject the null hypothesis of equality of the average lactose content for the homogenized and non-homogenized milk. Thus, we can conclude that homogenization does not have an impact on the lactose content.
investigated whether there was a difference in the lactose content before and after applying the lactose removal process. In accord with the previous results, there was no statistical difference between the H and NonH categories, so we pooled the data together. Then, we used a one-sided paired t-test for testing the null hypothesis that the difference between lactose measurements for control and supernatant is zero versus the alternative hypothesis that the difference is greater than zero. The paired t-test statistic is 5.7614 and the P-value < 0.0001, which shows that the null hypothesis can be rejected at the significance level of 0.05. We can conclude that lactose removal had a significant effect on the lactose content and the supernatant group had relatively lower lactose amounts than those for the control group.
Figure 6. Comparison of lactose trends for the control and supernatant groups 0
5 10 15 20 25 30 35 40 45 50
0 10 20 30 40 50 60 70 80
La
ct
os
e
(g
/d
L)
Condensation (% volume reduction)
Comparison of Trendlines for Control and Supernatant
4.1.1 Statistical Analysis
In this section, we use the GLM procedure in SAS Version 9.4 (SAS Inc. Cary, USA) to perform two-way repeated measures ANOVA results for lactose measurement. Data input and ANOVA table can be found in Appendix.
4.1.2 ANOVA Results for Lactose
The correlation coefficient between control and supernatant is 0.42 with a P-value of 0.02, which means that correlation between the repeated measurements is statistically
significant at the significance level of 0.05. This justifies that the repeated measures ANOVA is an appropriate analysis method for these data.
Table 8: Repeated Measures ANOVA Results for Lactose.
VARIABLE F VALUE P-VALUE
CONDENSATION 38.75 <0.0001 *
LACTOSE REMOVAL 16.52 0.0003 *
CONDENSATION*LACTOSE
REMOVAL 1.02 0.4208
*** Significant at <.05 level
category of condensation. Additionally, there was a significant centrifugation effect (F=16.52, P-value=0.0003), indicating that the average lactose content changed after the lactose removal procedure was applied. The mean lactose content for control and supernatant are 18.05 g/dL and 14.68 g/dL, respectively. This means that we observed a significant decrease in lactose amounts when centrifugation was applied. On the other hand, the interaction effect between centrifugation and condensation does not seem to be statistically significant (F=1.02, P-value=0.4208). This means that the effect of the chilled centrifugation procedure on the lactose content is not different for the categories of condensation.
4.2 Protein
Figure 7. Comparison of average protein levels for homogeneity, condensation and lactose removal
0 1 2 3 4 5 6
H Non-H H Non-H H Non-H H Non-H H Non-H H Non-H
0 0 30% 30% 40% 40% 50% 50% 60% 60% 80% 80%
Pr
ot
ei
n
(g
/d
L)
Protein levels of the milk samples (g/dL)
Figure 7 illustrates the variability in the protein content of the milk samples before and after lactose removal process, homogenization and condensation are applied. According to the results, the protein amounts for the supernatant and control groups are very similar to each other for almost all combinations of homogeneity and condensation. In general, the protein amount for the homogenized milk seems to be lower than those for the non-homogenized milk. This observation could be due to greater loss of fat by adherence to processing equipment without homogenization. Due to the violation of the normality
assumption, we again applied the Wilcoxon test to the control and supernatant groups to see whether the protein content differed between the NonH and H categories. The Wilcoxon test statistics for the control groups (W=281.5, P-value=0.1054) and the supernatant groups (W=285, P-value=0.1341) cannot reject the null hypothesis of equality of the average protein content of the homogenized and non-homogenized milk. As we expected, homogenization did not cause a noticeable change in the protein amount. Furthermore, we observed that the protein amount increased proportionally as the volume reduction increased. As in the
4.3 Osmolality
Figure 8. Comparison of average osmolality levels for homogeneity, condensation and lactose removal. The dotted line indicates the AAP recommendation for osmolality in infant feeding
Figure 8 shows the variability in the osmolality of the milk samples before and after the lactose removal process, homogenization, and condensation were applied. The results do not indicate a particular pattern in osmolality levels for the supernatant and control groups. We observed that osmolality levels for the homogenized and non-homogenized milk seem similar to each other. We statistically investigated whether homogenization influences osmolality for the control and supernatant groups. The Wilcoxon signed rank tests statistic for comparing the control-H, and control-NonH groups are W=346.5 with the P
-value=0.6792. This shows that the homogenization process did not have an effect on osmolality in the control groups. In the same way, the Wilcoxon test result for the
0 200 400 600 800 1000 1200 1400 1600
H Non-H H Non-H H Non-H H Non-H H Non-H H Non-H
0 0 30% 30% 40% 40% 50% 50% 60% 60% 80% 80%
O sm ol al ity (m O sm /k g)
Osmolality levels of the milk samples (mOsm/kg)
supernatant groups (W=340.5 and p-value=0.8210) confirms that homogenization did not significantly change the osmolality levels in the supernatant groups. Moreover, we observed that osmolality increased gradually as the volume reduction increases. We applied a one-sided paired t-test for testing the null hypothesis that there was no difference in the
osmolality levels before and after applying the lactose removal process versus the alternative hypothesis that the difference is greater than zero. The paired t-test statistic is 3.51 and the P -value < 0.0001, which shows that the null hypothesis can be rejected at the significance level of 0.05. We can conclude that lactose removal had a significant effect on the osmolality level and the supernatant group had relatively lower osmolality amounts than those for the control group.
The blue dotted line on the osmolality graph shows the AAP recommendation for upper level of osmolality in feed for newborns1. Even though, there is not a specific recommendation for preterm infants this value is widely accepted. However, fortification applications that add powdered nutrients to human milk to meet the higher nutrient requirements of preterm infants might result in higher osmolality in feed than this
4.3.1 Statistical Analysis
In this section, we use the GLM procedure in SAS Version 9.4 (SAS Inc. Cary, USA) to perform two-way repeated measures ANOVA results for osmolality. We applied Tukey HSD as multiple comparison. Data input and ANOVA table can be found in Appendix.
4.3.2 ANOVA Results for Osmolality
The correlation coefficient between control and supernatant is 0.96 with a P-value less than 0.0001, which means that correlation between repeated measurements was statistically significant at the significance level of 0.05.
Table 9: Two-way ANOVA results.
VARIABLE F VALUE P-VALUE
CONDENSATION 21.77 <0.0001 *
LACTOSE REMOVAL 17.4 0.0002 *
CONDENSATION*LACTOSE
REMOVAL 3.87 0.0079 *
*** Significant at <.05 level
that the average osmolality changed after lactose removal was applied. The mean lactose content for control and supernatant was 691.04 mOsm/kg and 656.74 mOsm/kg, respectively. This means that we observed a significant decrease in osmolality when centrifugation was applied. Furthermore, the interaction effect between centrifugation and condensation is statistically significant (F=3.87, p-value=0.008). This means that the effect of centrifugation on osmolality is different for the categories of condensation. We also performed one-way ANOVA to investigate which categories of condensation had different amounts of osmolality change. In this case, our treatment factor is condensation with the same categories and the dependent variable is the osmolality difference between control and supernatant.
We obtained the same F test statistic and P-value for the interaction effect in Table 8. Tukey’s HSD test for multiple comparisons determined that the highest difference in