Energy Optimization in Dyeing Process
By Using Controlled Parameters
Kuldip A Rade
1, V.A. Pharande
2, D.R. Saini
3Research scholar., Dept of Mech. Engg, Bharati Vidyapeeth Deemed University COE, Pune, Maharashtra, India1
Principal, Samarth Education Trust’s Arvind Gavali College of Engg, Satara, Maharashtra, India2 Deputy Director, CEPD, National Chemical Laboratory (NCL) Dr. Homi Bhabha Road, Pune, Maharashtra, India3
ABSTRACT: A detailed study was conducted for small the scale textile industry in depth for the various processes involved, chemicals required, raw material and equipment details, operating parameters, energy requirements during processes including different losses etc. and to optimize thermal energy requirements in order to achieve acceptable good quality of cotton coloured products. In Indian dye (textile) industry, the major factors affecting regarding energy consumption. In addition, some technical information’s has been included with schematics processes used for production as also machineries.
KEYWORDS: Textile, Dyeing, Thermal Energy, Optimization, Materials, Processes.
I. INTRODUCTION
Current position of small scale textile industry in India:
India earns about 27% of its total foreign exchange through textile exports and contributes nearly 14% of the total industrial production of the country. Indian textile industry is the largest in the country in terms of employment generation; currently it generates employment more than 35 million people. It is also estimated that the industry will generate 12 million new jobs by the year 2014.
World’s total textile demand and production base distribution:
World population will grow from the present 5.4 billion to 10 billion in 2050, and further to 11.6 billion in 2150 when it is expected to reach a steady state. The total textile consumption forecast is going to double, even using the current figure of per capita annual average textile consumption (8kg/person).[2]
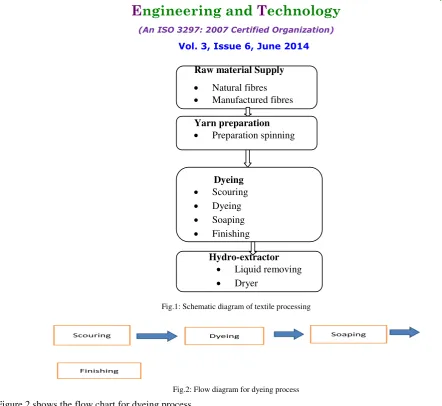
Processes used in Small Scale Textile Industries: Figure 1 revels the flowchart for textile processing.
Raw material Supply: Natural fibers may be organic or inorganic in nature. Man-made fibers are broadly classified as organic regenerated natural fibers
Raw material Supply
Natural fibres
Manufactured fibres
Yarn preparation
Preparation spinning
Dyeing
Scouring
Dyeing
Soaping
Finishing
Hydro-extractor
Liquid removing
Dryer
Fig.1: Schematic diagram of textile processing .
Fig.2: Flow diagram for dyeing process
Figure 2 shows the flow chart for dyeing process.
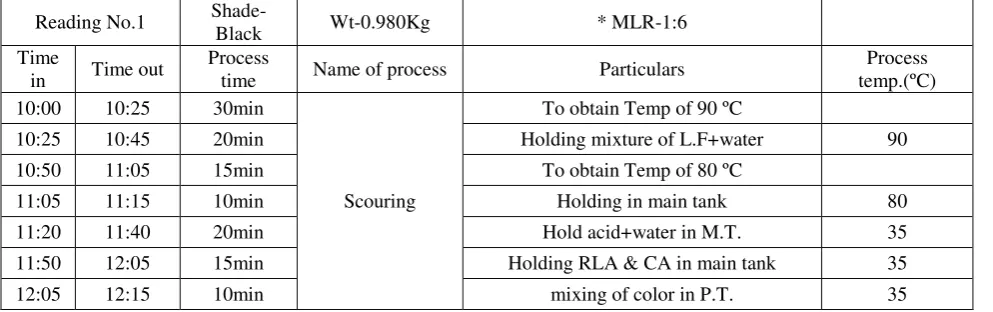
Scouring is the process of removal of natural oil substances like waxes, fats and pectin’s as well as added impurities like lubricating oil, dust, dirt and residual starch in cotton materials. Scouring means holding mixture of water and scouring agent like saracol at high temp. Scouring is done at 90-110⁰C.
Dyeing is a process of driving the cheese with dyes at 60⁰C for one hour. Temperature and time of dyeing process is depends on type of shade whether it is dark or light.
Soaping is post process in dyeing.Soaping is the process of removal of extra dyestuff which is coagulated on cheese. Soaping is done at 80-90⁰C in presence of soaping agents.
Finishing is a last process in dyeing. It includes two hot washes but for dark shade more than two hot washes are given till bath is not clear. After finishing, yarn is passed through hydro extracting machine for further processing.[4][6] There are different analysis techniques of optimization such as
1. Fuzzy decision system a) similarity analysis b) Decision analysis 2. Cluster analysis. 3. Soft computing techniques
4 Generic Algorithm 5. Fuzzy logic control
6. Pinch analysis 7. Stochastic mechanics approaches
Pinch technology is simple methodology of systematically analyzing chemical processes and the surrounding utility systems with the help of first and second law of thermodynamics. The first law provides the energy equation for calculating enthalpy changes (H) and the second law determines the direction of heat flow that is heat energy may only flow in the direction of hot to cold.
opportunity. This technology is used in projects relating to energy saving in industries such as iron and steel , food and drink , textiles ,paper and cardboards , cements , base chemicals, oil and petrochemicals.
Bench Scale Experimental Results:
The optimization of variable parameters in dyeing process were conducted on bench scale unit as shown in Fig.3 and the block diagram for the same is depicted in Fig.4. The variable identified for the energy optimizations were temperature of dyeing process, time for dyeing process and consistency in the dyeing (water quantity, chemicals used for processing, quality and concentration of the dye etc.). The observations and results presented in Table No. 1 to ----.
Fig3: Bench scale experimental unit for dyeing process
1 .PREP TANK 2. MIXER ARRANGEMENT 3. MAIN TANK 4 – SPINDLE
5 CARRET 6. DOSING TANK 7. PIPE CONNECTION PREP. TO M.T
8. PIPE CONECTION M.T TO D.T 9.IN-OUT&OUT-IN ARRANGEMEN
10. PUMP 11 .MOTOR 12.WATER RESERVOIR 13 & 14 CONTROL PANEL
Fig. : Block diagram for bench scale experimental unit for dyeing process
II. LITERATURE REVIEW
Dr. Nasir Mukhtar Gatawa and Prof. C. U. Aliyu (2013) [1] Presented that electricity consumption has significant positive influence on textile output. Stable and reliable power supply is necessary to generate optimum production at lower cost so as to enhance utilization of idle resources, expand factor incomes, improve competitiveness and expand overall textile output
MAIN TANK
PREP DOSING
Prof. Tanaji Dabade and Dr. Shivaji Gawade (2012) [2] presented that the textile industry holds significant status in the India and it accounts for 14% of the total industrial production. It contributes to nearly 30% of the total exports and it is the second largest employment generator after agriculture.
Khalil Elahee (2011) [3]Described the techniques and technologies of heat recovery from waste water and exhaust air are analyzed. Experiences prove that in most cases heat recovery requires low investment and has a low payback of normally less than 2 years. The case of the Mauritian dyeing and finishing industry is highlighted, including the possible use of a low-cost heat recovery unit made from indigenous resources.
Ali Hasanbeigi (2010) [4] presented information on energy-efficiency technologies and measures applicable to the textile industry. The guidebook includes case studies from textile plants around the world and includes energy savings and cost information when available. An analysis of the type and the share of energy used in different textile processes has carried out. Subsequently, energy-efficiency improvement opportunities available within some of the major textile sub-sectors are given with a brief explanation of each measure. The conclusion includes a short section dedicated to highlighting a few emerging technologies in the textile industry as well as the potential for the use of renewable energy in the textile industry.
Mr. S. Ashok (2010) [5]presented that electricity consumption is increasing in Textile mills, due to prolonged use of the equipments in inefficient operating parameters. So focus area now is Energy consumption @ load end and by optimizing the energy usage of textile machines, we can have multiple benefits of less units per kg of yarn and health of machines enhance.
Ahmet Cay (2009) [6] described the study of the energetic assessment of exhaustion processes for textile fabrics using actual operational data. The process temperature and time, water inlet temperature and liquor ratio were found to be the main parameters that affect energy destruction rates. The effects of carry-over on energy destruction rates were also investigated. It was shown that, 23% and 50% of total energy destruction rate were occurred by the bleaching and the washing steps for cotton finishing, respectively, while 32% of total was accounted for the dyeing step of polyester finishing. High temperature processes had higher energy efficiency values.
Nahed S. E. Ahmed (2009) [7] described that the textile coloration is a wet process that uses dyes, chemicals, and large volume of water. The driving force being the need for cleaner, cost-effective, and value-added textile products. This review will provide a summary of recent developments in the coloration of textile fiber. Emphasis will be paid to the new technologies, in particular those based on physicochemical means such as nanotechnology, electrochemistry, supercritical carbon dioxide coloration, plasma, ultrasonic and microwave, and their uses in the coloration of textile fibers.
Rajakumari et al., 2008 [8] have invented and studied inputs for treating textile waste water using pretreatment, reverse osmosis and evaporator for to representative textile waste water treatment plants. Study reveals that evaporator consumes 48% of electricity, which contribute for more global warming potential than other treatment unit.
Table No.1 Bench scale data for dark shade as per the dyeing process
Reading No.1 Shade-
Black Wt-0.980Kg * MLR-1:6
Time
in Time out
Process
time Name of process Particulars
Process temp.(ºC) 10:00 10:25 30min
Scouring
To obtain Temp of 90 ºC
10:25 10:45 20min Holding mixture of L.F+water 90
10:50 11:05 15min To obtain Temp of 80 ºC
11:05 11:15 10min Holding in main tank 80
11:20 11:40 20min Hold acid+water in M.T. 35
11:50 12:05 15min Holding RLA & CA in main tank 35
12:15 12:35 20min
Dyeing
Holding color in M.T. 35
12:53 12:45 10min Mixing salt in P.T. 35
12:45 1:05 20min Holding mixture (salt + color) 35
1:05 1:17 20min obtain temp mixture to 60 ºC 60
1:17 1:47 30min Holding mixture in main tank 60
1:47 2:07 20min soda dosing from D.T. 60
2:07 2:22 10min caustic dosing 60
2:22 3:27 65min Holding the mixture 60
3:30 3:40 10min Cold wash 35
3:40 4:00 20min Acid wash 35
4:05 4:22 20min obtain temp 90 ºC
4:22 4:42 20min Holding mixture (saracol+water) 90
4:45 5:00 15min obtain temp 80 ºC
5:00 5:10 10min Hot wash 80
5:17 5:32 15min
Soaping
Acid wash 35
5:35 5:50 15min obtain temp of 80
5:50 6:00 10min Holding in M.T. 80
6:02 6:17 15min obtain temp of 80 ºC
6:17 6:27 10min Hold in M.T. 80
6:30 6:35 5min Add 6069 ,210 ,acid , C.A
6:35 6:45 10min
Finishing To obtain temp.50 ºC 50
6:45 7:15 30min Holding in main tank 50
* MLR- Mass of Cotton to Liquor ratio
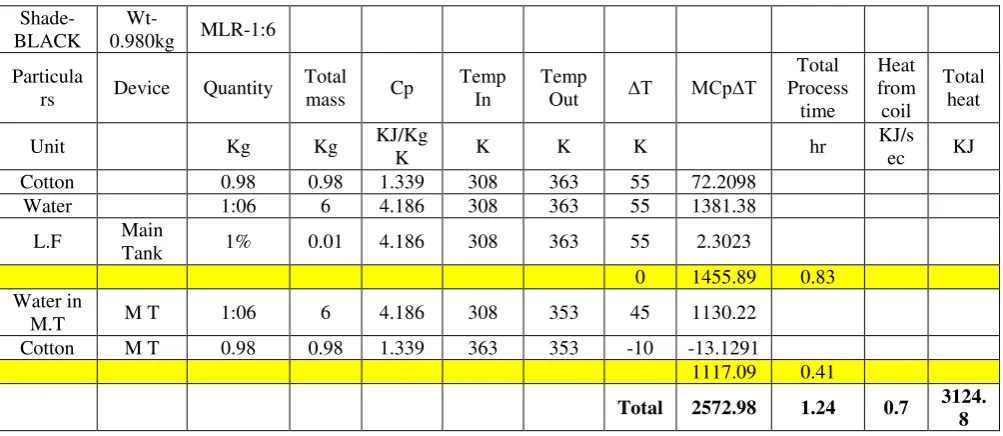
Table No.2: Calculations for total theoretical energy requirements for scouring process
Shade-BLACK
Wt-0.980kg MLR-1:6
Particula
rs Device Quantity
Total mass Cp
Temp In
Temp
Out ∆T MCp∆T
Total Process
time
Heat from coil
Total heat
Unit Kg Kg KJ/Kg
K K K K hr
KJ/s ec KJ
Cotton 0.98 0.98 1.339 308 363 55 72.2098
Water 1:06 6 4.186 308 363 55 1381.38
L.F Main
Tank 1% 0.01 4.186 308 363 55 2.3023
0 1455.89 0.83 Water in
M.T M T 1:06 6 4.186 308 353 45 1130.22
Cotton M T 0.98 0.98 1.339 363 353 -10 -13.1291
1117.09 0.41
Total 2572.98 1.24 0.7 3124.
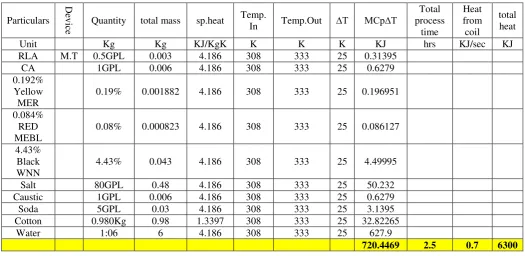
Table No.3: Calculations for total theoretical energy requirements for dyeing process
Particulars
Dev
ice Quantity total mass sp.heat Temp.
In Temp.Out ∆T MCp∆T
Total process
time
Heat from coil
total heat
Unit Kg Kg KJ/KgK K K K KJ hrs KJ/sec KJ
RLA M.T 0.5GPL 0.003 4.186 308 333 25 0.31395
CA 1GPL 0.006 4.186 308 333 25 0.6279
0.192% Yellow
MER
0.19% 0.001882 4.186 308 333 25 0.196951
0.084% RED MEBL
0.08% 0.000823 4.186 308 333 25 0.086127
4.43% Black WNN
4.43% 0.043 4.186 308 333 25 4.49995
Salt 80GPL 0.48 4.186 308 333 25 50.232
Caustic 1GPL 0.006 4.186 308 333 25 0.6279
Soda 5GPL 0.03 4.186 308 333 25 3.1395
Cotton 0.980Kg 0.98 1.3397 308 333 25 32.82265
Water 1:06 6 4.186 308 333 25 627.9
720.4469 2.5 0.7 6300
Table No.4: Calculations for total theoretical energy requirements for soaping process
Mass Analysis
Particulers Device Quantity Total
mass Cp
Temp In
Temp
Out ∆T MCp∆T
Total process
time
Heat from coil
Total heat
Unit Kg Kg KJ/KgK K K K KJ Hrs KJ/sec KJ
Saracoal M.T 1GPL 0.01 4.19 308 363 55 1.38138
Cotton 0.98 0.98 1.34 308 363 55 72.2098
Water 1:06 6 4.19 308 363 55 1381.38
1454.97 0.6 0.7 1537.2 Cotton M.T 0.980kg 0.98 1.34 363 353 -10 -13.129
Water in
M.T M.T 1:06 6 4.19 308 363 55 1381.38
1368.25 0.4 0.7 1033.2 Cotton M.T 0.980kg 0.98 1.34 308 353 45 59.0808
Water in
M.T M.T 1:06 6 4.19 308 353 45 1130.22
1189.3 0.4 0.7 1033.2
Water in
M.T M.T 1:06 6 4.19 308 353 45 1130.22
1130.22 0.4 0.7 1033.2
Table No.5 :Calculations for total theoretical energy requirements for finishing process
Mass Analysis
Particulers Device Quantity Total
mass Cp
Temp In
Temp
Out ∆T MCp∆T
Total process
time
Heat from coil
Total heat
Unit Kg Kg KJ/KgK K K K KJ Hrs KJ/sec KJ
210 2% 0.02 4.186 308 323 15 1.2558
6069 3% 0.0245 4.186 308 323 15 1.538355
CA M.T 0.20% 0.002 4.186 308 323 15 0.12558
Cotton 0.98 0.98 1.3397 308 323 15 19.69359
Water 1:06 6 4.186 308 323 15 376.74
A.Acid 0.30% 0.0025 4.186 308 323 15 0.153836
399.5072 0.66 0.7 1663
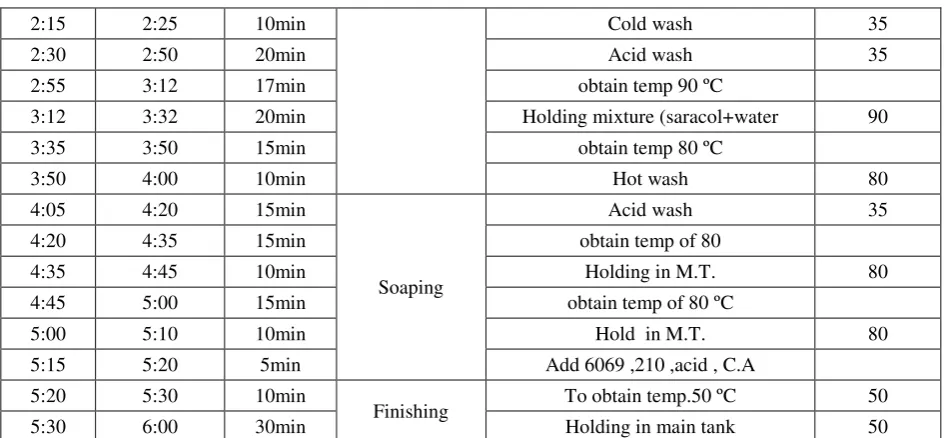
Table No.6: Effect of changing parameters on heat consumption during dyeing process.
Shade- Black
Wt-0.980Kg MLR-1:6
Time in Time out Process time
Name of
process Particulars
Process temp.( ºC)
9:00 9:30 30min
Scouring
To obtain Temp of 90 ºC
9:30 9:50 20min Holding mixture of L.F+water 90
9:55 10:10 15min To obtain Temp of 80 ºC
10:10 10:20 10min Holding in main tank 80
10:24 10:44 20min Hold acid+water in M.T. 35
10:50 11:05 15min Holding RLA & CA in main tank 35
11:05 11:15 10min mixing of color in P.T. 35
11:15 11:35 20min
Dyeing
Holding color in M.T. 35
11:35 11:45 10min Mixing salt in P.T. 35
11:45 12:05 20min Holding mixture (salt + color) 40
12:05 12:17 12min obtain temp mixture to 40 ºC 40
12:17 12:47 30min Holding mixture in main tank 40
12:47 1:07 20min soda dosing from D.T. 40
1:07 1:22 15min caustic dosing 40
2:15 2:25 10min Cold wash 35
2:30 2:50 20min Acid wash 35
2:55 3:12 17min obtain temp 90 ºC
3:12 3:32 20min Holding mixture (saracol+water 90
3:35 3:50 15min obtain temp 80 ºC
3:50 4:00 10min Hot wash 80
4:05 4:20 15min
Soaping
Acid wash 35
4:20 4:35 15min obtain temp of 80
4:35 4:45 10min Holding in M.T. 80
4:45 5:00 15min obtain temp of 80 ºC
5:00 5:10 10min Hold in M.T. 80
5:15 5:20 5min Add 6069 ,210 ,acid , C.A
5:20 5:30 10min
Finishing To obtain temp.50 ºC 50
5:30 6:00 30min Holding in main tank 50
Table No.7: Heat consumption during dyeing process due to change in parameters
Mass Analysis
Particuler s
Devic e
Quantit y
Total
mass Cp
Tem p In
Tem p Out
∆
T MCp∆T
Total proces s time
Heat from coil
Tota l heat
Unit Kg Kg KJ/Kg
K K K K KJ Hrs
KJ/se
c KJ
RLA M.T 0.5GPL 0.003 4.186 308 313 5 0.06279
CA 1GPL 0.006 4.186 308 313 5 0.12558
0.192%Yellow
MER 0.19%
0.00188
2 4.186 308 313 5 0.03939
0.084%RED
MEBL 0.08%
0.00082
3 4.186 308 313 5
0.01722 5 4.43%Black WNN 4.43% 0.043 4.186 308 313 5 0.89999
Salt 80GPL 0.48 4.186 308 313 5 10.0464
Caustic 1GPL 0.006 4.186 308 313 5 0.12558
Soda 5GPL 0.03 4.186 308 313 5 0.6279
Cotton 0.980K
g 0.98 1.34 308 313 5 6.56453
Water 1:06 6 4.186 308 313 5 125.58
144.089
III.RESULT
Sr. No.
Processes Total Heat
Required
Total Supplied Heat
1 Scouring 2572.983 2187.36
2 Dyeing 144 4914
3 Soaping 5142.743 4636.8
4 Finishing 399.5072 1663.8
Total 8259.3172 13402
Total heat loss = 5142.643
% heat loss = 38.37%
Based on large number experiments conducted on bench scale unit, thermal analysis for optimized operating parameters for various operations are carried out through thermal equation Q=M.Cp.(T2-T1) where, Q heat supplied Cp specific heat T2-T1 process temperature difference.
As per results obtained from calculation graph is plotted of percentage heat loss Vs temperature at various time as shown in Fig. Optimum point was determined at 60⁰ C and 50 min of dyeing process. The percentage heat loss at that point is 36.57%.
Graph1: Percentage heat loss Vs temperature at various time
Quality confirmation at optimized parameters for dyeing process:
Color fastness is the resistance of a material to change any of its color characteristics or extent of transfer of its colorants to adjacent white material in touch the color fastness is usually rated either by loss of depth of color in original sample or it is also expressed by staining scale i.e. the accompanying white material gets tinted or stained by color of original fabric. However, among all types of color fastness, light fastness, wash fastness and rub fastness are considered generally for any textiles; perspiration fastness is considered specifically for apparels only.
of the natural dyes have poor light stability as compared to the best available synthetic dyes and hence the colors in museum textile are often different from their original color.
Duff studied the light fastness and wash fastness under the standard condition (50ºC) and also at 20ºC with washing formulation used in conservation work for restoring of old textiles. Some dyes undergo marked changes in hue on washing due to presence of even small amount of alkali in washing mixture, highlighting the necessity to know the pH of alkaline solution used for the cleaning of textile dyed with natural dyes. As a general rule, natural dyes show moderate wash fastness on wool, as assessed by the ISO II test.
In general, rub fastness of most of natural dyes is found to be moderate to good and does not require after treatment. However, it must be remembered that the color fastness of natural dyes not only depends upon chemical nature and type of natural colorants, but also on chemical nature and type of mordant’s being used. So a dyer must know the use of proper combination of fiber-mordant to achieve best color fastness.
Keeping the dyeing quality in view, particularly rubbing and washing and the results obtained are presented in the Table No.8.
Table No. 8 Heat loss assessment for obtaining quality product after dyeing
Temp (⁰C) Time (min) Rubbing Fastness Washing Fastness
Heat loss
(KJ)
40 50 Yes* Yes 5142.643
40 60 Yes Yes 5545.247
40 65 Yes Yes 6099.627
50 60 No** No 4983.85
50 50 No No 4681.459
50 65 No No 5685.69
60 50 No No 5095.12
60 60 No No 5724.88
60 65 No No 6889.12
70 50 Yes Yes 5271.267
70 60 Yes Yes 5699.667
70 65 Yes Yes 5901.207
*Yes - indicates transfer of its colorants to adjacent white material **No- indicates there is no transfer of colorants to adjacent white material
IV. CONCLUSION
The objective was to optimize the process parameters and experiments were conducted by varying different parameters such as temperature, time, etc. A mathematical calculations have been carried out for heat consumption. It is found that process parameters have the significant influence on the heat consumption.
model. Use of reliability model will result in lower consumption of raw materials, water, dyes and energy, enabling the dyeing units in lowering the environmental pollution.
V. ACKNOWLEDGEMENT
Authors are grateful to M/s Cotspin Textiles Pvt. Ltd., Thane, M/s Shree Chintamani Silk Mills Pvt. Ltd., Theur, Pune, Prerna Yarn Dyeing Industry, Islampur, Sangli for giving necessary permission and also equipment along with chemicals for conducting the optimization studies at their premises. Authors also thank Dr. S. N. kaul, Fmr. Actg. Director, NEERI, Nagpur for his technical inputs.
REFERENCES
[1] Dr. Nasir Mukhtar Gatawa and Prof. C. U. Aliyu, “Impact of globalisation on textile industries: A case study of some nigerian industries in kano metropolis” EconomicsUsmanu Danfodiyo University, Sokoto, 2013.
[2] Tanaji Dabade, Dr. Shivaji Gawade and Prof. Balaji Khune, “Solapur textile industry an overview on marketing and financial problems” zenith International Journal of Multidisciplinary Research Vol.2 Issue 5, ISSN 2231 5780, May 2012.
[3] Khalil Elahee, “Heat recovery in the textile dyeing and finishing industry: lessons from developing economies” University of Mauritius, 2011.
[4] Mr. S. Ashok, Coimbotor, “Energy-Efficiency Improvement Opportunities for the Textile Industry” Ali Hasanbeigi , China Energy Group, Energy Analysis Department, Environmental Energy Technologies Division, Lawrence Berkeley National Laboratory, 2010. [5] Prof. Y. M. Indi, 2009, “Process control and safety in chemical processing”, Process control and safety in chemical processing of textiles, 2009.
[6] Ahmet Cay a, Is_ık Tarakcıog˘lu a, Arif Hepbasli b, “Assessment of finishing processes by exhaustion principle for textile fabrics: An energetic approach” Applied Thermal Engineering 29 , 2554–256, 2009.
[7] Nahed S. E. Ahmed, Reda M. El-Shishtawy, “The use of new technologies in coloration of textile fibers” Springer Science+Business Media, LLC 2009, December 2009.
[8] S Priscilla Rajakumari and S Kanmani, “Environmental life cycle assessment of zero liquid discharge treatment technologies for textile industries, Triupur- A case study”, Journal of scientific and Industrial Research, Vol 67. PP461-467, June 2008. [9] T. Markis a, J.A. Paravantis b, “Energy conservation in small enterprises” a University of Ioannina, Ioannina, Greece, b University of Piraeus, Department of Technology Education and Digital Systems, 185 34 Piraeus, Greece,August 2006.