SEISMIC EVALUATION OF COUPLING EFFECTS BETWEEN
PRIMARY AND SECONDARY SYSTEM BY USING MODIFIED BNL
BENCHMARK MODEL
Bub-Gyu Jeon1, Hyoung-Suk Choi2, Dae-Gi Hahm3 and Nam-Sik Kim4
1Ph.D Candidate,Dept. of Civil and Environmental Engineering, Pusan National University,Busan,Korea 2Researcher, KOCED Seismic Simulation Test Center, Pusan National University, Yangsan, Korea 3Integrated Safety Assessment Division, Korea Atomic Energy Research Institute, Daejeon, Korea 4Professor, Dept. of Civil and Environmental Engineering, Pusan National University, Busan, Korea
ABSTRACT
Base isolation is considered as a seismic protective system in the design of next generation Nuclear Power Plants. Nuclear structures, secondary systems and components must remain undamaged during and after the Safe Shutdown Earthquake(SSE) event. The seismic events will cause the high seismic response in the stiff structural systems and extremely high demands on the safety-related secondary systems like piping components. Seismic isolation of primary systems like containment building substantially mitigates these high demands on its own components and also secondary system components such as main piping systems by reducing the natural frequency of the Nuclear Power Plants. Many studies have been conducted on the base isolation as a seismic protective measure to structures. Most previous studies showed significant reductions in the seismic response of secondary systems through the use of properly designed seismic isolation systems [Huang et al. (2010)]. This paper presents the inelastic analysis results of coupled and uncoupled system that the piping systems connected to the base isolated primary structure with a conventional isolation bearing. Inelastic seismic response evaluation is performed for seismic fragility analysis of NPP piping system.
INTRODUCTION
If seismic isolation devices are installed in nuclear power plant for seismic stability, safety for seismic load of power plant may improve. But in some equipments, seismic risk may increase because displacement may became greater than before installation of seismic isolation device. Therefore, it is estimated necessary to select the equipments in which seismic risk increases due to increase in displacement by the installation of seismic isolation device, and conduct research on seismic performance of each equipment.
Coupled seismic analysis of major subsystems with different characteristic has been performed by Johnson and McCaffery [Johnson et al. (1969)]. Tsai to estimate equivalent model damping ratios of coupled system based on component mass or stiffness [Tsai (1979)]. A coupled building-piping/equipment system with difference damping characteristics for evaluation and verification of state-of-the-art analysis methods and computer programs for performing seismic analysis of coupled structures with non-classical damping was developed by Brookhaven National Laboratory(BNL) under contract to the U.S. Nuclear Regulatory Commission(USNRC), Office of Nuclear Regulatory Research [Xu et al. (2004)].
system for a typical Pressurized Water Reactor(PWR) plant and feedwater piping system for a Boiling Water Reactor(BWR) plant were fabricated and subjected to a large number of earthquake motions at NUPEC's Tadotsu Engineering Laboratory. The observed dynamic responses indicated that the piping systems, even with conventional snubber supports, were highly complex nonlinear structures due mainly to various mechanical gaps in the support structures [Park et al (1997)].
In this study, coupled and uncoupled model which is modified NRC-BNL benchmark models were used for seismic analysis. The numerical models include representations of isolation bearings. Time history analysis is conducted on the piping system coupled with the primary buildings and the analysis is repeated for the uncoupled model of the system. The results of both coupled and uncoupled analysis are compared. In order to determine the failure mode and stress distribution of the piping system, quasi-static loading test is conducted on the piping components before the analysis procedures. The experimentally established failure mode of the piping system is used for the validation of numerical model considered for the fragility analysis. The fragility analysis finally performed by using results of inelastic seismic response analysis.
NUMERICAL MODELS
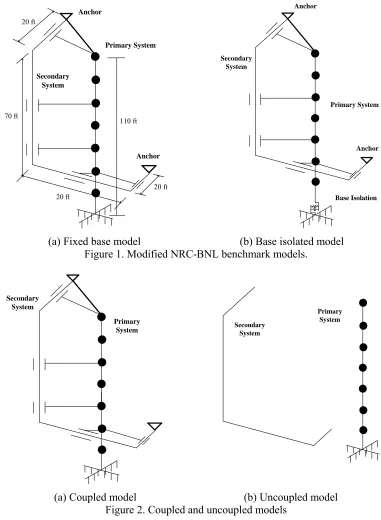
In this study, main structures were respectively defined as the primary system(nuclear power plant buildings) and the secondary system(piping system) that link them as subsidiary structures. Therefore, modified NRC-BNL benchmark models as shown in Fig. 1 which is define the fixed base model and the base isolated model according to isolation system and Fig. 2 which is divided according to coupling of each system were used for seismic response analysis. This model designed to be representative of a realistic complex model of a nuclear power plant building and piping system. The secondary system of NRC-BNL benchmark model was considered an added mass like a water or steam. but modified model only considered a pipeline and never considered about any added masses. Thus, fundamental natural frequency of secondary system is bigger than original models. The fundamental natural frequency of original benchmark model is 8.24Hz.
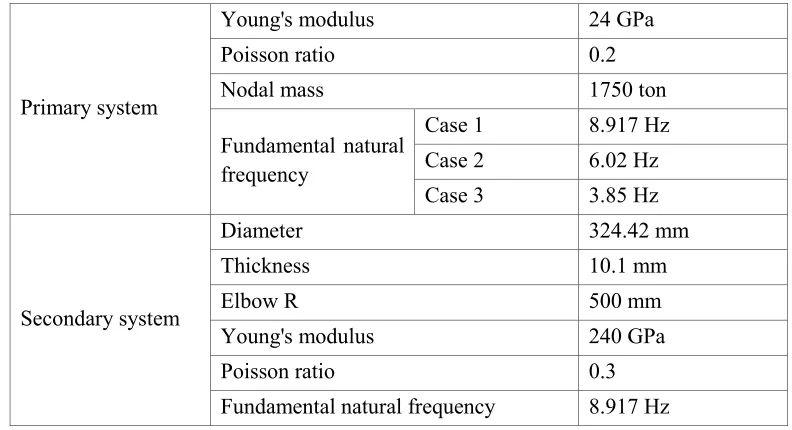
Table 1: Material properties and fundamental natural frequencies of numerical models.
Primary system
Young's modulus 24 GPa
Poisson ratio 0.2
Nodal mass 1750 ton
Fundamental natural frequency
Case 1 8.917 Hz
Case 2 6.02 Hz
Case 3 3.85 Hz
Secondary system
Diameter 324.42 mm
Thickness 10.1 mm
Elbow R 500 mm
Young's modulus 240 GPa
Poisson ratio 0.3
Fundamental natural frequency 8.917 Hz
connected with each other by rigid massless beam elements. Material properties and fundamental natural frequencies of systems are shown in Table 1. The primary system have 3 case of fundamental natural frequencies. The case 1 is proposed in NRC-BNL benchmark model for check the dynamic behavior of secondary system. The fundamental natural frequency of case 2 and case 3 are equal to the auxiliary building and the reactor building in SHIN KORI #3, 4 nuclear power plant which is Advanced Power Reactor(APR 1400) in Korea. The base isolated model include representation of isolation system. The first mode natural frequency and the damping ratio of isolation system are estimated 0.5Hz and 10% respectively. Linear spring and dashpot elements are used for the isolation system.
Primary System
Secondary System
Anchor
Anchor 20 ft
70 ft
20 ft
110 ft
20 ft
Base Isolation Anchor
Primary System
Anchor Secondary
System
(a) Fixed base model (b) Base isolated model
Figure 1. Modified NRC-BNL benchmark models.
Primary System Secondary
System
Primary System Secondary
System
INPUT GROUND MOTION
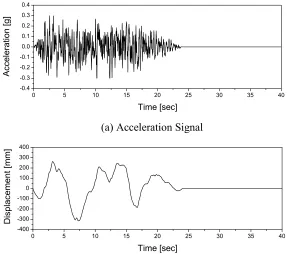
Artificial earthquake ground motions which comply with the design ground response spectra (DGRS) requirements of USNRC RG. 1.60 [USNRC (2007)] and SRP. 3.7.1 [USNRC (1973)] as shown in Fig. 3 are generated. Envelope function of artificial earthquake complies with the ASCE 4-98 [ASCE (1999)] standards as shown in Fig 4 and Table 2. The duration of strong ground motion is 13sec which satisfies the requirements of SRP. 3.7.1 and the total time duration is 24sec. The peak ground acceleration is 0.3g and the time step is 0.01sec. Fig. 5 and Fig. 6 are time history of artificial earth quake and response spectrums.
Figure 3. Design ground response spectra (DGRS) of USNRC RG. 1.60.
Figure 4. Duration enveloping function of ASCE 4-98.
Table 2: Duration Enveloping Function Parameters
Magnitude Rise Time (t
1)
Duration of Strong Motion
(t2 -t1) Decay Time (t3 )
7.0-7.5 2 13 9
6.5-7.0 1.5 10 7
6.0-6.5 1 7 5
5.5-6.0 1 6 4
5.0-5.5 1 5 4
1 10 100
0.01 0.1 1 10
Design Response Spectra : 5% Damping in Reg 1.60
Ac
celerat
ion
[g]
Frequency [Hz]
Time(sec) ( )
j A t
3
t
2
t
1
t
0 5 10 15 20 25 30 35 40 -0.4
-0.3 -0.2 -0.1 0.0 0.1 0.2 0.3 0.4
Ac
celerat
ion
[g]
Time [sec]
(a) Acceleration Signal
0 5 10 15 20 25 30 35 40
-400 -300 -200 -100 0 100 200 300 400
D
is
plac
em
ent
[m
m
]
Time [sec]
(b) Displacement Signal
Figure 5. Generated artificial earthquake
SEISMIC ANALYSIS OF COUPLED AND UNCOUPLED MODEL
Time history analysis was conducted on the secondary system(pipeline structure) coupled with the primary system(nuclear power plant building). This analysis was performed by displacement control and implicit time integration method in ABAQUS 6.12. Here, time increment size and integration solution technique were 0.01sec and Full-Newton respectively. The analysis cases are shown in Table 3. The frequency ratio of cases are 1.00, 1.48 and 2.31 respectively. The case 1 is resonance case. The fundamental natural frequency of secondary system in case 2 and case 3 are equal to the auxiliary building and the reactor building in SHIN KORI #3, 4 nuclear power plant which is Advanced Power Reactor(APR 1400) in Korea.
The analysis was repeated for the uncoupled model of the primary and secondary system using the input ground motion and response signals at the appropriate points of primary system respectively. The results of both coupled and uncoupled analysis are compared. Guides, elbow and connection point between guide and primary system were used for measurement points as shown in Fig. 6
DifferenceError = coupledmax uncoupledmax
coupled max
R R
R
(1)
Find out the difference of the response of coupled model and that of uncoupled model, in this paper, difference error like expression Equation (1) was used. Here, Rcoupled and Runcoupled represent the
Table 3: Seismic analysis cases of coupled and uncoupled model.
Case Frequency Ratio (Primary/Secondary) Note
1 1.00 (8.91/8.91) Benchmark Primary bldg.
2 1.48 (8.91/6.02) Auxiliary bldg. of APR1400
3 2.31 (8.91/3.85) Reactor bldg. of APR1400
E1
E2
E3 P1
P2
P3 Top
P4
P5
P6 P7
Figure 6. Measurement points.
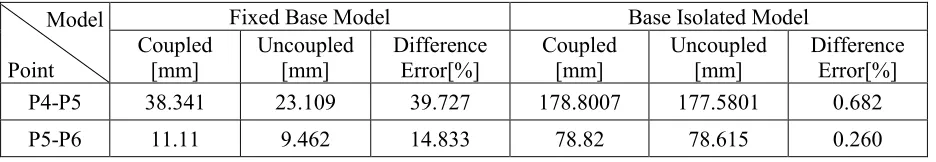
The results of analysis of seismic response for horizontal direction indicated that in case secondary system which has seven points like the pipe elbow and support in secondary system of Fig. 6. Table 4~6 shows the comparison of the difference errors of the maximum displacement responses of coupled system and uncoupled system of each analysis model. The displacement response error of the coupled/uncoupled system of base isolated model is smaller than fixed base model. But the gap was not too big except the case 1. In the table 4, the fixed based model of case 1 is resonance case. Because of that, difference errors of fixed base system is bigger than other cases. Table 7~9 was shown that difference error of relative displacement between two guides. The difference error of relative displacement response on the base isolated model is smaller than fixed base model.
Table 4: Comparison of the difference errors of the maximum displacement responses of case 1
Model
Point
Fixed Base Model Base Isolated Model
Coupled
[mm] Uncoupled [mm] Difference Error[%] Coupled [mm] Uncoupled [mm] Difference Error[%]
E1 157.271 99.562 36.694 134.685 132.636 1.521
E2 121.128 174.962 44.444 233.055 232.773 0.121
E3 312.332 175.422 43.835 235.306 233.785 0.646
P4 74.009 16.832 28.908 22.3758 22.3278 0.215
P5 61.133 116.516 90.593 156.478 155.179 0.830
P7 316.069 175.404 44.505 235.306 233.785 0.646
Table 5: Comparison of the difference errors of the maximum displacement responses of case 2
Model
Point
Fixed Base Model Base Isolated Model
Coupled
[mm] Uncoupled [mm] Difference Error[%] Coupled [mm] Uncoupled [mm] Difference Error[%]
E1 330.106 329.859 0.075 134.061 134.473 0.307
E2 320.988 321.576 0.183 232.375 221.329 4.754
E3 316.202 321.048 1.533 235.261 233.807 0.618
P4 330.533 326.627 1.182 22.4114 22.3287 0.369
P5 324.347 322.866 0.457 156.437 155.198 0.792
P6 320.448 321.038 0.184 235.237 233.807 0.608
P7 316.071 321.038 1.571 235.262 233.807 0.618
Table 6: Comparison of the difference errors of the maximum displacement responses of case 3
Model
Point
Fixed Base Model Base Isolated Model
Coupled
[mm] Uncoupled [mm] Difference Error[%] Coupled [mm] Uncoupled [mm] Difference Error[%]
E1 373.500 373.072 0.115 134.738 134.512 0.168
E2 320.443 329.938 2.963 233.056 224.872 3.512
E3 315.951 328.894 4.097 235.308 233.864 0.614
P4 367.799 360.391 2.014 22.41 22.3311 0.352
P5 329.588 337.901 2.522 156.473 155.249 0.782
P6 319.804 328.889 2.841 235.281 233.864 0.602
P7 316.024 328.889 4.071 235.308 233.864 0.614
Table 7: Comparison of the difference error of relative displacement response of case 1
Model
Point
Fixed Base Model Base Isolated Model
Coupled
[mm] Uncoupled [mm] Difference Error[%] Coupled [mm] Uncoupled [mm] Difference Error[%]
P4-P5 133.974 133.2927 0.508 178.775 177.506 0.709
P5-P6 115.3804 59.055 48.817 78.818 78.606 0.268
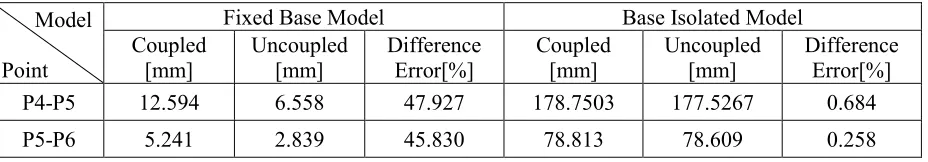
Table 8: Comparison of the difference error of relative displacement response of case 2
Model
Point
Fixed Base Model Base Isolated Model
Coupled
[mm] Uncoupled [mm] Difference Error[%] Coupled [mm] Uncoupled [mm] Difference Error[%]
P4-P5 12.594 6.558 47.927 178.7503 177.5267 0.684
Table 9: Comparison of the difference error of relative displacement response of case 3
Model
Point
Fixed Base Model Base Isolated Model
Coupled
[mm] Uncoupled [mm] Difference Error[%] Coupled [mm] Uncoupled [mm] Difference Error[%]
P4-P5 38.341 23.109 39.727 178.8007 177.5801 0.682
P5-P6 11.11 9.462 14.833 78.82 78.615 0.260
CONCLUDING REMARKS
Coupled and decoupled seismic analyses are conducted by using modified NRC-BNL benchmark models and the results of the analysis are compared. As a result of seismic response analysis, in base isolated model, difference error between coupled and uncoupled model is under 5%. Therefore, it may be possible to use uncoupled model to perform the seismic performance evaluation.
ACKNOWLEDGMENTS
This work was supported by the energy efficiency & resources of the Korea Institute of Energy Technology Evaluation and Planning (KETEP) grant funded by the Korea government Ministry of Knowledge Economy (No. 2011T100200080).
REFERENCES
Huang, Y. N., Whittaker, A. S., and Luco, N. (2010). “Seismic Performance Assessment of Base-Isolated Safety-Related Nuclear Structures,” Earthquake Engineering and Structural Dynamics, 39,
1421-1442.
Johnson, T. E. and McCaffery, R.J. (1969) "Current techniques for analyzing structures and equipment for seismic effects," ASCE, National Meeting on Water Resource, New Orleans.
Tsai, N.C. (1979) "Modal damping for soil-structure interaction" Journal of engineering mechanics, EM2,
323-341.
Xu, J., DeGrassi, G, and Chokshi, N. (2004). “A NRC-BNL benchmark evaluation of seismic analysis methods for non-classically damped coupled systems,” Nuclear Engineering and Design, 228,
345-366.
Park Y., DeGrassi G., Hofmayer C. and Bezler P. (1997) "Analysis of nuclear piping system seismic tests with conventional and energy absorbing supports". 14th International Conference on Structural Mechanics in Reactor Technology (SMiRT 14), Lyon, France.
Response Spectra for Seismic Design of Nuclear Power Plants. (1973). USNRC Regulatory Guide 1.60,
United States Nuclear Regulatory Commission, Washington, USA.
Seismic Design Parameters. (2007). USNRC Regulatory Guide 1.60, United States Nuclear Regulatory
Commission, Washington, D.C., USA.