Simulation of Height of Receptor Using
SCREEN 3 Module for Particulate Matter
Pollutants - TSPM & RSPM
Modi Musalaiah
1, Mayara Srinivasa Rao
2,
Venkata Ramachandra P
3Department of Chemical Engineering, Andhra UniversityVisakhapatnam, Andhra Pradesh, India1,2,3
ABSTRACT: This study is regarding the air pollution in selected areas near to port (beside stack yards of port) interested in particulate matter pollution. In this study, the amount of air pollution due to particulates is analyzed. The amount of air pollution is estimated using SCREEN 3 Methodology. In this study, SCREEN 3 methodology is a predefined software tool which can be used to estimate particulate matter pollution levels at different source release heights, terrain heights and at particular receptor height. The results obtained are reported and finally concluded that to avoid the pollution in the selected area, it is better to construct a periphery along the sides of stack yard (source of pollution).
KEY WORDS: Pollution, Particulate Matter, Stack Pile, SCREEN3, Receptor Height and Terrain Height.
I. INTRODUCTION
Environmental pollution is any discharge of material or energy into water, land, or air that causes or may cause acute (short-term) or chronic (long-term) detriment to the Earth's ecological balance or that lowers the quality of life. Pollutants may cause primary damage, with direct identifiable impact on the environment, or secondary damage in the form of minor perturbations in the delicate balance of the biological food web that are detectable only over long time periods[1]. The word ‘Pollution’ has been derived from a Latin word, 'pollutionem,' which means to make dirty. Pollution causes imbalance in the environment. This imbalance has threatened the every survival of life. It is a threat to the whole world. The increase in pollution has resulted in global warming. Global warming is an average increase in the Earth's temperature due to greenhouse effect as a result of both natural and human activity [2]. Particulate Matter, are tiny pieces of solid or liquid matter associated with the Earth's atmosphere. They are suspended in the atmosphere as atmospheric aerosol, a term which refers to the particulate/air mixture, as opposed to the particulate matter alone. However, it is common to use the term aerosol to refer to the particulate component alone [3 - 5].
Generally the dumping of bulk cargo like iron ore, coal, alumina which is transported to the stack yard from the ships by using trucks and lorry’s can be done is of the form of stack pile. The dust particles liberated from these stack piles can be classified based on the size of the particles (Respirable suspended particulate matter RSPM – PM2.5 & Total suspended particulate matter TSPM – PM10 in microns according to NAAQ) [6].
This paper contains, simulation of height of the stack pile for the pollutants RSPM & TSPM at a particular receptor height and different terrain heights using SCREEN3.
II. MATERIALS AND METHODS
SCREEN3 (version3) module can estimate the maximum Ground Level Concentrations (GLC) and the distance to the maximum GLC. SCREEN3 module software can be used for Point, Flare, Area and Volume source.
SCREEN runs interactively on the PC, meaning that the program asks the user a series of questions in order to obtain the necessary input data, and to determine which options to exercise. SCREEN can perform all of the single source, short-term calculations in the screening procedures document, including estimating maximum ground level concentrations and the distance to the maximum, incorporating the effects of building downwash on the maximum concentrations for both the near wake and far wake regions, estimating concentrations in the cavity recirculation zone, estimating concentrations due to inversion break-up and shoreline fumigation, and determining plume rise for flare releases. The model can incorporate the effects of simple elevated terrain on maximum concentrations and can also estimate 24-hour average concentrations due to plume impaction in complex terrain using the VALLEY model 24-hour screening procedure. The SCREEN module can also be used to model the effects of simple volume sources using a virtual point source procedure. The SCREEN module can also calculate the maximum concentration at any number of user-specified distances in flat or elevated simple terrain, including distances out to 100km for long-range transport.
This model can incorporate the effects of simple flat terrain and elevated terrain on maximum concentrations and can also estimate 24 hour average concentration due to impaction for a flat terrain (0 meters above the base/ground) and an elevated terrain (2 meters above the base/ground). The SCREEN3 simulate by using Guassian plume model.
The Gaussian models are the most common mathematical models used for air dispersion. They are based upon the assumption that the pollutant will disperse according to the normal statistical distribution. Gaussian distribution equation is given by [7],
C 𝑥,𝑦,𝑧 = 𝑄/2𝜋𝑢𝜎𝑦𝜎z {exp [− (𝑧−h)2/2𝜎z2 ]+𝑒𝑥𝑝[ –( 𝑧 +h)2/2𝜎z2 ]}{exp (− 𝑦) 2/2𝜎𝑦2 }
The schematic representation of guassian plume model can be shown in Figure 1.
The Gaussian distribution determines the size of the plume downwind from the source. A schematic representation of the Gaussian Plume is shown in Figure 3.1. The plume size is dependent on the stability of the atmosphere and the dispersion of the plume in the horizontal and vertical directions. These horizontal and vertical dispersion coefficients (σy and σz respectively) are merely the standard deviation from normal on the Gaussian distribution curve in the y and z directions. These dispersion coefficients, σy and σz, are functions of wind speed, cloud cover, and surface heating by the sun. The Gaussian distribution requires that the material in the plume be maintained [8].
In order for a plume to be modelled using the Gaussian distribution, the following assumptions must be made:
I. The plume spread has a normal distribution II. The emission rate (Q) is constant and continuous III. Wind speed and direction is uniform
IV. Total reflection of the plume takes place at the surface
III. RESULTS AND DISCUSSIONS
The average pollutants concentrations are measured in the stack yards (on yearly average basis) of ports which are present in the urban areas of cities is 109.1 & 103.3 µg/m3 for RSPM at flat terrain and elevated terrain respectively, and for TSPM is 307.6 & 291.6 µg/m3 at flat terrain and elevated terrain respectively. The volume source of stack pile having dimensions – source release height of 6m, the initial lateral & vertical dimensions of 25m & 4m at a particular receptor height of 15m above ground under full meteorology conditions.
With reference to the above data, the SCREEN3 module programme has been run by varying the heights of Receptor from 0m to 25m with an interval of 5m, for the terrain heights of 0m (flat terrain) and 2m (elevated terrain) above the base/ground for both the pollutants RSPM & TSPM. The SCREEN3 module program results given in the Table 1.
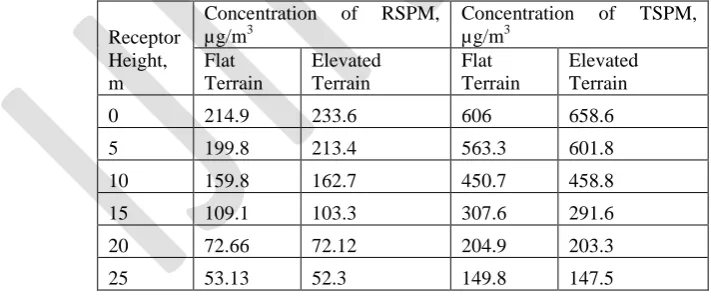
Table 1. Concentration Values of Pollutants for Different Receptor Heights for Flat and Elevated Terrains
Receptor Height, m
Concentration of RSPM, µg/m3
Concentration of TSPM, µg/m3
Flat Terrain
Elevated Terrain
Flat Terrain
Elevated Terrain
0 214.9 233.6 606 658.6
5 199.8 213.4 563.3 601.8
10 159.8 162.7 450.7 458.8
15 109.1 103.3 307.6 291.6
20 72.66 72.12 204.9 203.3
25 53.13 52.3 149.8 147.5
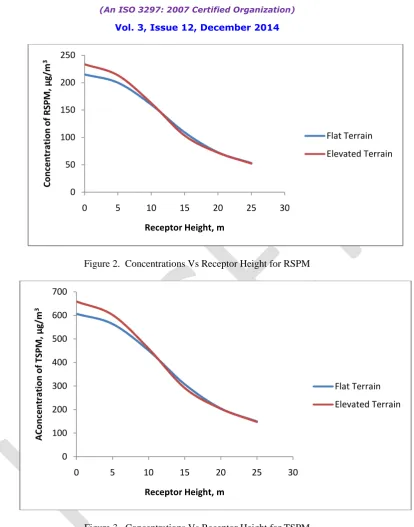
Figure 2. Concentrations Vs Receptor Height for RSPM
Figure 3. Concentrations Vs Receptor Height for TSPM
The wind induced emission rate increases due to excessive threshold shear velocities because of high wind speed during cyclonic storms the considerable amount of particulate matter may be lifted beyond 25m. In such case it may not be effective in the mitigation of the dust pollution which is not a regular phenomenon. In addition due to the increase in moisture contents during the cyclonic storms with precipitation, the windblown dust may not create problem even during cyclonic events. The emission rates mentioned above include only the dust from the bulk material stock yard.
0 50 100 150 200 250
0 5 10 15 20 25 30
Co
n
ce
n
tr
ation
o
f R
SPM
, µ
g/
m
3
Receptor Height, m
Flat Terrain
Elevated Terrain
0 100 200 300 400 500 600 700
0 5 10 15 20 25 30
A
Co
n
ce
n
tr
ation
o
f TS
PM
, µ
g/
m
3
Receptor Height, m
Flat Terrain
IV. CONCLUSIONS
The pollutants (RSPM & TSPM) concentration data were analyzed at the stack yards of the port. Meanwhile, other parameter like source release height, receptor height and terrain height were also considered to calculate the concentrations of pollutants at different levels by using SCREEN3 module. The results obtained from the SCREEN3 module reveals that both the RSPM & TSPM Concentrations decreases with increase in the receptor location height upto71%.
REFERENCES
[1] Weaver D and Villard R, Hubble News Center, 2007.
[2] Seinfeld John and Spyros Pandis, Atmospheric Chemistry and Physics: From Air Pollution to Climate Change, John Wiley &
Sons, 1997.
[3] A report on the environmental effects of dust from surface mineral working, by Department of the Environment Minerals
Division, London.
[4] Seinfeld John and Spyros Pandis, Atmospheric Chemistry and Physics: From Air Pollution to Climate Change, John Wiley &
Sons, 1998.
[5] Mary Hardin and Ralph Kahn, A report on Aerosols and climate change.
[6] Akbar Ziauddin, A report on mapping of particulate and gaseous pollutants trends in rapidly growing urban environment of
Visakhapatnam city using a GIS-Based methodology.
[7] Jineshvora, Dust dispersion modeling for opencast mines.
[8] Trivedi R, Chakraborty M K and Tewary B K, Dust dispersion modeling using fugitive dust model at an opencast coal project of
Western coalfields limited, India. Journal of Scientific & Industrial Research, Vol. 68, pp.71 – 78, 2009.
[9] Trivedi R and Chakraborty M K, Dust generation and its dispersion due to mining activities in Durgapur open cast coal project of
Westren coal field limited – A Case Study, The Indian Mining & Engineering Journal, pp.24 – 31, 2008.
[10] Reed W R, A report on Performance evaluation of a dust dispersion model for haul trucks, 2004.