Simulation Analysis of Shaking Table Test for RC Seismic Shear Wall in
Multi-Axis Loading Tests
Kazuhiro Kusama1), Atsushi Suzuki2), Ryusuke Fukuda2), Tsutomu Hirotani3), Katsuki Takiguchi4)
1)
Nuclear Power Engineering Corporation, Tokyo, Japan 2)
Kajima Corporation, Tokyo, Japan 3)
Shimizu Corporation, Tokyo, Japan 4)
Tokyo Institute of Technology, Tokyo, Japan
ABSTRACT
Nuclear Power Engineering Corporation (NUPEC) has been conducting a shaking table test for reinforced concrete seismic shear wall using the shaking table of Public Works Research Institute of Japan as for a part of the project of ‘Model Tests of Multi-Axis Loading on RC Shear Walls’. The specimen is a box type shear wall whose dimension is a 1.5m by 1.5m in plan and 1.0m in height. The test was performed by applying simultaneous two directional horizontal motions (X, Y) and vertical motion (Z). The test consists of eight step testing. In each step, the applied motions are increased in acceleration step by step. All the shear walls of the specimen reached failure simultaneously in the final excitation step.
Both diagonal shear cracks and horizontal bending cracks are observed in the initial excitation phases. In this paper, results of three-dimensional FEM analyses, which simulate the crack patterns of those, are discussed. A shear wall consists of four-node layered shell elements considering out-of-plane shear deformation. The upper slab, base slab and added mass consist of solid elements. Four-direction crack model is used with two orthogonal coordinates corresponding to non-orthogonal cracks.
NUPEC model developed by Element Test in ‘Model Tests of Multi-Axis Loading Test on RC Shear Walls’ was used for shear transfer mechanism along shear crack surface. Material property of concrete was evaluated according to material test results conducted at the shaking table test. Damping factor was estimated from the test results.
KEY WORDS: RC seismic shear wall, multi-axes loading, shaking table test, nonlinear FEM analysis, four-direction crack model
1. INTRODUCTION
Nuclear Power Engineering Corporation (NUPEC) is carrying out a test project focused on multi-axes loading of RC shear walls, which is named 'Model Tests of Multi-Axes Loading on RC Shear Walls' and is sponsored by Ministry of Economy, Trade and Industry of Japan (METI). Dynamic tests using a shaking table of Public Works Research Institute in Japan were conducted, as a part of the test project. Specimen, test condition and test results are described in another paper1). In this paper, three dimensional nonlinear finite element analysis (3D-FEM) is applied to simulation analysis of the test results with simultaneous 3-direction input motion. This analysis method uses detailed analysis model with large degree of freedom, therefore, in the case of dynamic response analysis with much analysis steps compared to static loading, computing time for calculation tends to be enormous. However, the shape and the structural conditions of the specimen can be modeled with relative ease and it greases the way to study failure process and to evaluate cracks distribution in detail. With such reasons, this analysis method is thought to be effective for the simulation of this test results. Simulation analysis modelling is outlined in section 2. Analysis results are discussed in section 3.
2. ANALYSIS CONDITION
2.1 Analysis program for simulation
As shown in the test results1), both diagonal shear cracks and horizontal flexural cracks are observed in a face of the box wall according to simultaneous horizontal two directional input. In order to simulate such failure mode, FEM analysis program should have function to consider at least three directional cracks in an element. Moreover, box type wall is needed to be evaluated 3 dimensional coordinates using not plane elements but such laminated shell elements to consider out-of-plane component. In this study, analysis program considering laminated shell elements to evaluate orthogonal 4 directional cracks and out-of-plane components, as shown in Table 1. Condition to generate of the non-orthogonal cracks is that intersection angle between the cracks is more than 15 degree. In the case that the angle is less than 15 degree, the cracks are regarded as a single crack.
Transactions of the 17th International Conference on
Structural Mechanics in Reactor Technology (SMiRT 17)
Prague, Czech Republic, August 17 –22, 2003
2.2 Analysis condition (a) Material properties
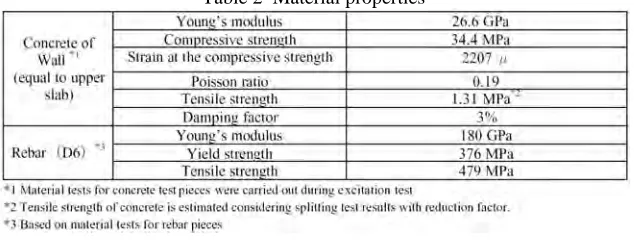
Material properties of concrete and rebar to be used are determined according to material strength test results. As for the tensile strength of concrete, splitting tensile strength with reduction factor2) is used. As for damping factor, inertial viscous damping proportional to initial stiffness is used as 3% at 1st natural frequency. Table 2 shows the material properties used for the analysis.
Table 2 Material properties
(b) Analysis model
Analysis model used for the simulation analysis is three dimensional finite element model as shown in Figure 1. The model consists of box type wall, upper slab and attached mass. Laminated shell element (five layered) is applied for all the elements. The boundary of the bottom of the wall is fixed.
Since rotational response motion is observed at the upper slab in the test results, the upper slab of the analysis model has the geometry of the actual upper slab with attached mass. The mass of the slab and attached mass is distributed at all the contact points so that rotational inertia is same as the specimen.
Reinforcement ratio of the specimen is 1.2% at each side in each direction. In the analysis model, a steel layer corresponding to rebar ratio is considered among the shell elements so as to be integrated with concrete portion.
Fig.1 Analysis model
(c) Input motion
Input motion used for the analysis is response acceleration time history observed at the top of the base mat slab. Two horizontal directions and vertical direction components are input simultaneously at the bottom of the box wall of the analysis model. Low pass filter is used to cut high frequency components more than 60Hz.
(d) Analysis case
Analysis cases are shown in Table 3.
In case1, simulation analysis of RUN-1 is performed. The excitation control relatively works well during RUN-1 excitation, the achieved motion at the base mat slab is similar to target motion. Natural frequency of the specimen is hardly changed. Neither failure nor cracks at the box wall are observed. In this excitation, the response of the specimen still remains in elastic state. Main purpose of the analysis case is to verify the analysis model for the wall and upper slab.
In case2, simulation analysis of RUN-2 is performed. During the excitation RUN-2, the natural frequency of the specimen shifts from 22Hz to 15Hz. Thin shear cracks and flexural cracks are observed at the wall surface. Main purpose of the analysis case is to perform evaluation of nonlinear behaviour, such as acceleration and deformation response, also failure mode like crack pattern.
In the continuous analysis, it is ideal method to input continuous motion of all the excitation before the target excitation. However to perform these kind of analysis takes enormous computing time. Therefore, continuous motion which consists of target motions and one motion of just before target motions is used for convenience, and it makes the wall elements of the model fail to some extent before target motions start.
In case4, simulation analysis with continuous input motion of RUN-5, RUN-6 and RUN-7 is performed. The target excitations in this case are RUN-6 and RUN-7, which make the specimen failed at the bottom of the wall. Main purpose of the analysis case is to perform evaluation of structural failure.
Table 3 Analysis case
Fig 2 Input motion of continuous analysis
3. THE ANALYSIS RESULT
3.1 Case 1 (RUN-1, elastic response)
Horizontal and Vertical natural frequency of the analysis model is 22.8Hz and 44.9Hz, respectively. These values are almost same values as test results obtained in small input level shaking, which is conducted to confirm the initial condition of the specimen before excitation RUN-1.
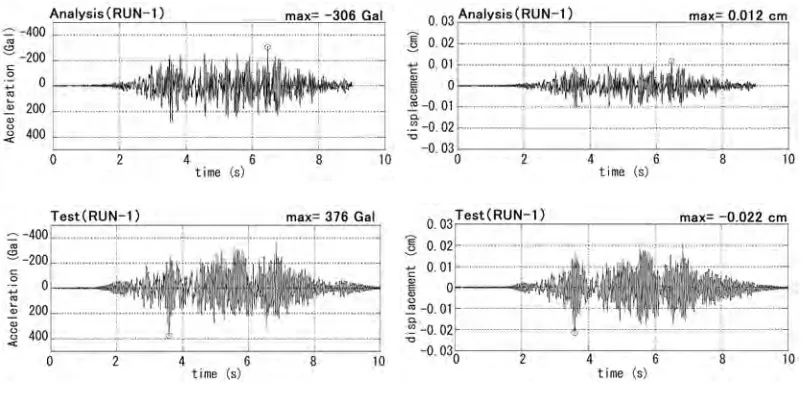
In RUN-1 excitation analysis, all elements keep elastic state. Response acceleration time history of the upper slab and time history of relative displacement between upper slab and base mat slab (displacement, hereafter), both analysis and test results are shown in Figure 3 and 4, respectively.
Fig.3 Acceleration time history(Y-direction) Fig.4 Displacement time history(Y-direction)
Response acceleration and response displacement of analysis results are smaller than those of the test results, however, in relatively small amplitude, test result and analysis result are corresponding each other. Figure 5 shows the comparison of hysteresis loop between analysis and test results. According to those comparisons, stiffness of analysis model is thought to be larger than that of the test specimen. Figure 6 shows comparison of acceleration response spectra at the upper slab. Dominant period of the test result is around 0.05s, otherwise that of analysis result is around 0.05s to 0.04s. Two peaks are shown in the analysis results. That is because input motion which is observed during excitation includes dynamic characteristics of the actual specimen. In order to simulate test results accurately, dynamic characteristics of analysis model needs to be corresponding to that of actual specimen. In this analysis case, because natural period of analysis model is smaller than that of specimen, it is thought that analysis result does not show a good agreement with test results.
3.2 Case 2(RUN-2, nonlinear response)
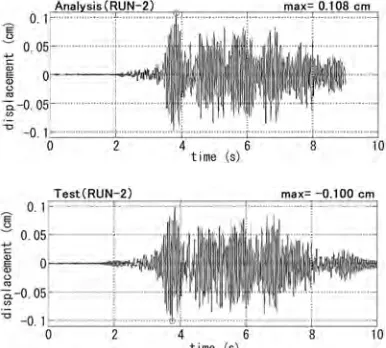
Initial condition of the specimen before excitation RUN-2 is elastic state, therefore, initial condition of analysis model is also elastic. Figure 7 and Figure 8 show comparisons of horizontal and vertical acceleration time history of RUN-2, both analysis and test results, respectively. In the initiation of excitation (up to 3s), acceleration of analysis shows a good agreement with test results in horizontal and vertical direction. After 3s when the horizontal dynamic characteristics is remarkably changed, acceleration amplitude of analysis results in horizontal direction are larger than that of test results. Vertical acceleration of analysis is well simulated. In compared to horizontal response, change of vertical dynamic characteristics is relatively small during the excitation.
Figure 9 shows horizontal displacement time history. Displacement of analysis results are relatively good agreement with that of test results.
Figure 10 shows comparison of hysteresis loop up to 3s. Initial stiffness and acceleration amplitude of analysis model show good agreement with those of test results. Figure 11 shows comparison of hysteresis loop post 3s. During major excitation period, analysis results show larger acceleration amplitude compared to test result.
Fig.7 Acceleration time history(Y-direction) Fig.8 Acceleration time history(Vertical-direction)
Fig.9 Displacement time history(Y-direction)
Figure 10 Hysteresis loop(Case2, 0s-3s, Y-direction)
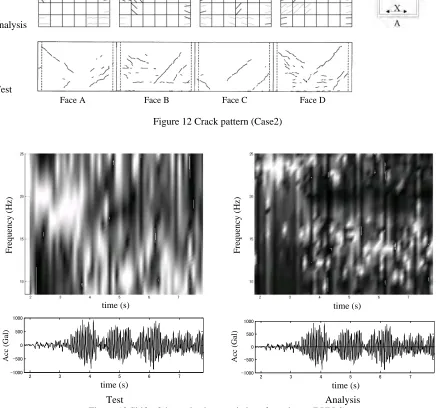
Figure 12 shows comparison of crack pattern between test results and analysis results. Active and dormant cracks beyond 1000µ are shown in analysis result. Black line and grey line show the active crack and the dormant crack, respectively. Analysis results give good agreement in the crack patterns with those of test results. Difference of damages in wall faces and orientations of cracks are relatively well simulated by the analysis.
Figure 13 shows shift of dynamic characteristics of specimen in RUN-2. Upper part of the figures show running Fourier spectra ratio of acceleration response of upper slab by that of base mat slab. Lower part of the figures show acceleration time history of base mat slab. This figure shows that dynamic characteristics of the specimen shifts during the RUN-2 excitation. It is important to simulate the shift as the change of nominal frequency of the specimen in this analysis case. In the analysis results, the tendency of reduction of nominal frequency during the excitation is shown.
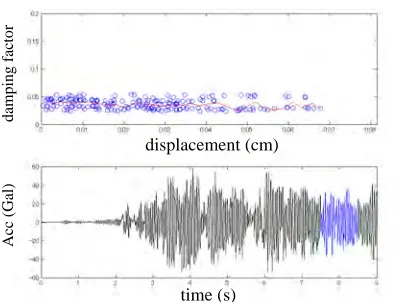
Equivalent viscous damping factor of the specimen is estimated as 4% to 5% during RUN-2 excitation from hysteresis loop (load-deflection relationship) of the test results. According to this results, inertial viscous damping factor of the analysis model is determined as 3% at initial condition. In order to validate this analysis condition, equivalent viscous damping factor is evaluated from hysteresis loop of analysis results in same manner as the evaluation of test results. Figure 14 shows evaluated damping factor from analysis results of 1 second excitation period of 7.5s to 8.5s of analysis results which is supposed to include less plastic damping. Upper figure shows the evaluated damping factor. Horizontal axis shows maximum deformation of the hysteresis loop for calculation, vertical axis shows the damping factor. Blue mark shows calculated value, Red line shows averaged value. It seems that the equivalent damping factors in the analysis case are about 3 to 5%, which is corresponding to those from test results.
analysis
Test
Face A Face B Face C Face D
Figure 12 Crack pattern (Case2)
-1000 2 3 4 5 6 7
-500 0 500 1000
2 3 4 5 6 7
-1000 -500 0 500 1000
Test Analysis
Figure 13 Shift of dynamic characteristics of specimen (RUN-2)
Frequency (H
z)
Frequency (H
z)
time (s) time (s)
time (s) time (s)
Acc (
Gal)
Acc (
Figure 14 Equivalent viscous damping (RUN-2)
3.3 Case 3,Case 4(large amplitude excitation)
Figure 15 and 16 show comparison of hysteresis loops in Case3 (RUN-3’ and RUN-4).
On the RUN-3’ excitation, maximum acceleration and horizontal (X-direction) deflection reach 1200 Gal and 0.17cm(1.7/1000 rad), respectively. Hysteresis loop shows S-shape which is typical feature in case of strong nonlinearity of RC wall. Acceleration and deflection of analysis results show a little larger than those of test results. It seems that hysteresis loop of analysis results is S-shape as observed in test results, smaller stiffness in smaller deformation range, larger stiffness in larger deformation range.
Figure 17 and 18 shows crack patterns in Case3 (RUN-3’ and RUN-4). Active and dormant cracks beyond 1500µ are shown in analysis result. Crack pattern on the wall in the analysis shows a good agreement with test results in its generating feature; shear cracks in Face A and Face C corresponding web wall in X direction are generated remarkably, flexural cracks in Face B and Face D corresponding flange wall in X direction appear.
As for the RUN-4 excitation, maximum horizontal deflection angle in Y-direction reach 0.21cm(2.1/1000 rad), exceeding that in X-direction. This causes shear cracks are spread on all faces of walls. In the analysis Case 4, maximum horizontal deflection in Y-direction reach 0.25cm(2.5/1000 rad), exceeding that in X-direction. Shear cracks in Face B and Face D corresponding web wall in Y direction are generated and cracks are spread on all faces of walls.
(X-direction) (X-direction)
(Y-direction) (Y-direction)
Figure 15 Hysteresis loop(Case3, RUN-3’) Figure 16 Hysteresis loop(Case3, RUN-4)
(Analysis) (Analysis)
(Test) (Test)
Figure 17 Crack pattern(Case3, RUN-3’) Figure 18 Crack pattern (Case3, RUN-4) Face A Face B Face C Face D Face A Face B Face C Face D
time (s) displacement (cm)
Acc (
G
al)
damping facto
Figure 19 shows comparison of hysteresis loops in Case4 (RUN-7).
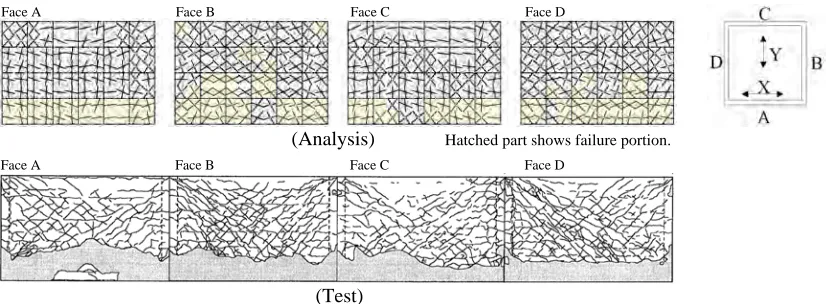
Figure 20 shows crack patterns in Case4 (RUN-7). Active and dormant cracks beyond 1500µ are shown in analysis result. Yellow hatching portion shows failure.
On the RUN-7 excitation, the specimen reaches failure. Judging from hysteresis loops, deformation in Y-direction are saturated first and it is thought that failure of web wall in Y-Y-direction is preceding to that in X-direction. In the analysis, elements of bottom of face B and face D reach failure first, also more elements failed in faces B and D than the other faces A and C.
(X-direction) (Y-direction)
Figure 19 Hysteresis loop(Case4, RUN-7)
(Analysis) Hatched part shows failure portion.
(Test)
Figure 20 Crack pattern(Case4, RUN-7)
4. CONCLUDING REMARKS
Box type RC shear wall specimen subjected to multi-directional dynamic input motions were tested and simulation analyses were conducted to study and improve nonlinear FEM analysis method to evaluate seismic response from elastic range up to failure of RC structure with multi-directional input motion.
The results will be used to improve seismic safety analysis codes relevant to multi directional inputs and will contribute to improve the method of evaluating safety of NPP buildings.
ACKNOWLEDGEMENTS
This work was performed by NUPEC as a part of the "Model Test of Multi-axis Loading on RC Shear Walls" project commissioned by the Ministry of Economy, Trade and Industry (METI) of Japan. Technical issues have been discussed in the advisory committee on the project established by NUPEC (Chairperson: Professor Dr. T.Nishikawa). The authors wish to express their thanks to all the members of the committee for their valuable suggestions and co-operation.
REFERENCES
1. Kitada,Y., Torita,H., Matsumoto,R., Mihara,Y. and Nishikawa,T., “Shaking Table Test of RC Box-type Shear Wall in Multi-Axes Loading”, Transactions of the 17th SMiRT, 2003.
2. Nuclear Power Engineering Corporation., "Report on Model Test of Multi-axis Loading on RC Shear Walls (In Japanese) ",.March 2000.
Face A Face B Face C Face D