Report No. 370
SURFACE WATER/GROUND WATER INTERACTIONS ALONG THE TAR RIVER, NC
By
Michael A. O’Driscoll David J. Mallinson Patrick K. Johnson
Department of Geology East Carolina University Greenville, North Carolina
UNC-WRRI-370
SURFACE WATER/GROUND WATER INTERACTIONS ALONG THE TAR RIVER, NC
Michael A. O’Driscoll, David J. Mallinson, and Patrick K. Johnson
Department of Geology East Carolina University Greenville, NC 27858-4353
The research on which this report is based was supported by funds from the U.S. Department of the Interior, U.S. Geological Survey, Grant Number 01HQGR0096 and the Water Resources Research Institute of The University of North Carolina.
The views and conclusions contained in this document are those of the authors and should not be interpreted as necessarily representing the official policies, either expressed or implied, of the U.S. Government, the Water Resources Research Institute of The University of North Carolina, or the State of North Carolina.
This report fulfills the requirements for a project completion report of the Water Resources Research Institute of The University of North Carolina. The authors are solely responsible for the content and completeness of the report.
WRRI Project No. 70215
ACKNOWLEDGMENTS
We would like to thank the North Carolina Department of Transportation, North Carolina Wildlife Resources Commission, the City of Greenville, and Dr. Stan Riggs, East Carolina University for allowing us permission to instrument and access study sites. Jeff Lautier at the Division of Water Resources-North Carolina Department of Environment and Natural Resources provided us with stratigraphic logs obtained near the Tar River at Falkland, NC. We are thankful to Ashley Frazier, Staff Meteorologist at the State Climate Office of North Carolina, who
provided us with a long-term precipitation record for Greenville, NC. In addition, we thank the U.S. Geological Survey for providing long-term streamflow data from the Tarboro and
Greenville stream gages. The ECU Geology Department provided us with water level
measurement meters and laptop computers for downloading data. Jim Watson provided a wide variety of support with field monitoring, equipment maintenance and repair. Emma Hardison, East Carolina University Department of Biology helped with the installation of piezometers. Jason Blackburn, East Carolina University Department of Political Science helped with data acquisition and literature review. We also appreciate the assistance provided by Dr. Dave Lawrence with the GPR surveys at Falkland, NC.
Finally, we thank the staff at the North Carolina Water Resources Research Institute for funding the project, and for their cooperation over the course of this project.
Abstract
The nature of river-groundwater interactions along coastal plain streams is not well-known. We used a two-fold approach to study groundwater inputs to the Tar River (Edgecombe and Pitt Counties, NC): using physical hydrograph separations and statistical analysis of long-term discharge (1931-2002) to look at the long-long-term and seasonal variability of groundwater inputs and a hydrogeophysical field study approach to evaluate geological controls on groundwater inputs to the Tar River.
The hydrograph separation analysis indicated that baseflow (groundwater) comprises 60% of the Tar River streamflow over time. Hydrograph separations and discharge analysis revealed that baseflow contributions to the Tar River have changed since the 1930s. The magnitude and variability of baseflow feeding the Tar River have changed slightly, daily mean baseflow has decreased by 49 cubic feet per second (cfs) (1.34 m3/s) and daily minimum baseflows have dropped 33 cfs (0.93 m3/s). The variability of baseflow within a given year as measured by the coefficient of variation has increased by 8% when comparing data before 1971 and after 1971.
The distribution of floodplain and river channel sediments adjacent to coastal plain rivers is complex and requires numerous sediment cores to characterize, yet is very important to
understanding river-ground water interactions and contaminant transport. Eighteen piezometers and 39 meters of split spoon cores and hand auger samples were used to characterize the
subsurface and groundwater inputs along a 22 kilometer stretch of the Tar River, eastern North Carolina, USA. Additionally, 2-D and 3-D GPR data were collected using a GSSI SIR-2000 system with a 200 MHz antenna, to define the shallow stratigraphic framework. The ultimate goal was to use GPR to assess the hydraulic characteristics of floodplain and channel deposits.
Ground water head data indicated that the shallow water table aquifer had a high degree of complexity on a local scale. Sediment samples and slug tests conducted in stream-channel piezometers indicated that the geology between the north and south sides of the river varied significantly, with a direct effect on the movement of ground water through the river channel. Ground water flux into and out of the channel varied between the north and south sides of the river by as much as four orders of magnitude. The differences appear to be related to
LIST OF FIGURES
Figure 1. Generalized east-west cross-section through Pitt County study area illustrating the projected subsurface
geology along the Tar River (modified from Maddry 1979)..………..Page 4.
Figure 2. Long-term Tar River discharge measured at the U.S. Geological Survey gage at Tarboro, NC (source: U.S.
Geological Survey)...………..Page 5.
Figure 3. Long-term average monthly Tar River discharge (1931-2004) measured at Tarboro, NC (source: U.S.
Geological Survey)...………..Page 6.
Figure 4. Long-term annual rainfall amounts measured at Greenville, NC (1931-2006) (Source: North Carolina
State Climate Office). The black line is the 10-year moving average………..Page 7.
Figure 5. Long-term average air temperature measured at Greenville, NC (1931-2006) (Source: North Carolina
State Climate Office). The black line is the 10-year moving average. ..………..Page 7.
Figure 6. Study reach of the Tar River from Falkland to Greenville, NC. (F) Falkland, (2) 264, (E) Elm Street, (P)
Port Terminal Rd, (R) Rainbow Banks. ……….………..Page 8.
Figure 7. Site map and location of the Falkland (F) monitoring station. ..………..Page 9.
Figure 8. Site map and location of the 264 monitoring station. ………..………..Page 10.
Figure 9. Site map and location of the Elm Street (E) monitoring station. ……...………..…..Page 11.
Figure 10. Site map and location of the Port Terminal Road (P) monitoring station.………...Page 12.
Figure 11. Site map and location of the Rainbow Banks (R) monitoring station. ………..………..Page 13.
Figure 12. Ground penetrating radar was floated in a raft to image the underlying river channel sediments at the
Falkland site along the Tar River. ………..Page 15.
Figure 13. a. Typical stream-ground water level monitoring station………...………..Page 17.
Figure 13.b. Water level recorders along the Tar River at Falkland, NC. ………..………..Page 17.
Figure 14. Long-term total hydrograph separation (1931-2003) for total discharge at Tarboro, NC USGS gage. Total
discharge is in blue and the baseflow component is in red. …...………..……..Page 18.
Figure 15. Long-term variations in monthly total discharge and baseflow, at Tarboro, NC USGS gage (1931-2003).
………..………..Page 19.
Figure 16. Long-term variations in monthly baseflow percentage of total discharge, at Tarboro, NC USGS gage
(1931-2003)...………...………...Page 19.
Figure 17. Long-term comparison of mean annual baseflow versus total annual rainfall and a comparison of mean annual baseflow versus total annual dormant season rainfall (1931-2003)..……….…………..………..Page 20.
Figure 19. Long-term variations in total discharge, baseflow, and runoff, at Tarboro, NC USGS gage (10-year
moving average).……….………..……….……Page 21.
Figure 20. Total discharge-frequency distribution curves at Tarboro, NC USGS gage (split into two groups:
1931-1971 and 1972-2003)……..………..………..Page 22.
Figure 21. Baseflow-frequency distribution curves at Tarboro, NC USGS gage (split into two groups: 1931-1971
and 1972-2003)...………...…….Page 23.
Figure 22. Annual minimum daily baseflow at Tarboro, NC USGS gage (1931-2003). Black line is 10-year moving
average. ...………..….…..Page 24.
Figure 23. Comparison of 10-year moving average annual minimum daily baseflow at Tarboro, NC USGS gage for
the period of 1941-1971 versus the period of 1972-2002. )....……….………..Page 24.
Figure 24. Annual coefficient of variation (standard deviation/mean*100%) of baseflow at Tarboro, NC USGS gage
(1931-2003). Black line is 10-year moving average………..Page 25.
Figure 25. Comparison of 10-year moving average annual coefficient of variation of baseflow (standard deviation/mean*100%) at Tarboro, NC USGS gage for the period of 1941-1971 versus the period of
1972-2002………....Page 25.
Figure 26. The percent change in baseflow between Tarboro and Greenville, NC USGS gages for the period of
1997-2006...……….……..Page 26.
Figure 27. The monthly average change in baseflow between Tarboro and Greenville, NC USGS gages for the
period of 1997-2006....………....Page 27.
Figure 28. Hydraulic conductivity values measured in stream channel and bank piezometers along the study reach
of the Tar River…...………..Page 28.
Figure 29. A comparison of hydraulic conductivity values measured in stream channel and piezometers along the
North vs. South sides of the Tar River………..………..Page 29.
Figure 30. A comparison of average vertical groundwater fluxes at five study sites along the Tar River (September
2005-March 2006) ..……….………..Page 30.
Figure 31. A comparison of vertical groundwater fluxes at the north versus the south side of the river, along the Tar
River over the study period .………...Page 31.
Figure 32. A comparison of groundwater temperatures measured in deep piezometers at four sites along the Tar
River over the study period ..………..Page 32.
Figure 33. A comparison of groundwater temperatures measured in stream channel piezometers and surface water
temperatures measured in the Tar River over the study period ...………..Page 32.
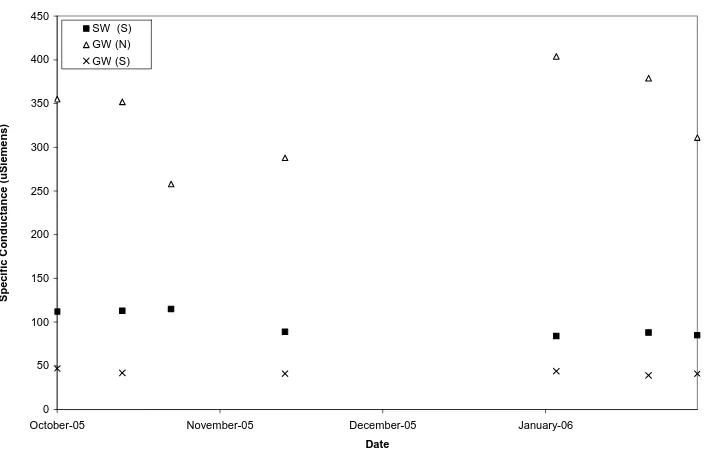
Figure 34. Specific conductance data measured in channel piezometers on the north (GW(N)) and south side
(GW(S)) of the river and of surface water at Route 264 site. …………..………..Page 33.
Figure 35. Specific conductance data measured in channel piezometers on the north (GW(N)) and south side
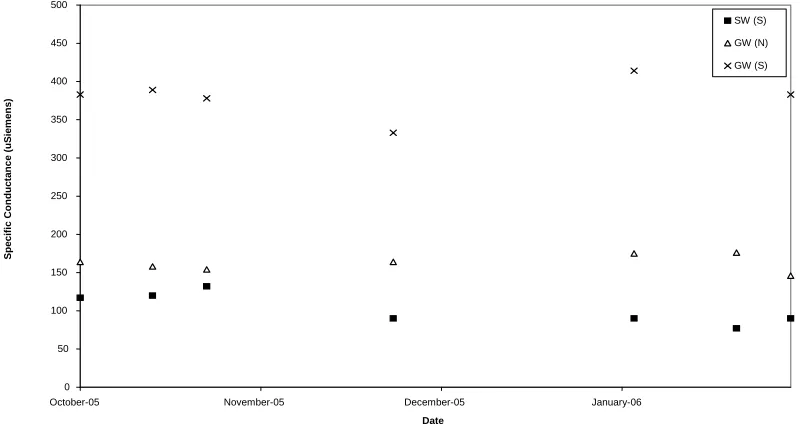
(GW(S)) of the river and of surface water at Rainbow Banks site. ……….…..Page 34.
Figure 36. Specific conductance data measured in channel piezometers on the north (GW(N)) and south side
Figure 37. Specific conductance data measured in channel piezometers on the north (GW(N)) and south side
(GW(S)) of the river and of surface water at Elm Street site. ..………..Page 35.
Figure 38. Specific conductance data measured in channel piezometers on the north (GW(N)) and south side
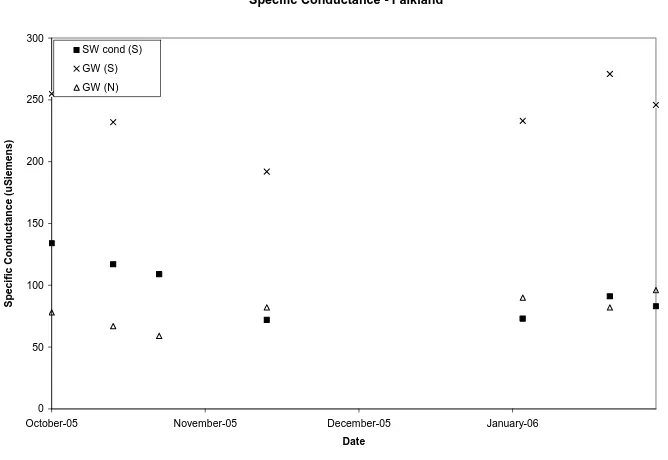
(GW(S)) of the river and of surface water at Falkland site. ………...Page 35.
Figure 39. Average groundwater specific conductance data measured in channel piezometers along the Tar River compared to hydraulic conductivity values measured in the same piezometers. ………..Page 36.
Figure 40. Split spoon core at Falkland south – 0-1.15 m………...…………..Page 37.
Figure 41. Split spoon core at Falkland south –1.15 -2.30 m. ………..Page 38.
Figure 42. Split spoon core at Falkland south –2.30-3.45 m. ……….……..Page 39.
Figure 43. Hand auger core at 264 south –0-3.05 m. ………..…………..Page 40.
Figure 44. Split spoon core at Elm St. south –0.00-1.15 m……….………..Page 41.
Figure 45. Split spoon core at Elm St. south –1.15-2.30 m. ………...………..Page 42.
Figure 46. Split spoon core at Elm St. south –2.30-3.45 m.………..Page 43.
Figure 47. Split spoon core at Elm St. south –3.45-4.60 m....………..……….Page 44.
Figure 48. Split spoon core at Elm St. south –4.60-5.75 m. ………...………..Page 45.
Figure 49. Split spoon core at Port Terminal south –0-1.15 m. ……..………..Page 47.
Figure 50. Split spoon core at Port Terminal south –1.15-2.30 ………..………..Page 48.
Figure 51. Split spoon core at Port Terminal south –2.30-3.45 m...………..Page 49.
Figure 52. Split spoon core at Port Terminal south –3.45-4.60 m.………..…………..Page 50.
Figure 53. Split spoon core at Rainbow Banks south –0.00-1.15 m..………..………..Page 53.
Figure 54. Split spoon core at Rainbow Banks south –1.15-2.30 m……...………..Page 54.
Figure 55. Split spoon core at Rainbow Banks south –2.30-3.45 m. ………..………..Page 55.
Figure 56. Split spoon core at Rainbow Banks south –3.45-4.60 m………..Page 56.
Figure 57. Split spoon core at Rainbow Banks south –4.60-5.75 m. ………..………..Page 57.
Figure 58. Split spoon core at Rainbow Banks south –5.75-6.90 m.………...…..Page 58.
Figure 59. Map showing the location of transects and the 3-d survey grid in the Falkland area.…………....Page 59.
Figure 60. Processed data from N-S transects 882 and 883, potentially showing the top of the Black Creek or
Yorktown Formation deepening toward the south...………..Page 61.
Figure 61. Processed data with interpretations showing the top of the Black Creek or Yorktown Formation
Figure 62. 3-d survey box looking NW, and illustrating a slice at 3.13 m subsurface. The red surface seen is the erosional base of the channel which corresponds to the top of the Black Creek or Yorktown Formation. The surface
dips toward the west...………...………...…..Page 63.
Figure 63. Map showing the locations of cross-channel gpr transects in the Elm Street area.…………...…..Page 65.
Figure 64. Transect line 928 across the Tar River in the Elm Street area.………...Page 66.
Figure 65. Transect line 928 across the Tar River in the Elm Street area.……….……..Page 67.
Figure 66. Transect line 930 across the Tar River in the Elm Street area.……….…..Page 68.
Figure 67. Transect line 931 across the Tar River in the Elm Street area………..…..Page 69.
Figure 68. Transect lines 928-931 across the Tar River in the Elm Street area.……….……..Page 70.
Figure 69. 3-d perspectives of the grid data from the floodplain terrace adjacent to the Tar River in the Elm Street study area. Top image is looking southeast. Bottom image is looking northeast. Note the horizontal bedding characteristic of overbank deposits. Data become attenuated at approximately 3 to 3.5 m subsurface due to the
presence of clays...………....Page 71.
Figure 70. Map showing the locations of cross-channel gpr transects in the Port Terminal area..…………..Page 73.
Figure 71. Transect lines 932 and 933 across the Tar River in the Port Terminal area………..……..Page 74.
Figure 72. Transect line 934 across the Tar River in the Port Terminal area ………..……..…..Page 75.
Figure 73. Transect line 935 across the Tar River in the Port Terminal area……….……..Page 76.
Figure 74. Transect line 936 across the Tar River in the Port Terminal area ………..…..………..Page 77.
Figure 75. Transect line 937 across the Tar River in the Port Terminal area ………..…..……..Page 78.
Figure 76. Transect line 938 across the Tar River in the Port Terminal area.………...…….…..Page 79.
Figure 77. Map showing the locations of cross-channel gpr transects in the Rainbow Banks area. ………...Page 80.
Figure 78. Transect line 965 across the Tar River in the Rainbow Banks area……… ………...Page 81.
Figure 79. Transect line 967 across the Tar River in the Port Terminal area………...…Page 82.
TABLE OF CONTENTS
ACKNOWLEDGMENTS ... ii
ABSTRACT ... iii
LIST OF FIGURES ... iv
SUMMARY AND CONCLUSIONS ... ix
RECOMMENDATIONS ... xii
INTRODUCTION ... 1
METHODS ... 2
Study Area ... 2
Geological Setting……….. 2
Hydrology and Meteorology……….. 4
Study Sites ... 8
Falkland ... 9
264 ... 10
Elm Street... 11
Port Terminal Road... 12
Rainbow Banks... 13
Hydrograph Separations and Discharge Analysis... 14
Subsurface Investigation ... 14
Geophysical Surveys ... 14
Sediment Sampling and Ground Water /Surface Water Monitoring ... 15
RESULTS ... 18
Hydrograph Separations and Discharge Analysis... 18
Hydraulic Conductivity... 28
Groundwater Flux ... 29
Water Temperature………... 31
Specific Conductance………... 33
Sediment Distribution... 36
Ground Penetrating Radar Surveys... 58
DISCUSSION ... 84
Summary and Conclusions
Long-term (1931-2003) baseflow analysis for the Tar River at Tarboro indicated that baseflow is the major component of river discharge along the Tar (60% on average). There have been slight changes in baseflow discharge along the Tar over this time period. In general, baseflow has become more variable over time, with an increase in the occurrence of high and low flow events. These changes may be due to changes in climate and/or land-use over time. Urbanization, stormwater runoff, wastewater discharge, water supply withdrawals, and interbasin transfers may all affect the frequency, timing, and magnitude of baseflow discharge over time in the Tar River basin. In addition, subtle changes in climate that have occurred over the last 50 years may also influence baseflow discharge. Work done by Boyles (2000) indicates that the climate in North Carolina has been slowly changing since the 1950s with a common pattern of increased rainfall during fall and winter and decreased rainfall in summer months. This change in rainfall patterns may explain trends in Tar River baseflow since increased precipitation during high baseflow periods in the winter could cause the occurrence of high baseflows to increase, whereas lesser rainfall in summer months could result in a decrease in occurrence of low baseflows. If this rainfall trend continues the summer low baseflows along the Tar may be susceptible to further decreases in the future.
Seasonal variations in baseflow are common along the Tar and the extreme low
baseflows are typical occurrences in the summer months due to increased solar radiation, warmer temperatures, increased evaporation, and plant uptake of surface water and ground water. During summer months the Tar River is vulnerable to low baseflows that are related to recent weather patterns and this time period is likely to be the most sensitive to future climate change in the region. A comparison of annual baseflow and rainfall grouped by season (dormant vs. growing) showed dormant season rainfall to be most important to annual groundwater recharge and baseflow generation within the Tar Basin. The amount of dormant season rainfall that occurs annually has a greater influence on the baseflow discharge to the Tar than rainfall during the growing season. If rainfall amounts change in the region as a result of climate change, the modifications of rainfall distribution throughout the year will be important to determining the effects on baseflow to this and other coastal plain rivers. Typically, the greatest variability in baseflow occurred during the months of September and October, due to hurricane effects on baseflow. Baseflow magnitudes can be extremely low or high during these months depending on recent storm activity. If the frequency and magnitude of hurricane and tropical storm landfalls change in the future this will have an effect on baseflow discharge to the Tar, particularly during the fall.
Baseflow inputs along the Tar typically increase downstream from Tarboro to Greenville. However, there are several time periods where baseflow decreases downstream, indicating
Variations in river-groundwater interactions were noticeable with time and distance along the Tar and were observed in channel and nested peiezometers. The river was typically gaining groundwater, however several instances of losing segments were observed. Hydraulic
conductivity variations were large between sites, with the range of hydraulic conductivity measured in piezometers of 10-2.03-10-7.03 cm/s, with a median value of 10-3.38 cm/s, representative of sandy channel sediments.
A pattern was evident in the hydraulic conductivity data, the channel sediments on the north side of the river typically had greater hydraulic conductivity values when compared to those on the south side of the river. Sediment cores and GPR data indicate that there are
differences in sediment type that are related to the channel asymmetry commonly observed along the Tar. Generally the south side of the river has steep banks, and is underlain by Pliocene to Cretaceous sediments that often contain marine or estuarine clays that tend to have low hydraulic conductivities. On the north side of the river the floodplain is extensive, the topography is gentle, and the underlying sediments tend to be sandy deposits that are likely reworked alluvial
sediments. These sediments tend to be more permeable, hence groundwater inputs on the north side of the river tend to be greater than those on the south side of the river. Clay sediments on the south side of the river may also cause groundwater inputs to occur as springs or seeps which were not inventoried in this study. The general presence of sandy sediments along the north side of the river is one reason for the high concentration of sand and gravel pits on the north side of the river when compared to the south side.
Cross-sections of the river channel were typically asymmetrical, with the steeper banks almost always located on the southern side of the river. The channel asymmetry that occurs along the Tar is noticeable for the entire study reach and this pattern is also common along other
Coastal Plain Rivers in Virginia, North Carolina, and South Carolina, indicating that these differences in hydraulic conductivity and the groundwater fluxes may also occur at a regional scale. Several studies have indicated that this floodplain asymmetry may be related to uplift in the region, causing rivers to incise to the south and preserving reworked fluvial deposits to the north (Sexton 1999 and Soller 1988).
Another pattern related to channel asymmetry was observed in the groundwater specific conductance data. Typically the specific conductance of groundwater underlying the Tar varied depending on what side of the river it was sampled along. This is likely related to differences in residence time and groundwater flowpaths adjacent to and underlying the river. Greater
hydraulic conductivity sediments were found to typically have lower groundwater specific conductance values. This relationship between hydraulic conductivity and specific conductance in channel groundwaters may be useful in future studies to quantify river groundwater
interactions and channel hydraulics of this and other coastal plain rivers.
properties along and perpendicular to the river channel at depths of several meters below the channel.
Two notable limitations to the use of GPR in these coastal plain systems exist, first the signal is attenuated in clay sediments so the GPR data may only indicate the depth to the first clay layer. Second, as salinity increases in coastal plain rivers towards the coast, the GPR signal becomes attenuated in the water column.
Recommendations
1. Ground penetrating radar surveys should be run along all major coastal plain rivers in North Carolina and correlated with the geology. These data would help indicate locations where the rivers are in connection with important aquifers or are separated by aquicludes. A map of these features would be very useful in determining areas where groundwater management may affect rivers or vice versa.
2. Ground penetrating radar surveys should be run along piedmont and mountain rivers in North Carolina. Future work should evaluate the effectiveness of ground penetrating radar as a
subsurface investigation tool in these settings.
3. In this study groundwater fluxes were typically several orders of magnitude larger on the north side of the river when compared to the south side. Hydraulic characteristics of sediment along the Tar River were dependent on the side of the river they were measured along. The river is in contact with Pliocene or older marine or estuarine sediments that tend to have clays and silts on the south side of the river. On the north side, the river is frequently in contact with reworked fluvial sediments which tend to be better sorted and coarser, typically fine to coarse sands. From observations made by other researchers this pattern is quite common along other coastal plain rivers in Virginia, North Carolina, South Carolina and Georgia. If similar behavior exists in other coastal plain rivers it is likely that the effects of land-use will vary based on the side of the river. Contaminants from septic systems, leaking underground storage tanks, and other anthropogenic sources on the north side of the river will be more likely to migrate to the river when compared to similar land-use on the south side of the river. Future work should address the variability in contaminant transport due to floodplain asymmetry along coastal plain rivers.
4. The degree of asymmetry of the Tar floodplain is notable. The Tar has been migrating to the south for at least thousands of years. The incision of the river and the presence of terraces to the north has allowed for the preservation of Holocene and Pleistocene sediments on terraces to the north. These sediments may hold important information with regards to past climate, hurricane occurrence, and flood frequency along the Tar. With new age dating technologies, such as optically stimulated luminescence (OSL), dating of these terraces and the various sediments underlying them may help unravel the past climate of the region.
5. Measurement of hydraulic conductivity in channel sediments is necessary to determine the hydraulic properties of river channels and their interactions with groundwater systems. However, this requires installing numerous piezometers or wells throughout a river basin which can be very labor intensive and expensive. Based on our hydraulic conductivity data obtained from channel piezometers along the Tar and their relationship with specific conductance data obtained from the same piezometers it may be possible to develop a relationship between hydraulic
conductivity and specific conductance of groundwater as a means to estimate hydraulic
INTRODUCTION
Groundwater inputs are important to streams for their influence on stream hydrology and ecology (Hayashi and Rosenberry 2002). Spatial variability of groundwater inputs to streams is common due to aquifer heterogeneity, slope, and variability in land cover. Groundwater
withdrawals may also affect groundwater inputs to streams by pirating water from them (O’Driscoll 2004, Lautier 2001). The degree to which a stream interacts with the underlying ground water system is important for a variety of scientific, practical, and legal reasons, such as wellhead protection (Nnadi and Sharek 1999), bank filtration (Sheets et al. 2002), stream ecology (Brunke and Gonser 1997), and non-point source pollution from adjacent lands (Hill et al. 1998). In the past, various methods have been used to study surface water-ground water interactions in diverse hydrogeological settings and at various scales (Edwards 1998, Harvey and Wagner 2000, and Woessner 2000). Common techniques include seepage runs (Zelwegger et al. 1989), seepage meters (Lee 1977, Isiorho and Meyer 1999), remote sensing (Atwell et al. 1971), radioactive and stable isotope tracers (Hoehn and Santschi 1987), water chemistry (Katz et al. 1997), dye tracers (Bencala et al. 1984, Triska et al. 1993), piezometery (Lee and Cherry 1978, Geist et al. 1998), biological investigations (Stanford and Ward 1993), numerical models (Nield et al. 1994), and water temperature (Silliman et al. 1995).
Stream channel sediment hydraulic properties are typically heterogeneous (Jones and Mullholland 2002). Numerous piezometers are required to adequately characterize hydraulic properties of an active river channel. Piezometer installation and monitoring in active river channels is difficult and expensive. In the Coastal Plain of North Carolina, it is difficult to maintain river channel piezometer installations for long periods because of flooding due to tropical storms and hurricanes. Practical techniques are needed to characterize the geological framework of the active river channel that controls the river’s relationship with the ground water system.
Recently, ground penetrating radar has emerged as a tool to characterize complex heterogeneities in paleochannels and floodplain settings (Naegeli et al. 1996 and Beres et al. 1999). GPR has been used in river channels to characterize the sediments adjacent to gravel-bed river channels (Naegeli et al. 1996). In this study, they dug a trench to ground-truth the GPR profiles. In the Rhine valley of northeastern Switzerland GPR surveys were conducted in step mode to characterize the glaciofluvial sediment framework. The GPR data was ground-truthed against outcrop photographs (Beres et al.1999). These studies have shown that
ground-penetrating radar has the potential to improve our understanding of the sedimentary framework of active river channels, and how rivers and groundwater systems interact.
river-groundwater interactions along coastal plain rivers is not well-known. We used a two-fold approach to study groundwater interactions with the Tar River: using physical hydrograph separations and field hydrogeophysical approaches to look at long-term and spatial variations of groundwater inputs to the Tar River and the geological controls on these inputs. Our study objective was to characterize river-groundwater interactions along the Tar River.
METHODS
STUDY AREA
Geological setting
The Tar River drainage basin occurs predominantly in the coastal plain of North
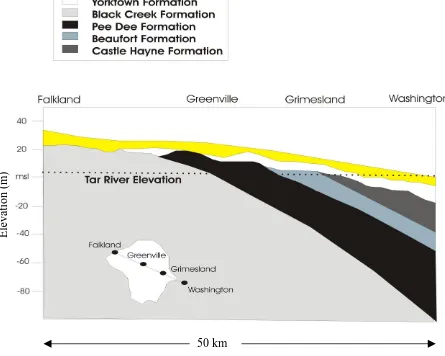
Carolina, with approximately 20% of the basin draining the piedmont. The central coastal plain is underlain by the unconfined surficial aquifer which is composed principally of Holocene to Pleistocene aged sediments. In the study region, within Pitt County, NC, the lower boundary of the unconfined surficial aquifer is always less than 15m below the land surface, but typically within 3-6m below the land surface (Sumsion 1970). The regional surficial geology is mostly unconsolidated sands, silts and clays (Spruill et al. 2003). The Yorktown formation is also present in the near surface within the region (Figure 1). The Yorktown is a Pliocene fossiliferous clay with varying amounts of fine-grained sand (Winner and Coble 1996). Because of erosion the Yorktown may not be present in some locations underlying Pitt County. Along the study reach of the Tar River, from Falkland to Greenville, NC, the Yorktown or surficial aquifer is either directly underlain by the Black Creek formation to the west near Falkland, or the Pee Dee Formation, near Greenville (Figure 1). The Tar River has incised down through the Yorktown formation and Surficial aquifer along its banks in many locations may flow through the Black Creek Formation or the Pee Dee Formation along the study reach.
A notable occurrence along the Tar River is the valley asymmetry, with the river frequently located at the extreme southwestern side of its valley. This results in a common pattern of steep bluffs and very narrow floodplains to the southwest of the river, and extensive floodplains and gentle slopes on the northeast side of the river. This pattern is a common occurrence along Atlantic coastal plain rivers. Several researchers have indicated that tectonic uplift is a likely explanation for similar river asymmetry in South Carolina (Sexton 1999) and along the Cape Fear River in North Carolina (Soller 1988).
2006). These deposits are often coarse grained and found along the north side of the Tar River. These deposits may have local influences on river-groundwater interactions because they are well drained and highly permeable.
The Black Creek Formation, which underlies the Tar along a large portion of Pitt County, consists of Late Cretaceous lagoonal to marine sediments. Typically Black Creek sediments are thinly laminated gray to black muds interlaminated to interbedded with tan sands that are very fine to fine (Winner and Coble 1996). The Black Creek aquifer is on average 60% sand and often is characterized by well-defined beds of clean sand and gray to black clay. A primary
characteristic of the Black Creek Formation is that it has a high content of organic material, lignitized wood, shell material, and glauconite. The confining unit that overlies the Black Creek aquifer, is composed of clay, silty clay, and sandy clay and is an average of 13 m thick. Along the Tar River, the river may be directly connected with the Black Creek Aquifer System because it may cut through the Black Creek confining unit in some locations. The Black Creek may discharge into the Tar where the channel cuts into it or its overlying confining unit.
To the east, the Pee Dee Formation typically underlies the Tar River. The aquifer is mainly composed of Late Cretaceous fine to medium grained sand (almost 70% sand)
Figure 1. Generalized east-west cross-section through Pitt County study area illustrating the projected subsurface geology along the Tar River (modified from Maddry 1979).
Hydrology and Meteorology
The Tar –Pamlico River basin is the fourth largest river basin in North Carolina and its boundaries are located entirely within North Carolina. The basin drains an area of 14,000 km2 (5,440 miles2 ). Land-use varies within the watershed with the major land-use being forest and wetlands (54%), 22 % is cultivated cropland, 20 % is open water area, 3 % is pasture and other managed herbaceous areas, and 1 % is urban (NC DENR 2003). Approximately 80% of the basin is located in the coastal plain and characterized by flat terrain, blackwater streams, low-lying swamps, and estuarine areas. Tributary streams are typically low-gradient, slow flowing with extensive swamps and bottomland hardwood forests in their floodplains (NCDENR 2003).The bulk of discharge to streams is from unconfined aquifers (Winner and Coble 1996).
Elevation (m)
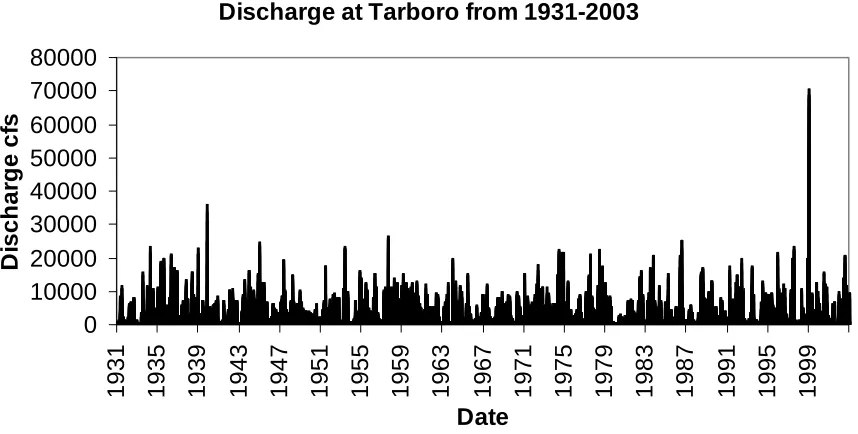
A long-term record of streamflow has been collected for the Tar River at the U.S. Geological Survey stream gage in Tarboro, NC (Figure 2). Mean annual streamflow for the Tar River at Tarboro, NC is 2,286 ft3/s (65 m3/s), based on the period of 1931-2003. Typically streamflow is greatest during March and lowest during October along the Tar. A common occurrence is an increase in streamflow during September due to hurricane inputs (Figure 3).
Discharge at Tarboro from 1931-2003
0 10000 20000 30000 40000 50000 60000 70000 80000
1931 1935 1939 1943 1947 1951 1955 1959 1963 1967 1971 1975 1979 1983 1987 1991 1995 1999
Date
D
isch
a
rg
e cf
s
0 1000 2000 3000 4000 5000
1 2 3 4 5 6 7 8 9 10 11 12
Month S tr e a m fl o w (c fs )
Figure 3. Long-term average monthly Tar River discharge (1931-2004) measured at Tarboro, NC (source: U.S. Geological Survey).
0 10 20 30 40 50 60 70 80
1920 1930 1940 1950 1960 1970 1980 1990 2000 2010
Year A nnua l r a in fa ll a m ount ( inc he s )
Figure 4. Long-term annual rainfall amounts measured at Greenville, NC (1931-2006) (Source: North Carolina State Climate Office). The black line is the 10-year moving average. 58.5 59 59.5 60 60.5 61 61.5 62 62.5 63 63.5 64
1930 1940 1950 1960 1970 1980 1990 2000
Year A v er age annual ai r temper at ur e (F )
STUDY SITES
Five sites along the Tar River were selected for study. The study reach extends from Falkland to Rainbow Banks, approximately 22 km long. Access permission was granted by the North Carolina Department of Transportation (Rte 264), North Carolina Wildlife Resources Commission (Falkland Boat Ramp), the City of Greenville (Elm Street and Port Terminal Road), and Dr. Stan Riggs, East Carolina University (Rainbow Banks) (Figure 6).
Falkland
Figure 7. Site map and location of the Falkland (F) monitoring station.
The Falkland site is located approximately 13 km northwest of Greenville, NC upstream from the Falkland Boat Ramp, directly off of State Highway 222 (035º 41’ 43.78”N, 077º 29’25.34”W) (Figure 7). At this location the stream channel elevation is 3 m above mean sea level. Conetoe Creek discharges into the Tar River approximately 125 m downstream. Land-use surrounding the site consists of predominantly forested floodplain with some drained croplands. The floodplain is approximately 1 kilometer wide at this location. The elevation difference between the floodplain and the uplands varies significantly between the north and the south sides of the river, on the south side of the river steep bluffs exist and upland areas near the river can be as high as 24m, whereas on the north side of the river the greatest land surface elevations are typically less than 13 m. The predominant soil types at the site are Ch (Chipley sand, moderately well drained) and La B (Lakeland sand, excessively well-drained) along the channel and
floodplain and AlB (Altavista sandy loam, moderately well drained soil) is present at greater distances from the river (Karnowski et al. 1974). The stream slope at the site is approximately 4.4 cm/km.
300 m
264
Figure 8. Site map and location of the 264 monitoring station.
The 264 site is located approximately 5 km northwest of Greenville, NC downstream from the US 264 North Bridge (035º 38’ 39.40”N, 077º 25’1.91”W) (Figure 8). At this location the stream channel elevation is 1 m above mean sea level. Bryan Creek discharges into the Tar River upstream and to the west of the site and Johnsons Mill Run joins the Tar just east of the site. Land-use surrounding the site consists of predominantly forested floodplain with several gravel pits within the floodplain. There is some residential development on the north side of the river, whereas the south side is currently forested. The floodplain is approximately one kilometer wide at this location. The elevation difference between the floodplain and the uplands varies significantly between the north and the south sides of the river, on the south side of the river upland areas near the river can be as high as 25m, whereas on the north side of the river the greatest land surface elevations are typically less than 9 m. The predominant soil types at the site are Bb (Bibb fine sandy loam, poorly drained), Os (Osier loamy sand, poorly drained), and Sw (Swamp, poorly drained loamy organic mixed dark alluvium) which are typically located in floodplain areas adjacent to the river and La B (Lakeland sand, excessively well-drained) and AlB (Altavista sandy loam, moderately well drained soil) which are typically located at higher elevations and at a greater distance from the river (Karnowski et al. 1974). The stream slope at the site is approximately 13 cm/km.
300 m.
Elm Street
Figure 9. Site map and location of the Elm Street (E) monitoring station.
The Elm Street site is located in Greenville, NC at the end of Elm Street, 1.5 km downstream of the Town Commons (035º 38’ 39.40”N, 077º 25’1.91”W) (Figure 9). At this location the stream channel elevation is 1 m above mean sea level. Parker Creek discharges into the Tar River upstream and to the west of the site. Land-use surrounding the site consists of predominantly forested floodplain on the north side of the river and urban development on the south side of the river. The floodplain is approximately 1.3 km wide at this location and most of the floodplain exists on the north side of the river. The elevation difference between the
floodplain and the uplands varies significantly between the north and the south sides of the river, on the south side of the river upland areas near the river can be as high as 18m, whereas on the north side of the river the greatest land surface elevations are typically less than 8 m. The
predominant soil type at the site is Bb (Bibb fine sandy loam, poorly drained) near the river. This poorly drained soil is common in the floodplain (north side) and WaB (Wagram loamy sand, well drained),Os (Osier loamy sand, poorly drained), AgB (Alaga loamy sand, excessively well drained), and Pa (Pactolus loamy sand, moderately well drained) are more common at higher elevations and greater distances from the river (Karnowski et al. 1974). The stream slope at the site is approximately 3 cm/km.
300 m.
Port Terminal Road
Figure 10. Site map and location of the Port Terminal Road (P) monitoring station.
The Port Terminal Road site is located in Greenville, NC at the end of Port Terminal Road, just downstream of the Boat Ramp, 6 km downstream of the Town Commons (035º 35’ 50.94”N, 077º 18’39.46”W) (Figure 10). At this location the stream channel elevation is 1 m above mean sea level. Hardee Creek and Meeting House Branch converge approximately 1 kilometer upstream and their waters discharge into the Tar just upstream of the Boat Ramp. Land-use surrounding the site consists of predominantly forested floodplain on the north side of the river and some residential development at higher elevations on the south side of the river. The floodplain is approximately 1.5 km wide at this location and most of the floodplain exists on the north side of the river, although several hundred feet border the south side of the river. The elevation difference between the floodplain and the uplands vary significantly between the north and the south sides of the river, on the south side of the river upland areas near the river can be as high as 20m, whereas on the north side of the river the greatest land surface elevations are
typically less than 4 m. The predominant soil type at the site is Bb (Bibb fine sandy loam, poorly drained) near the river. This poorly drained soil is common in the low-lying floodplain areas (mostly on the north side of the river) and LaB (Lakeland sand, excessively well-drained), OcB (Ocilla loamy fine sand, somewhat poorly drained), and Os (Osier loamy sand, poorly drained) are more common at higher elevations and greater distances from the river (Karnowski et al. 1974). The stream slope at the site is approximately 3 cm/km.
300 m.
Rainbow Banks
Figure 11. Site map and location of the Rainbow Banks (R) monitoring station.
The Rainbow Banks site is located in Greenville, NC at the Riggs’ Property along Rte 33, 6 km downstream of the Greenville Town Commons (035º 35’ 50.94”N, 077º 18’39.46”W) (Figure 11). At this location the stream channel elevation is 1 m above mean sea level. Mill Branch discharges into the Tar approximately 200 meters upstream. Land-use surrounding the site consists of predominantly forested floodplain on the North side of the river, croplands are more common at greater distances and higher elevations from the river. Some residential development is present at higher elevations on the south side of the river. The floodplain is approximately 1.5 km wide at this location and most of the floodplain exists on the north side of the river. The elevation difference between the floodplain and the uplands varies significantly between the north and the south sides of the river, on the south side of the river upland areas near the river can be as high as 19 m, whereas on the north side of the river the greatest land surface elevations are typically less than 6 m. The predominant soil type at the site is WaC (Wagram loamy sand, well drained, steep slope), at higher elevations and Bb (Bibb fine sandy loam, poorly drained) at lower elevations near the river on the south side and Ch (Chipley sand, moderately well drained) adjacent to the river and OcB (Ocilla loamy fine sand, somewhat poorly drained), at greater distances from the river on the north side of the river (Karnowski et al. 1974). The stream slope at the site is approximately 3 cm/km.
300 m.
HYDROGRAPH SEPARATIONS AND DISCHARGE ANALYSIS
Daily discharge data was obtained from the U.S. Geological Survey stream gage at Tarboro, NC (USGS Gage 02083500 Latitude 35°53'40", Longitude 77°31'59", Drainage Area -2,183 miles2 or 5653 km2). This record spans the period of 1931-2002 and was used to determine long-term variations in baseflow contributions to the Tar River. In addition, the daily discharge data from the U.S. Geological Survey stream gage at Tarboro, NC was statistically analyzed for the period from 1931-2002 to determine long-term trends in discharge and discharge variability over time. U.S. Geological Survey stream flow records from Tarboro and Greenville were used to quantify seasonal downstream increases in stream flow over the period of record (1997-2005). The Greenville gage has a record from 1997-present (USGS Gage 02084000 Latitude 35°37'00", Longitude 77°22'22", Drainage Area-2,660 miles2 or 6890 km2). To determine large-scale
ground water inputs to the Tar River, differences in baseflow were compared between Tarboro and Greenville.
Mechanical hydrograph separation was performed on the discharge data using a hydrograph analysis model (W.H.A.T.- Web-based Hydrograph Analysis Tool) developed by Lim et al. 2005. The local minimum method was chosen to separate the stream hydrograph into baseflow and stormflow components. This method analyzes each daily measurement of
streamflow. A discharge point is considered the local minimum if it is the lowest discharge in one half the interval minus 1 day (0.5(2N-1) before and after the date being considered (Sloto and Crouse 1996). The baseflow values for each day between local minimums are estimated by linear interpolations, the lowest points on the hydrograph are connected by straight lines,
anything above this line is considered stormflow and anything below is considered baseflow. The line for the entire data series of daily streamflow from 1931-2003 was estimated using the model and the associated stormflow and baseflow components were estimated.
SUBSURFACE INVESTIGATION
Geophysical Surveys
Ground penetrating radar (Geophysical Survey Systems Inc., Subsurface Interface Radar System-2000 with a 200 MHz antenna) was used to characterize heterogeneity in the underlying active river channel sediments. The stratigraphy beneath the river bottom was imaged to depths up to approximately 5 meters. GPR transect data was collected in continuous mode, and at higher spatial resolution at targeted sites to characterize subsurface stratigraphy along 18 segments of the 22 km study reach. We used sediment logs and hydraulic conductivity information from borings within and adjacent to the river channel to reference horizons in the GPR data. The GPR antenna was floated in a rubber raft; data were collected in continuous mode (Figure 12).
Figure 12. Ground penetrating radar was floated in a raft to image the underlying river channel sediments at the Falkland site along the Tar River.
Sediment Sampling and Ground Water/Surface Water Monitoring
Eighteen piezometers and 39 m of split spoon cores and hand auger samples were used to characterize the subsurface near the Tar River. Split-spoon samples of floodplain and active channel sediments were obtained during piezometer installation to reference GPR transects. Slug tests were performed at all piezometers to characterize the hydraulic properties of the
surrounding sediments. The Bouwer and Rice Slug Test Method was used (Fetter 1994). Water level changes during slug tests in each piezometer were recorded using Hobo water level recorders.
Hydraulic conductivity was estimated for 18 piezometers. River-ground water head gradients were measured in each piezometer every two weeks since September 2005. In addition, on the south side of the river the surface water and ground water levels and temperatures were recorded with HOBO pressure transducers at 30 minute intervals and downloaded monthly using a laptop computer. Measured hydraulic conductivity values were used to calculate ground water flux to and from the river channel (Darcy’s Law), using head gradients based on those measured in the river.
Water temperature recorders and pressure transducers were installed in stream channel piezometers adjacent to the river. Surface water temperature and stream stage were also recorded at these locations. Ground water temperature and water level measurements were recorded at all five sites to quantify temporal variations in ground water flux to the river channel. Water
Figure 13.a. Typical stream-ground water level monitoring station
RESULTS
Hydrograph Separation and Discharge Analysis
The hydrograph separation (local minimum method) performed on the daily Tar River discharge data (Tarboro gage) from 1931-2003 revealed that on average baseflow makes up 60 % of total discharge (Figure 14). The extreme values of baseflow and total discharge in 1999 were related to runoff from Hurricane Floyd. In general, there is a strong seasonality in baseflow related to annual variations in rainfall and evapotranspiration.
0 10000 20000 30000 40000 50000 60000 70000 80000
1932 1936 1940 1944 1948 1952 1956 1960 1964 1968 1972 1976 1980 1984 1988 1992 1996 2000
Dat e
Total discharge (cfs) Baseflow (cfs)
Figure 14. Long-term total hydrograph separation (1931-2003) for total discharge at Tarboro, NC USGS gage. Total discharge is in blue and the baseflow component is in red.
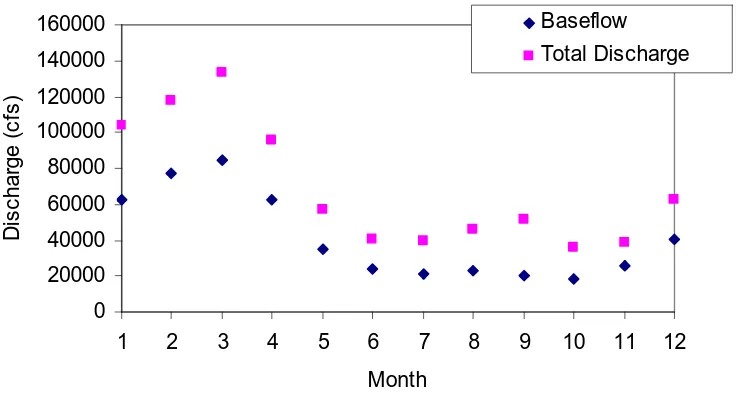
Based on the long-term record, baseflow is typically at a maximum during March and at a minimum during October (Figure 15). There is a small upward trend in total discharge during the summer that peaks in September, this is likely due to the type of rainfall events common in summer months, convective thunderstorms that quickly saturate the ground and allow runoff to occur. The large water demand by vegetation during these months would also result in lower baseflows. In September the increase in total discharge is related to the occurrence of tropical storms and hurricanes. A time series of the baseflow composition of the total runoff (as a percentage) reveals a large difference in composition of total discharge during the growing season (May-October) with a minimum during September (Figure 16).
Discha
rge
(c
0 20000 40000 60000 80000 100000 120000 140000 160000
1 2 3 4 5 6 7 8 9 10 11 12
Month D is c har ge ( c fs ) Baseflow Total Discharge
Figure 15. Long-term variations in monthly total discharge and baseflow, at Tarboro, NC USGS gage (1931-2003).
Figure 16. Long-term variations in monthly baseflow percentage of total discharge, at Tarboro, NC USGS gage (1931-2003).
The importance of non-growing season rainfall to annual baseflow can be illustrated by comparing the total annual rainfall and the dormant season annual rainfall with the annual baseflow at Tarboro. A comparison of mean annual baseflow versus total annual rainfall and a comparison of mean annual baseflow versus total annual dormant season rainfall (1932-2002) indicate that rainfall during the non-growing season is more important in determining the amount of annual baseflow in the Tar (Figure 17). The regression equations indicate that dormant season precipitation for a given year predicts the mean annual baseflow better than the total annual precipitation for a given year. Based on R2 values from the regression equations the dormant
20 40 60 80
1 2 3 4 5 6 7 8 9 10 11 12
season precipitation predicts 11% more of the variance in baseflow when compared to total annual precipitation, indicating that lesser recharge occurs during the summer/growing season.
Mean Annual Baseflow = 1235.7Ln(Total Precipitation) - 3444.7
R2 = 0.2627
Mean Annual Baseflow = 960.5Ln(Dormant Season Precipitation) - 1862.6
R2 = 0.3739
0 500 1000 1500 2000 2500 3000
0 10 20 30 40 50 60 70 80
Precipitation Amount (in)
Mean An
nual Baseflow
(cf
s
)
Precipitation during dormant season
Annual precipitation
Figure 17. Long-term comparison of mean annual baseflow versus total annual rainfall and a comparison of mean annual baseflow versus total annual dormant season rainfall (1931-2003).
0 50 100 150 200 250
1 2 3 4 5 6 7 8 9 10 11 12
Month C o ef fi ci ent of V a ri at io n ( %
) Total Discharge
Baseflow
Figure 18. Long-term variability in monthly total discharge and baseflow at Tarboro, NC USGS gage (1931-2003), as expressed by the coefficient of variation (standard
deviation/mean*100%).
The long-term variation of total discharge, runoff, and baseflow was evaluated using 10-year moving averages of the daily data (Figure 19). There is a notable decline in average total discharge, baseflow, and runoff during the 1970s which may be related to a drop in rainfall amounts in the late 1960s and early 1970s. After this period there is a slight decrease in average baseflow. A comparison of 10-year average baseflows from 1941-1971 versus those from 1972-2002 revealed that a slight decrease (88 cfs or 2.5 cms) in median baseflow has occurred based on a Mann-Whitney test (significant at 0.0027). Similarly a slight decrease in median total discharge of 204 cfs (5.8 cms) has occurred since the 1970s (significant at 0.0034).
0 500 1000 1500 2000 2500 3000 3500 4000 4500
1932 1936 1940 1944 1948 1952 1956 1960 1964 1968 1972 1976 1980 1984 1988 1992 1996 2000 Year
T o t a l D i sc h a r g e
B a se f l o w
R u n o f f
Discharge-frequency distribution curves were constructed for total daily discharge and baseflow using the data record from 1931-2003 (Figures 20 and 21) to evaluate the observed changes in streamflow and baseflow over time along the Tar River. The data were split into two categories- before 1971 and after 1971. The total discharge and baseflow curves reveal a
common pattern indicating that stream discharge and baseflow variation has slightly changed over time along the Tar River. The portion of the discharge-frequency curves where this is most notable is for the discharges that occur between 50-90% chance of exceedance. The flows that occur with this frequency have decreased in magnitude over time. For example, the baseflow that should be equaled or exceeded 75% of the time was 470 cfs (13.3 cms) for the period of 1931-1971 however for the period of 1972-2003 the baseflow for this 75% probability dropped to 383 cfs (10.8 cms). These curves indicate that lower streamflows and baseflows have become more common over time along the Tar River. However at the extreme high probabilities (>98%) or extreme low flows, the baseflow and streamflows have slightly increased. This may be a consequence of the changing amounts of wastewater discharge to the stream over time or interbasin transfers. At the other extreme, for extreme low probability discharges, (<10%) baseflow and total discharge has shown a slight increase, possibly related to increased storm activity. The discharge frequency distributions indicate that slight changes in the magnitude of total discharge and baseflow discharge have occurred over time along the Tar River when comparing the time period of 1931-1971 versus 1972-2003, most notably a decrease in the magnitude of discharge for higher probability discharges (>50% likelihood of occurrence). These data indicate that streamflow and baseflow have become more variable over time along the Tar River. Recent work has indicated that these types of changes are common and there is evidence to support the occurrence of an intensification of the global hydrologic cycle, with many regions throughout the world showing trends of increased rainfall, runoff, and drought during the last century (Huntington 2006).
1 10 100 1000 10000 100000
0 20 40 60 80 100
Probability (%) of occurrence of a discharge greater than or equal to that listed for a given day
M e a n Da ily Dis c h a rg e ( c fs ) 1931-1971 1972-2003
1 10 100 1000 10000 100000
0 10 20 30 40 50 60 70 80 90 100
Probability (%) of occurrence of a baseflow greater than or equal to that listed for a given day
M e a n D a il y B a s e fl o w ( c fs ) 1931-1971 1972-2003
Figure 21. Baseflow-frequency distribution curves at Tarboro, NC USGS gage (split into two groups: 1931-1971 and 1972-2003).
The minimum daily baseflow in a given year was used to evaluate long-term trends in low discharge events (Figure 22). The data indicate that recent baseflow minimums are
significantly lower than those observed before 1972. A Mann-Whitney test compared the 1941-1971 data with the 1972-2002 data and indicated that baseflow minimums for the most recent period have dropped by 33 cfs (0.93 cms) when compared to the earlier period (significant at < 0.0001). These trends are evident when comparing the 10-year average minimum values and their variation over time (Figure 23). A similar comparison for maximum baseflows indicated no significant difference between these two time periods.
0 50 100 150 200 250 300 350 400 450 500 193 2 193 6 194 0 194 4 194 8 195 2 195 6 196 0 196 4 196 8 197 2 197 6 198 0 198 4 198 8 199 2 199 6 200 0 Year Mi n imu m D a il y B a s e fl o w(cf s )
Figure 22. Annual minimum daily baseflow at Tarboro, NC USGS gage (1931-2003). Black line is 10-year moving average.
0 50 100 150 200 250 300
1930 1940 1950 1960 1970 1980 1990 2000 2010
Date M in im u m D a ily B a s e fl o w ( c fs ) (10-y ear m o v ing av er age) 1941-1971 1972-2002
25 50 75 100 125 150 175 200 225
1932 1936 1940 1944 1948 1952 1956 1960 1964 1968 1972 1976 1980 1984 1988 1992 1996 2000 Year A n nual c o e ff ic
ient of v
a ri at io n (%
) of bas
e
flow
Figure 24. Annual coefficient of variation (standard deviation/mean*100%) of baseflow at Tarboro, NC USGS gage (1931-2003). Black line is 10-year moving average.
0 20 40 60 80 100 120
1930 1940 1950 1960 1970 1980 1990 2000 2010
Year A nnu al c o ef fi c ient of v a ri ati o n o f bas ef lo w % (10-Y r M o v in g A v er age) 1941-1971 1972-2002
The magnitude of baseflow contributions along the Tar River were evaluated by comparing the baseflow contributions estimated at Tarboro to those estimated at Greenville USGS gages. The Tarboro gage is approximately 35 km upstream of the Greenville gage, a long enough distance for baseflow contributions to be measurable downstream. The USGS Greenville gage has a limited record compared to Tarboro, therefore upstream-downstream comparisons could only be conducted during the time period when both discharge records overlapped (April 1997-Feb 2006). Due to Hurricanes Dennis and Floyd (September 1999), the data between September 5 and October 10 1999 were outliers affected by extreme flooding during these periods. These data were excluded from baseflow analyses. Baseflow contributions at each gage were estimated using the local minimum hydrograph separation method. For the period of April 1997-Feb 2006 the average baseflow increase downstream was 199 cfs (5.6 cms) or a 20% increase relative to baseflow at Tarboro. Average baseflow increases along the Tar for April 1997-Feb 2006 were 9 cfs/mile (0.16 cms/km). The variability in baseflow inputs over time along this stretch is illustrated in Figure 26.
-100 -50 0 50 100 150 200
1997 1998 1999 2000 2001 2002 2003 2004 2005
Date Pe rc e n t C h a nge i n B a s e fl ow be twe e n T a rbor o a nd Gr e e n v il le , N C
Along this stretch of the Tar River baseflow typically increases downstream for most of the year. During the time period of 1997-2006 it is apparent that numerous periods existed when baseflow losses between Tarboro and Greenville occurred, these may be due to downward seepage through channel sediments or from evapotranspiration losses (Figure 26). The City of Greenville obtains water supplies from the Tar between gages but these amounts are less than 1.5 cfs (0.04 cms) and should not represent a large difference when compared to total baseflow. Seasonal comparisons of baseflow differences downstream reveal that on average baseflow increases downstream for every month of the year. However, there is significant variability in the magnitude and percentage of baseflow increase downstream. June is the month when baseflow increases downstream are typically the lowest, approximately 87 cfs (2.46 cms) or 13% increase from baseflow at Tarboro (Figure 27). January typically exhibited the largest baseflow increases downstream with average baseflow at Greenville during January being 385 cfs (10.9 cms)larger than that estimated at Tarboro (26.4% of Tarboro baseflow). With respect to baseflow
magnitude, the greatest flows typically occur during the non-growing season. These analyses help to bracket average baseflow inputs along this stretch of the Tar between 4 cfs/mile (0.07 cms/km) and 17.5 cfs/mile (0.31 cms/km) in a given year, based on the past 9 years of data. These estimates do not isolate ground water that only discharged along the main channel of the Tar, they include groundwater discharged to tributaries along this stretch of the Tar.
0 50 100 150 200 250 300 350 400 450 Janua ry Febru ary Marc h
April May Jun
e July Augu st Sept emb er Octo ber Nove mbe r Dece mbe r Month D iffe re n c e i n b a s e fl o w (c fs ) b e tw e e n T a rb o ro a n d Gr e e n v ille
Hydraulic Conductivity
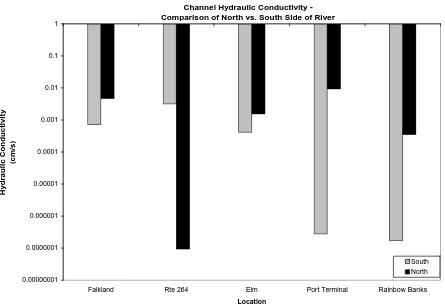
River channel sediment hydraulic properties are typically very heterogeneous (Jones and Mullholland 2002). Hydraulic conductivity values of the sediments in and adjacent to the Tar River ranged from 10 -2.03 to 10-7.03 cm/s (Figure 28) based on data from 19 slug tests. The median hydraulic conductivity for all sediments was 10-3.38 cm/s. These values are in agreement with other published values (p.98 Fetter 1994). The majority of samples fall within the categories of fine sands or well-sorted sands ranging in hydraulic conductivity from 10-5 to 10-1 cm/s. This indicates that most sediments within or adjacent to the Tar tend to be relatively permeable. At four locations the hydraulic conductivity values were extremely low (<10-6 cm/s) indicating the presence of clay sediments in the subsurface. With the exception of the Route 264 site, the hydraulic conductivity values typically were lower on the south side of the river (Figure 29). The median hydraulic conductivity for the north side of the river was 10-2.82 cm/s, whereas along the south side the median hydraulic conductivity was 10-3.38 cm/s. This may be related to the
differences in sediment type related to depositional processes, sediments on the north side of the river are likely reworked river deposits, which tend to be very permeable. On the south side of the river the Tar is typically incising into Pliocene or older Cretaceous sediments, which may be clay-rich because they were deposited in estuarine or marine environments. Along our study reach and for most of the length of the Tar River a similar asymmetrical pattern exists with steep bluffs and very narrow floodplains to the southwest of the river, and extensive floodplains and gentle slopes on the northeast side of the river.
Hydraulic conductivity 1.00E-08 1.00E-07 1.00E-06 1.00E-05 1.00E-04 1.00E-03 1.00E-02 1.00E-01 1.00E+00
F - bank
shal
low
F - bank
deep
F - bank
deep 2
F- c
hann
el s
outh
F- c
hann
el nor
th
E- c
hannel nor
th
E- c
hannel
sout
h
F - bank
shal
low
F - bank
deep
PT - bank
dee p
PT - c
hannel
sout
h
PT - bank
sha
llow
PT -
channe l nor th RB - bank shal low RB - bank deep
RB
channel
sout
h
RB
- channel
nor th
264
channel
south
264
- channel
nor th Location H y d rau li c co n d u c ti vit y ( c m /s) C lay
Silt, sandy silt, clayey sand Silty sands, fine sands
Well-sorted sands
Channel Hydraulic Conductivity - Comparison of North vs. South Side of River
0.00000001 0.0000001 0.000001 0.00001 0.0001 0.001 0.01 0.1 1
Falkland Rte 264 Elm Port Terminal Riggs
Location H y dr au lic C o n d u c tiv ity (cm/ s) South North
Figure 29. A comparison of hydraulic conductivity values measured in stream channel and piezometers along the North vs. South sides of the Tar River.
Groundwater Flux
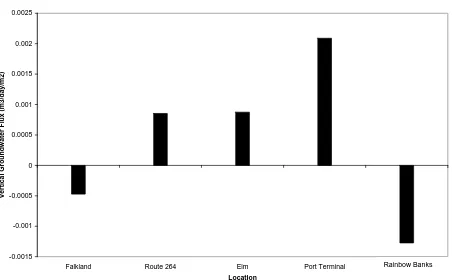
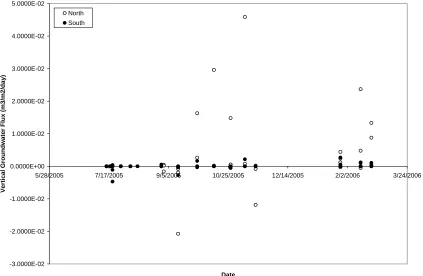
Vertical groundwater fluxes to the Tar River varied over time and ranged from +0.0033 and -0.0036 m3/day/m2 in piezometer nests from September 2005-March 2006. Since 264 did not have a piezometer nest installed, the channel piezometer data on the south side was used as a substitute. The piezometer nests at Falkland and the Riggs property tended to show a vertical downward flux of groundwater during the period of study indicating that sections of the river may lose water at certain times of the year. The other sites tended to show gaining conditions, typically vertical groundwater flux was upwards to the river. A net comparison over this time period indicates that conditions are typically gaining along the Tar (Figure 30). A comparison between the north and south sides of the river indicates that the north side typically has greater groundwater inputs than the south side, at least for the time of year when these data were collected (Figure 31). The median vertical groundwater flux on the north side was 3.99 x 10⁻⁴ m3/day/m2 whereas the south side median groundwater flux was -1.7348 x 10⁻⁶ m3/day/m2. These differences are related to the common presence of lower hydraulic conductivity materials on the south side of the river. A continuation of the monitoring along the Tar will reveal if this pattern holds for the entire year.
Average Vertical Groundwater Flux at Sites -0.0015 -0.001 -0.0005 0 0.0005 0.001 0.0015 0.002 0.0025
Falkland Route 264 Elm Port Terminal Riggs
Location V e rt ic a l Gr o undw a te r F lux (m 3 /d a y /m 2 )
Figure 30. A comparison of average vertical groundwater fluxes at five study sites along the Tar River (September 2005-March 2006) .
-3.0000E-02 -2.0000E-02 -1.0000E-02 0.0000E+00 1.0000E-02 2.0000E-02 3.0000E-02 4.0000E-02 5.0000E-02
5/28/2005 7/17/2005 9/5/2005 10/25/2005 12/14/2005 2/2/2006 3/24/2006
Date V e rtic al Groundw ate r Fl ux (m3/ m2/ d ay ) North South
Figure 31. A comparison of vertical groundwater fluxes at the north versus the south side of the river, along the Tar River over the study period .
Water Temperature
Water temperature data were collected during site visits in all piezometers and at a 30-minute interval by Hobo water level/temperature recorders at channel piezometers on the south side of the river. The temperatures were found to vary in deep groundwater piezometers at each site, with lowest average groundwater temperatures observed at the Rainbow Banks site at 17.27 ºC and the highest groundwater temperatures measured at Elm Street (19.63 ºC) for the period of September 2005-March 2006 (Figure 32). Groundwater temperatures measured in stream
10 12 14 16 18 20 22 24
8/16/2005 9/15/2005 10/15/2005 11/14/2005 12/14/2005 1/13/2006 2/12/2006 3/14/2006
Date G ro u n d w a te r t e m p er at u re ( d eg rees-C ) Faulkland Elm Street PT Riggs
Figure 32. A comparison of groundwater temperatures (ºC) measured in deep piezometers at four site along the Tar River over the study period.
Surface Water vs Ground Water Temperature
GW Temperature = 0.8856(SW Temperature) + 2.1746 R2 = 0.9622
0 5 10 15 20 25 30 35
0 5 10 15 20 25 30 35
Surface Water Temperature (C)
G rou nd W a te r Te m p e ra tur e (C )
Figure 33. A comparison of groundwater temperatures measured in stream channel piezometers and surface water temperatures measured in the Tar River over the study period .