Proceedings of the 2018 Winter Simulation Conference
M. Rabe, A.A. Juan, N. Mustafee, A. Skoogh, S. Jain, and B. Johansson, eds.
SIMULATION-BASED EVALUATION ON INTEGRATING ADDITIVE MANUFACTURING CAPABILITY IN A DEPLOYED MILITARY ENVIRONMENT
Timothy A. Moore Brandon M. McConnell
James R. Wilson
Operations Research Graduate Program North Carolina State University
111 Lampe Drive
Raleigh, NC 27695-7913, USA
ABSTRACT
This article develops a data-driven forecast of repair parts for the M109A6 Paladin self-propelled 155 mm howitzer, and this forecast drives a discrete-event simulation to assess requirements for Additive Manu-facturing (AM) to be a feasible part of the U.S. Army’s expeditionary supply chain. Actual part demand from the initial invasion of Iraq in 2003 during Operation Iraqi Freedom (OIF) feeds a sample-path-based forecasting method to obtain part demand for each scenario. A simulation of a conceptualized deployed Army 3D-printing facility integrated into the supply chain evaluates the performance and feasibility of the different operational policies. Results indicate current technology could support one battery (or smaller unit) for parts below 100 cubic inches while keeping performance comparable with OIF. These results are incorporated in realistic recommendations for how the Army can potentially improve its supply chain practices with this progressive technology.
1 INTRODUCTION
Based on their recent interview with General Mark A. Milley, the U.S. Army Chief of Staff, Barno and Bensahel (2017) summarize one of General Milley’s main messages as follows: “The convergence of new developments such as ubiquitous information technology and personal communications, proliferation of precision guided weapons, robotics and on-site 3D printing, and rapidly growing urbanization all augur a very different era of warfare.” The reality of fighting conflicts in isolated environments continues to be a certainty, and the challenges with providing adequate logistics in those environments is an ever-present problem. Additive Manufacturing (AM) provides an opportunity to keep equipment fully mission capable even in the most remote parts of the globe. The main goal in utilizing AM to produce spare parts is to re-duce the overall lead time on requested spare parts. The drawbacks of traditional resupply are the trans-portation time and costs associated with reaching areas isolated by oceans, jungles, deserts, and other bar-riers. The solution afforded by AM technology capitalizes on distributed production, one where the parts are manufactured at the same location as the customer. The standing assumption is that sufficient printing materials and supplies can be transported with the same units requiring spare parts production.
Khajavi et al. (2014) investigate the applicability of 3D printed spare parts for the U.S. Navy, specifi-cally an F/A-18 Super Hornet, in a study that highlights many of the benefits AM provides. The authors identify potential economic benefits such as less necessity for a sophisticated ERP system and a shift to-ward distributed production. Moreover, a distributed logistics operation may decrease the need for third-party logistics providers (3PLs) since there will not be as great a need to transport parts around the globe (Khajavi et al. 2014). This study examined one specific part for the F/A-18 and how that part affected
craft downtime, whereas our simulation provides a broader view of spare part replacement in a deployed environment.
In practice today, a new GE Global Research program is implementing cutting-edge 3D printing and scanning technology to create replacement parts for aging ships in the U.S. Navy (Pomerantz 2018). Of-tentimes, the techniques to manufacture the antiquated equipment do not exist anymore; however, a so-phisticated scanner can image the part, permitting a 3D printer to produce a near-identical replacement.
Effective use of AM opens up the possibility for on-demand printing to be a major component of just-in-time manufacturing. If AM is decoupling parts of the supply chain, then it stands to reason that the overall chain is simplified and made more efficient. Moreover, the need for warehousing, transportation, and packaging can be significantly reduced. With proper supply chain configuration, it is possible to im-prove cost efficiency while maintaining customer responsiveness using AM (Huang et al. 2013).
Knowing that the U.S. Army is an ideal candidate to capitalize on AM technology, we must address the implementation requirements for AM. Can current AM technology have a sizeable impact if it is inte-grated into an Army logistics model? In this paper we are concerned with satisfying a realistic demand rate. The assumption is made that AM can print everything required with a 3D metal printer. In this re-gard we are not answering specific engineering hurdles; rather we are using realistic AM build rates to demonstrate what parts produced by traditional manufacturing (TM) can be supplanted with parts pro-duced by AM. In this regard, the goal is to identify technological and demand scenarios where AM can feasibly be integrated into expeditionary logistics to add value for a commander.
2 METHODOLOGY
2.1 Data Used
We used data from the RAND study on the invasion of Iraq in 2003 (Peltz et al. 2005). The initial dataset consisted of approximately 5.5 million orders for military spare parts over a six-month period. This da-taset was narrrowed down to 1,700 orders based on the following criteria: metal parts for an M109A6 Paladin as shown in Figure 1. In essence, we were left with a realistic demand rate for three mechanized artillery battalions ordering parts for their main weapon in a combat environment during an initial inva-sion. Every order consisted of a part type and part quantity, which is important because those two ele-ments resulted in a total volume (in cubic inches) for each order. Part types are categorized based on a National Item Identification Number (NIIN).
In the simplest terms we had to consider the stream of incoming part orders as our arrival process and the successive 3D build times as our service process. An overview of the simulation is provided in Figure 2 below. The goal was to generate a total part volume for each day and then to determine how long a 3D printer would take to complete all order requests. The number and pattern of arrivals varied based on the scenario being considered in the simulation. For instance, as the size of the combat unit decreased, it fol-lowed that the number of orders submitted per day also decreased.
stud-ies should explicitly explore scenario-specific mission timelines; see McConnell et al. 2018). For each pa-rameter combination, the choice of echelon and maximum part volume results in a constant sample aver-age arrival rate (e.g., 11.5 orders per day for three mechanized artillery battalions).
Figure 1: M109A6 Paladin is a self-propelled 155 mm howitzer and serves as the main firing system for mechanized field artillery units.
Figure 2: The simulation, coded in MATLAB R2016b, generated a number of orders for each day. Each order consisted of a part type and part quantity. The volume was pulled directly from the RAND dataset. The total volume was used to determine build time based on a predetermined linear regression.
Table 1: The different design parameters and levels of each parameter considered (*‘1x’ denotes 2018 technology).
Volume (A)
Echelon (B) Print Speed (C) (1) Less than 250 cubic inches (1) 3 Battalions (1) 1x *
2.2 Structure and Operation of the Simulation
We then used the predetermined distributions to randomly generate order arrivals (per day) across the time horizon, which is approximately six months. This was done up front for each replication, and the simulation was not complete until all orders were fulfilled. Next, we selected the part type and quantity based on stored probability mass functions (PMFs); note the PMFs for part quantity are conditional on part type (NIIN). For this selection we successively used a discrete inverse transform to determine what stratum (part type) and subsequent quantity to incorporate in the order. In this way, we conditioned on part type to determine a part quantity that was bounded by real historical data. Ultimately, the arrivals were stochastic but always data-driven, and a summary of the process is depicted in Figure 2.
2.3 Arrival Process
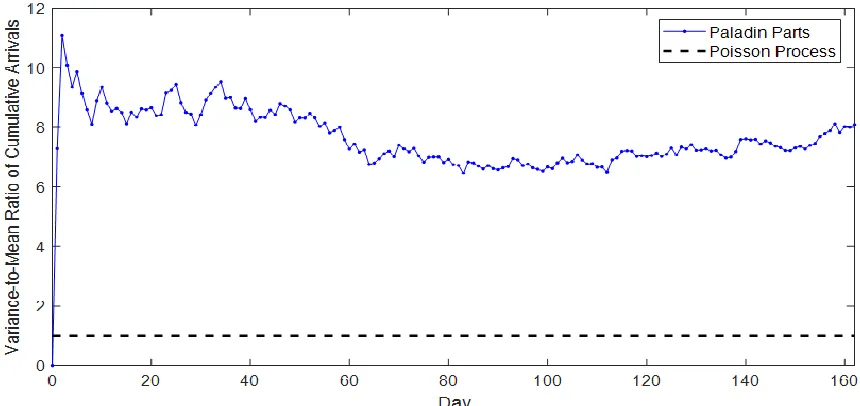
Our data-driven arrival process is a nonstationary, non-Poisson process (NNPP); Figure 3 confirms it is overdispersed as the variance-to-mean ratio of cumulative arrivals is greater than one. Figure 3 displays the sample dispersion for the arrival process using 100 sample paths. Note that while the mean arrival rate is constant over the time horizon, there is significant variation about that mean. Let
A t t
, 0
be the counting process defined as the number of Paladin part orders received up to time t so that the index of dispersion for this arrival process is I t
VarA t
EA t
,t0. Accounting for this extra varia-tion is an important feature for models pertaining to deployed military environments, where there are high levels of uncertainty. McConnell et al. (2018) also observed overdispersion in logistical requisitions in deployed military environments. The literature notes this phenomenon in other applications as well, in-cluding arrivals at emergency rooms and call centers (Kim and Whitt 2014; Kim et al. 2015; Whitt and Zhang 2015; Liu et al. 2018).Figure 3: Dispersion of Paladin part order arrival process (all part volumes) using 100 sample paths.
2.4 Service Process
used as a basis to derive build time based on total volume. We used the simple linear regression model ,
y x where y is the part build time (hours) and ε is an error term. The estimated intercept ˆ 0.940,
and the estimated slope
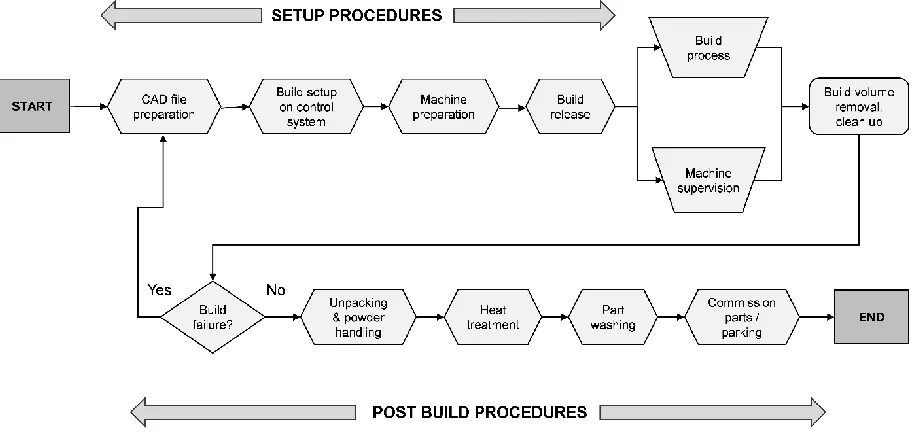
ˆ 0.292. The fitted regression had correlation coefficient 2 0.833R so that the sample correlation between volume and build time was 0.913 (Moore 2018). The build time accounts for all steps in the 3D build process depicted in Figure 4. The simulation grouped each step into three categories: setup, build, and postbuild. The purpose of Figure 4 is to identify all pro-cedures required to 3D print a spare part. Both prebuild and postbuild times were incorporated using gen-eralized beta distributions with realistic upper and lower bounds. Lastly, to account for a postbuild quality inspection, a 90% pass rate was used to determine if the printed part needed to be printed again. Other significant assumptions in the model were the following: (i) only one part was printed at a time; (ii) the queueing discipline was first-in-first-out (FIFO); and (iii) the 3D printer was colocated with the customer, thus eliminating transportation time and costs. All assumptions were vetted through discussions with AM experts at NC State’s Center for Additive Manufacturing and Logistics (CAMAL, camal.ncsu.edu).
Figure 4: AM build process, incorporating setup and postbuild procedures.
3 RESULTS
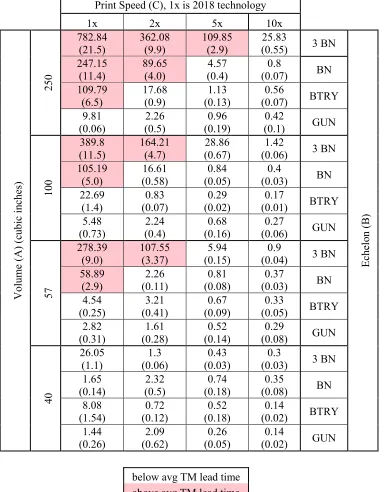
In order to understand how current AM technology, as well as future improvements to the technology, performed in the simulation, we used a scenario layout that combined the most influential predictor varia-bles (factors) for all scenarios. In particular, three factors had the largest impact on the average lead time for an individual part: the part volume (factor A); the unit size or echelon (factor B) being supported by the AM technology; and the build speed (factor C) presented as a multiplier of the build rate with the cur-rent technology (1x is 2018 speed). Table 1 shows all the combinations of different factor levels consid-ered for the simulation, which yielded 64 different scenarios. In the simulation, each scenario was repli-cated 100 times. For each given level of build speed (C), the randomly sampled order arrival times and characteristics are the same across all combinations of the volume (A) and echelon (B) factors. Key out-puts included lead time as well as total volume processed. Model validation was conducted by comparing total part volume generated with the OIF data.
later. In our simulation, the assumption was made to utilize a distributed manufacturing technique. Hence, lead time was a direct reflection of build time. Table 2 presents the simulation results (average lead time in days) with the half-length for a 95% confidence interval.
Table 2: Simulation results depicting average lead time in days (95% confidence interval half-length).
Print Speed (C), 1x is 2018 technology
1x 2x 5x 10x
V ol um e ( A ) ( cubi c i nche s) 250 782.84 (21.5) 362.08 (9.9) 109.85 (2.9) 25.83
(0.55) 3 BN
Echel on ( B ) 247.15 (11.4) 89.65 (4.0) 4.57 (0.4) 0.8
(0.07) BN 109.79
(6.5) 17.68 (0.9) (0.13) 1.13 (0.07) 0.56 BTRY 9.81 (0.06) 2.26 (0.5) 0.96 (0.19) 0.42
(0.1) GUN
100 389.8 (11.5) 164.21 (4.7) 28.86 (0.67) 1.42
(0.06) 3 BN 105.19 (5.0) 16.61 (0.58) 0.84 (0.05) 0.4
(0.03) BN 22.69 (1.4) 0.83 (0.07) 0.29 (0.02) 0.17
(0.01) BTRY 5.48 (0.73) 2.24 (0.4) 0.68 (0.16) 0.27
(0.06) GUN
57 278.39 (9.0) 107.55 (3.37) 5.94 (0.15) 0.9
(0.04) 3 BN 58.89 (2.9) 2.26 (0.11) 0.81 (0.08) 0.37
(0.03) BN 4.54 (0.25) 3.21 (0.41) 0.67 (0.09) 0.33
(0.05) BTRY 2.82 (0.31) 1.61 (0.28) 0.52 (0.14) 0.29
(0.08) GUN
40 26.05 (1.1) 1.3 (0.06) 0.43 (0.03) 0.3
(0.03) 3 BN 1.65
(0.14) (0.5) 2.32 (0.18) 0.74 (0.08) 0.35 BN 8.08 (1.54) 0.72 (0.12) 0.52 (0.18) 0.14
(0.02) BTRY 1.44 (0.26) 2.09 (0.62) 0.26 (0.05) 0.14
(0.02) GUN
below avg TM lead time above avg TM lead time
bat-tery (BTRY) could order parts between 57 and 100 cubic inches, and the average lead time would be 22.69 days. Furthermore, if three battalions (BNs) ordered parts between 100 and 250 cubic inches and print speed capability increased 10 times from the current technology, then the average lead time was re-duced from 782.84 to 25.83 days. Given that the initial data set from OIF provided a rough average of lead time, the resulting confidence intervals were determined to be satisfactory.
4 RECOMMENDATIONS
The notion of 3D printed parts needs to start with computer-aided design (CAD) files. The AM technolo-gy is unlikely to be fully realized in a military setting if soldiers are expected to create the part designs. Pressure needs to be placed on contracted suppliers to either create CAD files for existing parts, or at a minimum, to start providing such files with newly purchased equipment. This pressure would be applied many echelons above the soldier level. Sophisticated scanners capable of producing CAD blueprints are a steadily improving technology and provide one viable option to bridge the gap between TM- and AM-produced parts. Still, Army Acquisitions should ensure vendors provide CAD files for parts upon new materiel purchase.
Similar to the Navy, the Army needs to continue experimenting with AM facilities in the field under realistic demand rates and operating environments. The simplest choice is to utilize existing environments at Combined Training Centers (CTCs) and evaluate how an AM facility performs. A pilot program could consist of a 3D printing facility in a hardstand building, with necessary power and environmental condi-tions, at a CTC that receives part requests from actual units in training and then determines how many and what types of parts it can print. This would start to (i) give a feel for utilization rates, maintenance issues, and troubleshooting techniques; and (ii) provide an architecture to route the part requests from the soldier to the 3D printing engineer.
Real-world applications would most likely start with smaller, more specialized combat units that de-ploy to every corner of the globe and are not afforded consistent resupply. These types of units, operating in extreme isolation, could benefit the most from the implementation of a 3D printer given that they had enough raw print materials on hand.
Another application for AM technology would be in the sale of equipment to other countries. Distrib-uted production of 3D printed parts could substantially assist in providing spare parts to countries that have purchased legacy U.S. military equipment. This is a large fiscal requirement because under most cir-cumstances when buyers require additional spare parts, they request those parts through the U.S. Gov-ernment. The resupply then is even more costly because of additional overhead and transportation costs. Imagine that if, along with the initial purchase of the end item, CAD files were provided for all compo-nents. then a third party could furnish all future parts internally, eliminating time and money spent by the U.S. Government.
5 CONCLUSION
There is no denying the potential disruptiveness that AM can have on industries by replacing or at least complementing existing manufacturing techniques, specifically enhancing process and product in-novation (Niaki and Nonino 2017). The U.S. military is currently looking at options to exploit this tech-nology; and with an increased budget, decisions seem to be moving in the right direction. The Navy has implemented FabLabs that consist of a suite of digital fabrication and rapid prototyping machines. These mobile labs educate military members on the capabilities of 3D printing and are an integral step in mak-ing 3D printed parts a reality (Jackson 2017). As for now, the Marines cite examples of printmak-ing Humvee handles and drone rotors to serve as temporary replacements while waiting for actual parts that have been ordered (Jackson 2017). The simulation in this article provides a cogent process to evaluate the effective-ness of integrating additive manufacturing technology in order to complement existing traditional manu-facturing techniques. Table 2 indicates the average lead time for parts no larger than 100 cubic inches for one battery at contemporary print speeds is 22.69 days. As one example, it suggests that current AM tech-nology – a single DMLS printer – can satisfy the demand rate for a deployed mechanized artillery bat-tery’s M109A6 Paladin parts having up to 100 cubic inches in individual part volume, roughly the size of a two-liter soda bottle. In order for AM to have a more compelling and ubiquitous impact, faster build speeds for larger parts is the single point of improvement. Reducing build rate failure is an additional point of focus that will not only enhance lead time reduction, but more importantly, guarantee that printed parts satisfy structural requirements and involve minimal risk when used. Cost reductions of raw materi-als, purchase prices of 3D printers, and personnel requirements will naturally decrease as more competi-tors enter the space and more efficient techniques are discovered for building printers.
DISCLAIMER
The views expressed in this paper are those of the authors and do not reflect the official policy or position of the United States Army, the Department of Defense, or the United States Government.
ACKNOWLEDGMENTS
The authors would like to thank Marc Robbins from the RAND Corporation for providing the dataset that made this research possible as well as the skilled professionals from the Center for Additive Manufactur-ing and Logistics (CAMAL) at NC State for lendManufactur-ing their expertise. We also thank the anonymous re-viewers – their feedback greatly improved the quality of this paper.
REFERENCES
Barno, D., and N. Bensahel. 2017. “Three Things the Army Chief of Staff Wants You to Know.” War on the Rocks. https://warontherocks.com/2017/05/three-things-the-army-chiefof-staff-wants-you-to-know/, accessed August 11th, 2018.
Geer Mountain Software Corp. 2001. Stat::Fit2. South Kent, CT: Geer Mountain Software Corp.
Huang, S., P. Liu, A. Mokasdar, and L. Hou. 2013. “Additive Manufacturing and Its Societal Impact: A Literature Review.” International Journal of Advanced Manufacturing Technology 67:1191–1203. Jackson, B. 2017. “Volkswagen Saves $160K in Tooling Costs Using Desktop FDM 3D Printers.” 3D
Printing Industry. https://3dprintingindustry.com/news/volkswagen-saves$160K-in Tooling Costs- Using Desktop FDM 3D Printers-116640/?goal=0_695d5c73dc-58fd19064d64657453, accessed Au-gust 11th, 2018.
Khajavi, S. H., J. Partanen, and J. Holmström. 2014. “Additive Manufacturing in the Spare Parts Supply Chain.” Computers in Industry 65(1):50–63.
Kim, S.-H., and W. Whitt. 2014. “Are Call Center and Hospital Arrivals Well Modeled by Nonhomoge-neous Poisson Processes?” Manufacturing & Service Operations Management 16(3):464–480. Liu, R., M. E. Kuhl, Y. Liu, and J. R. Wilson. 2018. “Modeling and Simulation of Nonstationary
Non-Poisson Arrival Processes.” INFORMS Journal on Computing, forthcoming.
http://www4.ncsu.edu/~jwilson/files/liu18ijoc.pdf, accessed August 11th, 2018.
McConnell, B. M., T. J. Hodgson, R. E. King, G. H. Parlier, J. R. Wilson, M. G. Kay, K. Thoney-Barletta, and Y. Liu. 2018. “Assessing Uncertainty & Risk in an Expeditionary Military Logistics Network.” Technical Report, Graduate Program in Operations Research, North Carolina State Uni-versity, Raleigh, North Carolina. http://go.ncsu.edu/mlnps_risk, accessed August 11th, 2018.
Moore, T. A. 2018. Evaluating the Augmentation of Army Resupply with Additive Manufacturing in a Deployed Environment. Master’s thesis, Graduate Program in Operations Research, North Carolina State University, Raleigh, North Carolina. http://www.lib.ncsu.edu/resolver/1840.20/34971, accessed August 11th, 2018.
Niaki, M. K., and F. Nonino. 2017. “Impact of Additive Manufacturing on Business Competitiveness: A Multiple Case Study.” Journal of Manufacturing Technology Management 28(1):56–74.
Peltz, E., J. M. Halliday, M. L. Robbins, and K. J. Girardini. 2005. “Sustainment of Army Forces in Op-eration Iraqi Freedom: Battlefield Logistics and Effects on OpOp-erations.” Technical Report, RAND Corporation, Santa Monica, California.
Pomerantz, D. 2018. “Ship Shapes: New 3D Printing Research Aims to Rejuvenate Navy Gear.” GE Re-ports. https://www.ge.com/reports/ship-shapes-new-3d-printing-research-aims-rejuvenate-navy-gear/, accessed August 11th, 2018.
Whitt, W., and X. Zhang. 2015. “A Data-Driven Model of an Emergency Department.” Operations Re-search for Health Care 12:1–15.
AUTHOR BIOGRAPHIES
TIMOTHY A. MOORE is an active duty Captain for the United States Army, Field Artillery. He was a graduate student at North Carolina State University in the Operations Research Graduate Program. His re-search focus is on the U.S. Army’s logistics practices in deployed environments. He works in collabora-tion with NC State’s Center for Additive Manufacturing and Logistics (CAMAL). In 2018, he will begin teaching in the Department of Mathematical Sciences at the United States Military Academy, West Point. His e-mail address is [email protected].
BRANDON M. MCCONNELL is a research scholar at NC State’s Center for Additive Manufacturing and Logistics (CAMAL) and a recent Ph.D. graduate from the Operations Research Graduate Program at North Carolina State University. He served for seven years as an U.S. Army Infantry officer. His re-search interests include military applications in operations rere-search, simulation modeling, and risk analy-sis. His email address is [email protected].