ABSTRACT
PERKINS, JAMES ROBERT. Raman Spectroscopy – in situ Characterization of Growth and Surface Processes. (Under the direction of Robert J. Nemanich.)
The goal of this thesis is to expand on the usefulness of Raman spectroscopy as an in situ probe to aid in the growth and implementation of electronic, optical, and biodetection materials. We accomplish this goal by developing two diverse optical characterization projects. In the first project, an autoclave similar to those used in solvothermal growth which has been outfitted with an optical window is used to collect vibrational spectra of solvents and mineralizers commonly used in the ammonothermal growth of gallium nitride. Secondly, novel silver nanowires created by ferroelectric lithography are evaluated by surface enhanced micro-Raman spectroscopy for use as surface enhanced substrates for low detection limit or single molecule bio-detectors.
Raman spectroscopy is already a widely accepted method to characterize and identify a wide variety of materials. Vibrational spectra can yield much information on the presence of chemical species as well as information regarding the phase and interactive properties. Because Raman spectroscopy is a generally non-intrusive technique it is ideal for analysis of hazardous or far-from-ambient liquids, gases, or solids. This technique is used in situ to characterize crystal growth and surface enhanced photochemistry.
substrates for SERS detection. These techniques, however, lack control over shape, size, and position of the metal nanoparticles which leave them reliant on hotspots. Because of the potential for control of the position of aggregates, ferroelectric lithographically created silver nanowires are evaluated as a potential SERS substrate using pyridine, benzoic acid, and Rhodamine 6g. Surface enhancement from these samples varies periodically as excitation light is scanned perpendicular to the wires. The periodicity, however, has the frequency of the positive domains where carbon laser damage is preferentially created.
Raman Spectroscopy – in situ Characterization of Growth and Surface Processes by
James Robert Perkins
A dissertation submitted to the Graduate Faculty of North Carolina State University
in partial fulfillment of the requirements for the degree of
Doctor of Philosophy
Physics
Raleigh, North Carolina 2007
APPROVED BY:
_________________________________ _________________________________ Dr. Robert J. Nemanich Dr. Zlatko Sitar
Co-Chair of Advisory Committee Co-Chair of Advisory Committee
_________________________________ _________________________________ Dr. J. E. (Jack) Rowe Dr. Dave E. Aspnes
DEDICATION
To my Parents, Rick and Jenny,
BIOGRAPHY
ACKNOWLEDGEMENTS
TABLE OF CONTENTS
List of Figures vi
1. Introduction 1
1.1 Fundamentals of Raman Spectroscopy 1
1.2 Surface Enhanced Raman Scattering 7
References 9
2. Raman Spectroscopy of Solvents and Mineralizers Used in Solvothermal
Growth 14
2.1 Introduction 15
2.2 Experimental 17
2.3 Results and Discussion 20
2.3.1 UV Raman of Supercritical Water 20
2.3.2 UV Raman of Supercritical Ammonia 22
2.3.3 Visible Raman of Supercritical Ammonia 24 2.3.4 Visible Raman of Sodium Azide in Ammonia 26
2.4 Conclusions 29
References 30
3. Surface Enhanced Raman Spectroscopy of Silver Nanostructures grown by
Ferroelectric Lithography 50
3.1 Introduction 51
3.2 Experimental 53
3.3 Results and Discussion 55
3.3.1 Spatial Periodic Surface Enhancement from
Silver on PPLN 55
3.3.2 Laser Damage 57
3.4 Conclusions 61
References 63
4. Epilogue 77
4.1 Ammonthermal Future Work 77
LIST OF FIGURES
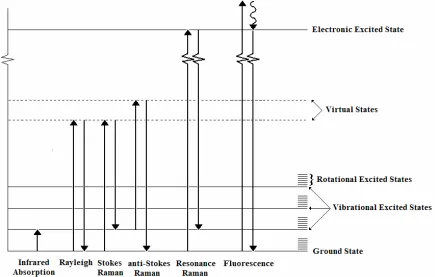
Figure 1.1 Schematic of the quantized vibrational, rotational, and electronic energy
levels of a molecule 11
Figure 1.2 Demonstration of the Raman selection rules for linear and non-linear
A-B-A molecules 12
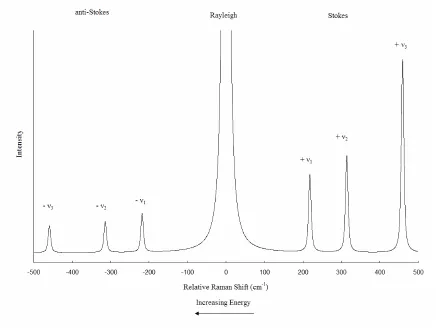
Figure 1.3 Schematic of the Rayleigh, Stokes Raman, and anti-Stokes Raman
vibrational modes of CCl4 13
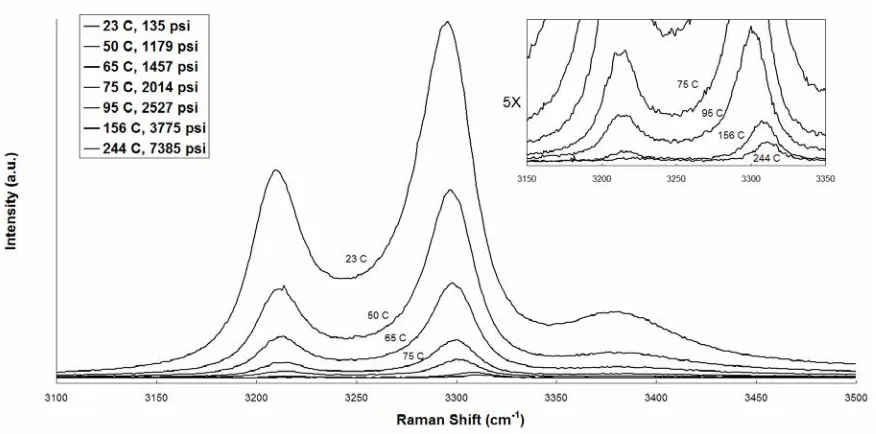
Figure 2.1 Schematic of the high temperature, high pressure autoclave 32 Figure 2.2 UV Raman scattering from supercritical water 33 Figure 2.3 Temperature-pressure relationship for supercritical water 34 Figure 2.4 νmax and FWHM of the O-H stretch of supercrtical water 35 Figure 2.5 UV Raman of liquid ammonia at 20 C and 135 psi 36 Figure 2.6 UV Raman of ammonia between 23 and 244 C and 135 to
7300 psi 37
Figure 2.7 Temperature-pressure relationship for supercritical ammonia 38 Figure 2.8 Log ammonia ν1 molar intensity vs. temperature 39 Figure 2.9 Visible Raman of supercritical ammonia to 350 C and 13 kpsi 40 Figure 2.10 ν1,max and FWHM of the N-H stretch of supercrtical ammonia 41 Figure 2.11 Temperature dependence of anharmonic force constant, K144 42 Figure 2.12 Intensity of NH3 ν1 band as a function of pressure 43 Figure 2.13 Raman spectra of solid and solvated NaN3 44 Figure 2.14 Temperature and pressure changes in time during azide
decomposition 45
Figure 2.15 Azide and nitrogen Raman intensity and pressure vs. time 46 Figure 2.16 Schematic of location of precipitates after autoclave evacuation 47 Figure 2.17 Temperature dependence of K144 in azide-ammonia system 48 Figure 2.18 Temperature-pressure relationship for azide-ammonia system 49
Figure 3.1 Schematic of micro-Raman sampling stage 65
Figure 3.2 AFM and PFM of silver nanowires created by ferroelectric
lithography 66
Figure 3.3 AFM height profile of selective deposition on domain boundary
and positive domain 67
Figure 3.4 SERS of 10-4 M pyridine on lithium niobate 68 Figure 3.5 Spatially periodic enhancement of pyridine ring breathing mode
intensity 69
Figure 3.6 AFM and PFM of laser damaged region 70
Figure 3.7 SEM of silver nanowires on lithium niobate 71 Figure 3.8 Auger spectroscopy of lithium niobate with silver nanowires 72 Figure 3.9 Scanning auger microscopy on silver nanowires on PPLN 73
Figure 3.10 SERS of laser damaged region 74
1. Introduction
Raman Spectroscopy is a staple of the modern laboratory. The theory is easy to
understand, the equipment is simple and relatively inexpensive, the information gleaned
from the technique is invaluable, and the technique is extremely versatile. The goal of this
study is to expand on the versatility of Raman spectroscopy by citing two diverse studies.
Each of the chapters in the work outlines a current topic of interest which is still growing.
Raman spectroscopy can help these topics not only in understanding but in commercial
success.
1.1 Fundamentals of Raman Spectroscopy
Since the prediction of inelastic light scattering by A. Smekal 1 in 1923 through the first observation of Raman scattering by C. V. Raman and K. S. Krishnan 2 in 1928 to the present, the technique of Raman Spectroscopy continues to develop and prove to be a
staple of materials characterization techniques. As a versatile, non-intrusive probe of the
vibrational and rotational spectra of molecules, Raman Spectroscopy is an invaluable
method for identification of materials and a probe of the phase and intra- and
intermolecular properties.
This chapter discusses many of the basic properties and principles of the Raman
scattering phenomenon and advantages and limitations of Raman spectroscopy. A
classical derivation of inelastic light scattering illustrates the frequency dependence of
Raman Spectroscopy are outlined and special techniques are briefly discussed. In the
second half of the chapter, one of these special techniques, Surface Enhanced Raman
Spectroscopy, is discussed in detail.
Within the quantum mechanical description of Raman scattering, the photon
interacts with material to change its vibrational and/or rotational state. For scattering from
a solid, this interaction may be understood as the creation or annihilation of a phonon, a
quantized vibration of atoms in a rigid crystal lattice. The incident light excites the
material to a virtual, disallowed state. The scattered photon’s energy can be divided into
three possible categories, greater than, less than, or equal to the incident energy. These
changes in energy of the photon are identical to the differences in energy of the initial and
final vibrational states as is illustrated in Figure 2.1. The elastically scattered light is
usually termed the Rayleigh scattered light. That which has lost energy (and thereby raised
the vibrational state of the molecule or created a phonon) is denoted as the Stokes shifted
light. Light which has gained energy (and lowered the vibrational state of the molecule or
annihilated a phonon) is the Anti-Stokes shifted light.
In order to better demonstrate frequency dependence of Raman scattering using
classical electromagnetic theory, imagine a space fixed N atom molecule as classical
oscillator with 3N-6 (3N-5 for linear molecules) normal modes of vibration. Each mode,
with normal coordinate, qi, can be viewed as a classical oscillation with frequency νi,
determined by nuclear coordinates and bond force constants
(
t)
q
qi = i0cos2πνi
The electric field of the incident light, E, will induce a polarization, P, in the
the wavelength of the incident light is much larger than the molecule so that the electric
field is approximately constant over the whole molecule at a given time.
Expanding the polarizability in a Taylor series about the nuclear displacements, ,
and asserting the approximation that the amplitude of vibration, , is small so that higher
order terms can be dropped yields a polarization caused by an electric field, E,
i q 0 q E q q E P i i ⎥ ⎥ ⎦ ⎤ ⎢ ⎢ ⎣ ⎡ ⎟⎟ ⎠ ⎞ ⎜⎜ ⎝ ⎛ ∂ ∂ + ≈ = 0 0 α α α .
Adding the time dependence of the incident electric field of light of frequency ν0
(
t)
E
E = 0cos 2πν0
yields
(
)
E q(
t) (
tq E P i i πν πν α πν
α cos 2 0 0cos 2 0 cos 2
0 0 0 0 ⎟⎟ ⎠ ⎞ ⎜⎜ ⎝ ⎛ ∂ ∂ + =
)
(
)
E q{
[
(
)
t]
[
(
)
t]
}
q
E i i
i ν ν π ν ν π α πν α ⎟⎟ − + + ⎠ ⎞ ⎜⎜ ⎝ ⎛ ∂ ∂ +
= 0 0 0 0
0 0
0
0 cos2 cos2
2 1 2
cos
This represents an oscillating dipole which will radiate electromagnetic energy at three
frequencies. The term with unchanged frequency ν0 represents the Rayleigh scattering
component. The other two terms account for the Stokes Raman scattering of frequency
(
ν0 −νi)
, and anti-Stokes Raman scattering of frequency(
ν0 +νi)
.Even this simple, classical derivation illustrates many facts about Raman scattering
besides the frequency dependence. The Raman scattering amplitude is proportional to the
derivative of the polarizability with normal coordinate. This condition illustrates the
respect to the normal coordinate of vibration evaluated at the equilibrium position is zero,
then that vibration is normally not Raman active. For example, consider the linear and
non-linear A-B-A molecules depicted in Figure 2.2. The q1 mode of the linear molecule
and all three modes of non-linear molecule will be Raman active. Because we assumed
mechanical and electrical harmonicity, this classical derivation does not predict overtones
and combination tones. However, this assumption is too restrictive and in general
overtones and combination tones are present albeit typically much weaker than the
fundamental modes. Fermi resonance between overtones, combination tones, or
fundamentals tends to increase the intensity of both resonant modes and shift their energies
toward each other.
Although scattering cross sections depend on many factors and can vary by several
orders of magnitude, the Rayleigh scattered light is typically a thousand times less intense
than the incident radiation, and the Stokes Raman scattered light is again a thousand times
less intense than the Rayleigh. The intensity ratio between the Stokes and Anti-Stokes
scattering events is a Boltzmann distribution function of the temperature and is
proportional to the probability of finding the molecule in an excited vibrational state at a
given temperature. Figure 2.3 shows a schematic of the Stokes, anti-Stokes and Rayleigh
lines of CCl4 spectrum to demonstrate the relative intensities of these bands. The
scattering cross section, Ω
d dσ
, of an oscillating dipole is given by 3 θ ν π σ 2 2 0 2 0 4 2 sin E c P d d d d incident = Ι Ω Φ = Ω .
Inserting the quantum mechanical polarization transition moments 4 into P0 yields a
number of molecules in the sampling area, and the fourth power of the frequency,
(
)
40 νif
ν ±
(
)
4( )
20 2 2 3 64 if if incident c
I = π Ι ν ±ν Να
where
( )
αif2 are the squares of the polarizability transition moments which depend onscattering and collection geometries and the polarizability of the molecule. These
polarizability transition moments are complex and require full knowledge of the
wavefunctions of all electronic and vibrational states of the molecule. However, by
evaluating the symmetries of these wavefunctions, Group theory can predict the
polarization dependencies of the vibrational energy levels and selection rules for molecules
or crystals. 5
Because it is applicable to materials in solid, liquid, and vapor phases, the
applications of Raman spectroscopy span several fields. The most obvious is the
non-intrusive identification of organic and inorganic species for which the unique, vibrational
‘fingerprint’ of the molecule is known. Because the Raman scattering intensity is
proportional to the number of molecules in the sampling area relative concentrations of
solutes can be learned. If special care is taken and the Raman scattering cross sections are
known then absolute concentrations and densities are derivable. 6 The inverse application in structural chemistry is of course also possible; Raman spectra and polarization analysis
(or orientation dependence of scattering intensities in crystalline structures) can be used to
pressure, stress, and environment on a molecule or solid is gained by measuring the
changes in shape, energy, and intensity of Raman bands.3
Special Raman techniques continue to develop which are tailored to the particular
applications. Many of these new techniques are possible due to the continuing
improvement of laser sources, focusing and collection optics, high resolution wavelength
dispersers, and sensitive detectors. Resonance Raman Spectroscopy and Coherent
anti-Stokes Spectroscopy are made possible in a variety of samples by the invention of tunable
IR and visible lasers. Raman microscopy and imaging are the result of quick Charged
Coupled Device (CCD) detectors and the use of a microscope as a sampling device.
The Resonance Raman effect is important because of its possible implications in
Surface Enhanced Raman Spectroscopy. 7 Resonance Raman occurs when the excitation energy is close or equal to an electronic excited state. Resonance Raman cross sections
can be as much as five orders of magnitude larger than non-resonant cross sections. The
first order perturbation of the transition polarizability tensor component is given by 8
[ ]
∑
⎟⎟ ⎠ ⎞ ⎜⎜ ⎝ ⎛ Γ − − + Γ − − =R RF R
x y R GR x y FG xy i R P F G P R i G P R R P F 0 0 1 ω ω ω ω α h t
where F and G are the final and initial (ground) state and Γis the band width of the
electronic state (the damping constant). As the laser frequency, ω0 , approaches one of the
electronic excited frequencies, ωGR =ωG −ωR, the first term in the summation will
become resonant. Resonant Raman spectroscopy can be used for low concentration
The Resonance Raman effect also plays a role in Surface Enhanced Raman scattering
which is discussed in detail in the next section.
1.2 Surface Enhanced Raman Scattering
While studying Raman scattering of pyridine adsorbed on electrochemically
roughened silver surfaces in 1974, Fleischmann et al. 9 observed an anomalously large scattering cross section. Since this discovery the field of Surface Enhanced Raman
Scattering (SERS) has blossomed to include a variety of substrates and hundreds of
adsorbates. Because Raman scattering cross sections are small, SERS has made possible
detection of Raman signals that were thought to be much too weak to observe including
sub-monolayer and single molecule detection. While much progress has been made in
understanding and taking advantage of this phenomenon, some controversy still exists over
the mechanism of enhancement and improvement of substrates is necessary for this
technique to move beyond the laboratory.
Two mechanisms, which are likely to both contribute to the effect, are at the root of
the theory of surface enhancement. The first is an electromagnetic enhancement of the
electric field near sub-wavelength conducting structures caused by surface plasmon
resonance. The second, thought to be the weaker effect, is an induced charge transfer
complex between the adsorbate and metal which can enhance Raman scattering intensity
through the Resonance Raman effect.
The electromagnetic effect relies on two factors 1) exciting with a wavelength that
surface plasmon to radiate electromagnetic energy. The surface plasmon resonance will be
a function of not only the electronic properties of the metallic surface but also of the
surface rougness. Near a metal surface of nanoscale roughness the incident electric field of
the laser can excite a surface plasmon which can radiate electromagnetic energy in the near
field that is many times stronger than incident field. If an adsorbate is on or near this
surface, the enhanced field will increase the Raman scattered intensity by the same factor.
In fact, the Raman scattered fields will also be enhanced by the surface in the same manor
as the incident field. This secondary enhancement is applicable because Raman shifts are
typically smaller than the plasmon resonance envelope.
Consider the polarizability of a small (sub-wavelength) metal sphere 10
( )
30 0 2 )
(ω ε R ε ε ω ε α + − = .
The plasmon resonance frequency, ωR will satisfy the equation 7
( )
2 0Re
0= ε ωR + ε
and will have an enhancement factor proportional to Imε
( )
ωR −4. This is only aninstructive example, however, because actual SERS measurements are almost always made
from aggregates of nanoparticles or surfaces with nanoscale roughness. Between
nanoparticles the induced charges caused by the incident field can create a capacitive field
which increases as the inter-particle distance decreases, especially in cases where the
incident light is polarized along the interpaticle axis. 11
The dependence of plasmon resonance on the real and imaginary parts of the
wavelength dependent dielectric constant makes certain metals such as silver, gold, and
wavelength depending on the size, shape, and substrate material. Although roughness
features can be created by a number of methods there is a theoretical limit on the size of
the features ranging from approximately 5 to 100 nm. 10
References
1) A. Smekal, Naturwissenschaften, 11, 873 (1923).
2) C. V. Raman and K. S. Krishanan, Nature, 121, 501, (1928).
3) D.A. Long, Raman Spectroscopy (McGraw-Hill Inc., London, 1977).
4) L. A. Woodward, in Raman Spectroscopy: Theory and Practice, edited by H. A.
Szymanski (Plenum Press, New York, 1967) p.1.
5) G. Herzberg, Molecular Spectra and Molecular Structure: II. Infrared and Raman
Spectra (D. Van Nostrand Company Inc., Princeton NJ, 1945).
6) H. W. Schrotter and H. W. Klockner, in Raman Spectroscopy of Gases and Liquids,
edited by A. Weber (Springer –Verlag, Berlin, 1979) p.123.
7) H. Metiu, in Surface Enhanced Raman Scattering, edited by R. K. Chang and T.E.
Furtak (Plenum Press, New York, 1982) p.1.
8) D.L. Rousseau, J.M. Friedman, and P.F. Williams, in Raman Spectroscopy of
Gases and Liquids, edited by A. Weber (Springer –Verlag, Berlin, 1979) p.203.
9) M. Fleischman, P.J. Hendra, and A.J. McQuillan, Chem. Phys. Lett. 26, 123
10) M. Moskovits, in Surface Enhanced Raman Scattering: Physics and Applications,
edited by K. Kneipp, M. Moskovits, H. Kneipp (Springer-Verlag, Berlin, 2006) p.1.
11) P.K. Aravind, A. Nitzan, H. Metiu: Surf. Sci. 110, 189 (1981)
Figure 2.1 Schematic of the quantized vibrational, rotational, and electronic
Figure 2.2 Demonstration of the Raman Selection Rules for linear and non-linear
A-B-A molecules. For the q3 and doubly degenerate q2 modes of the linear
molecule, the derivative of the polarizability, α, with respect normal
coordinate, qi, at equilibrium will be zero, and those modes are therefore
Figure 2.3 Schematic of the Rayleigh, Stokes Raman, and anti-Stokes Raman
2. UV and Visible Raman Spectroscopy of Solvents
and Mineralizers Used in Solvothermal Growth
ABSTRACT
2.1 Introduction
Gallium nitride and its alloys are important materials for electronic and elctro-optical devices such as laser diodes, light emitting diodes, 1 and transistors.2 Most current GaN devices are created on sapphire or SiC substrates. The lattice mismatch between the nitride and substrate causes defects which limit the performance and lifetime of these devices.3 There is therefore a need for bulk single crystal gallium nitride substrates.
Because of the high melting temperature and dissociation pressure of GaN, bulk crystals are difficult to grow. 4 One promising method of achieving bulk growth is the ammonothermal process where supercritical ammonia is used as a solvent. 5 Supercritical solvents are advantageous because they provide increased and adjustable solubility of reaction products, display transport properties similar to those of the gas phase, and can often increase reaction rates.6
Raman spectroscopy is an ideal tool to analyze this system in situ by identifying reactants, providing relative concentrations, and shedding light on solubility and transport properties.6
2.2 Experimental
A high pressure autoclave with an optical window was designed and built specifically for these studies and is shown schematically in Figure 2.1 The autoclave body and window housing were constructed from Inconel Alloy 718 which was chosen for its low iron content and thermal and mechanical durability. Cylindrical sapphire windows were used due to their hardness, chemical inertness, strength, and optical transmission in the UV and visible. The sapphire windows were brazed into the inconel housings using a silver active braze alloy. Initial experiments showed that gold braze alloys showed significant weight loss in ammonia at elevated temperatures which led to using silver braze joints. For fills containing sodium azide, the silver braze joints were nickel plated because silver showed signs of deterioration possibly due to the formation of silver azide. Autoclave Engineers High Pressure Series tubing, fittings, fill valve, safety relief valve, and pressure detector were connected to the autoclave by a custom inconel adaptor. The total internal volume of the autoclave was 10.4 ml while the plumbing volume was only 3.2 ml.
autoclave, measured temperatures (and those reported here) overestimate the temperature of the sampled ammonia. Pressure measurements were consistently lower than expected due possibly to the effect of heating the strain gauge.
The autoclave was filled by condensing liquid NH3 into the autoclave which was submersed in a dry ice/isopropanol bath at approximately -78 ºC. A mass flow controller measured the amount of ammonia added. For fills with sodium azide, a measured amount of powder azide is put in the cell before it is sealed and evacuated. Fill percents used in this paper are determined by the formula,
V m fill ammonia ρ = %
where ρ is the density of liquid ammonia at -78 C and 20 psi (these fill percents do not take into account the volume displaced by sodium azide when it was used).
2.3 Results and Discussion
2.3.1
UV Raman of Supercritical Water
Our study began with water instead of ammonia for several reasons, namely that it was easier and safer to fill, and it was possible to achieve high densities. UV excitation was chosen because of the dependence on Raman scattering intensity. As hydrogen bonded liquids, ammonia and water share many characteristics and therefore water made an ideal substance to test and calibrate the system. They also have similar thermodynamic properties; the critical point of water is 374 ºC and 3200 psi while that of ammonia is 132 ºC and 1643 psi.
4
ν
Water molecules belong to the C2ν space group which normally has three Raman
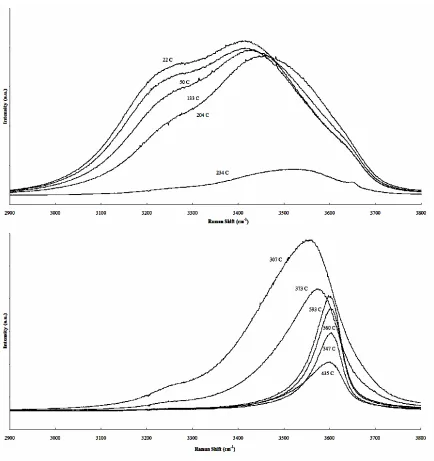
fit was unsuitable for our spectra and only the peak position, νmax , and full width at half maximum (FWHM) of the entire band were considered.12 As the temperature and pressure increase, the position of the maximum increases while the half width decreases. Both of these effects are related to reduction in the amount of hydrogen bonding. 12 These shifts are shown graphically in Figure 2.4 in a manner similar to that of Ikushima et al.12 Between 200 and 300 ºC, both of these factors change rapidly. This corresponds to the temperature range over which the density of the liquid begins to increase rapidly. Under isobaric conditions, Ikushima et al. observed the greatest rate of change in half-width and νmax at the critical temperature.
The intensity of broad liquid water band decreases suddenly at 234 ºC due to the level of water in the cell falling below the laser sampling area. The unperturbed steam, H2O ν1 monomer, peak at 3657 cm-1 can be seen as a shoulder at this temperature. Note that the intensity scales between the top and bottom graphs are not the same but that the general trend is decreasing intensity with increasing temperature.
2.3.2
UV Raman of Supercritical Ammonia
Ammonia belongs to the C3ν space group which has four Raman active modes. The
UV Raman spectrum of liquid ammonia at room temperature is shown in Figure 2.5. At room temperature, all four modes can be observed. Additionally, the 2nd overtone of the doubly degenerate ν4 asymmetric bending mode is relatively intense at all temperatures and pressures due to being in Fermi Resonance with ν1 symmetric stretch.15 Fermi resonance tends to increase the scattering cross section of both modes as well as shift their frequencies toward their average. The ν1 symmetric stretch region of ammonia is also broadened by hydrogen bonded ammonia dimers similar to the ν1 symmetric stretch region of water.16 Also similar to water, above standard temperatures and pressures, the intensities of the ν2, ν3, and ν4 modes decrease rapidly with increasing temperature making the N-H stretch region of the most interest in this study. The ν1 and 2ν4 modes of NH3 should remain strong scatterers and are easily observed at supercritical conditions with visible excitation.17
2.3.3
Visible Raman of Supercritical Ammonia
Figure 3.9 shows visible Raman of the ammonia symmetric stretch region over three different temperature regions. These spectra compare favorably to previous Raman studies on supercritical ammonia. 4 Several factors, which are well documented for condensed ammonia in the isobaric and isothermal system, are monitored in the neat, isochoric cell for comparison with the system with solute included in the cell. These factors include thermodynamic sensitivity of hydrogen bonding, the degree of Fermi resonance between the ν1 and 2ν4 bands, and the pyramidal deformation of the NH3 molecule.
Similar to the water spectrum, the amount of hydrogen bonding can be seen in the width and blue-shift of the ν1 region. In water the hydrogen bonding network is more complex, and so the width and position are stronger functions of temperature and density in the water system. In Figure 2.10, the position and width of the ammonia ν1 are plotted as a function of temperature in the same fashion of the water spectrum in Figure 2.4.
The degree of Fermi resonance between the ν1 and 2ν4 is measured by the strength of the anharmonic force constant, K144.19 It has been shown that the degree of Fermi resonance decreases with temperature due to the shift of ν1 toward the unperturbed vapor frequency. The anharmonic force constant can be calculated by the formula
(
1)
2
144 =∆ R R+
where R is the ratio of intensity of the ν1 and 2 ν4 peaks and ∆ is the frequency separation of the Fermi doublet components. In Figure 2.11 values of K144 are evaluated for a 65% NH3 fill and are compared to tabulated data from previous authors.19
2.3.4
Visible Raman of Ammonia/Sodium Azide
NaN3 was chosen as a mineralizer for a number of reasons: 1) it is readily soluble in NH3 at ambient temperatures, 2) it is less reactive than NaNH2 and can be handled and filled without the need for a glove box (for growth, this also means less incorporated O2 and H2O), 3) it has a lower decomposition temperature than KN3 and could therefore be observed at temperatures that would allow the window to survive. Growth runs have utilized potassium amides and azides more than their sodium counterparts due to the fact that KNH2 is much more soluble than NaNH2.9 Figure 2.13 shows the Raman spectrum of solid sodium azide and azide dissolved in NH3 at two temperatures. The two features in the spectra of azide in solution correspond to the solvated (1328 cm-1) and free (1320 cm-1 at room temperature, 1355 cm-1 at 275 ºC) ν1 modes. The “free” mode is highly temperature dependent and quickly moves to higher wavenumbers as the temperature increases. 20
At moderate temperatures the azide was completely undetectable by Raman, this may be due to the increase in sapphire fluorescence over this temperature range. At high temperatures, the azide Raman signal is again detectable.
Above 295 ºC, the pressure in the cell slowly increases at constant temperature. The azide is known to decompose at 275 ºC according to the formula9
NaN3 → Na + N2.
Figure 2.14 shows the changes in temperature and pressure over time near the decomposition temperature.
Above 275 ºC, N2 can be detected in the cell. The intensity of the N2 line at 2326 cm-1 increases slowly until 300 ºC was reached. This increase in N2 signal is attributed to concentration increases as the aforementioned reactions proceed. The azide signal also decreases as the reaction proceeds as expected. Figure 2.15 shows the pressure and N2 and N3- Raman signal intensities as functions of time, at a constant temperature of 300 ºC. The rate of decline of the azide Raman signal presumably indicates the progression of the reaction. Assuming that the azide Raman signal is independent of pressure, we can conclude the reaction rate increases with increasing pressure. Spectra obtained from 4000 to 5000 cm-1 did not show the H2 Raman signal. Hydrogen is produced at one third the rate of N2 and, even though it has a larger scattering cross section, it is less soluble in NH3. After the reaction had completed, and the cell cooled to room temperature a large overpressure of N2 (or H2) remained in the cell. Evacuating and opening the autoclave revealed a hard white solid on the side of the autoclave. The autoclave is filled and evacuated in a vertical position, but spectroscopy and heating occur while the cell is oriented horizontally as is shown schematically in Figure 3.16. This white solid, therefore, came out of solution during the spectroscopy measurements, either when the cell was cooled to room temperature or possibly as it was formed at elevated temperatures.
The NaNH2 signal was not detected during the spectroscopy measurement. This is attributed to one of two factors (or both): 1) NaNH2 is only sparingly soluble in NH3 even at elevated temperatures and may have precipitated out of the sampled solution, 2) the Raman spectrum of NH2 will have its strongest bands in the same region as the NH3 N-H stretch which may obscure by the NH2 signal.
2.4 Conclusions
The specially designed autoclave and window withstood temperatures and pressures used in the dissolution zone of ammonothermal GaN synthesis. The Raman spectra of relevent process gasses and reactants have been detected at supercritical temperatures. Also the Raman spectrum of neat supercritical ammonia at several fill percents has been collected. Measurement of neat ammonia spectra as a function of temperature and pressure will prove as an important baseline to determine solvent-solute effects which can affect transport and chemical properties. Several improvements (outlined in Chapter 4) will be required in order for the window to survive temperatures used in the crystallization zone of ammonothermal growth (~600 ºC). Raman detection of dissolution of Ga feedstock and amide mineralizer will hopefully permit identification of the soluble intermediate(s).
References
1) S. Nakamura, S. Pearton, and G. Fasol, The Blue Laser Diode: The Complete Story
(Springer-Verlag, Berlin, 1997).
2) M. A. Khan et al., Applied Physics Letters, 62, 1786 (1993).
3) L. Liu and J. H. Edgar, Materials Science & Engineering R-Reports, 37, 61 (2002). 4) S. Pendurti, Q. S. Chen, and V. Prasad, Journal of Crystal Growth, 296, 150 (2006). 5) A. Yoshikawa, E. Ohshima, et al., Journal of Crystal Growth, 260, 67 (2004). 6) P. G. Jessop and Walter Leitner, Chemical Synthesis Using Supercritical Fluids
(Wiley-VCH, New York, 1999).
7) D.R. Ketchum and J.W. Kolis, Journal of Crystal Growth, 222, 431 (2001).
8) B. Wang, M.J. Callahan, J. W. Kolis et al., Journal of Crystal Growth, 287, 376 (2006).
9) B. Wang and M.J. Callahan, Crystal Growth and Design, 6, 1227 (2006).
10) J. W. Lundeen and W. H. Koehler, The Journal of Physical Chemistry, 79, 2957 (1975).
11) M. Schwartz and C. H. Wang, The Journal of Chemical Physics, 59, 5258 (1973). 12) Y. Ikushima, K. Hatakeda, N. Saito, M, Arai, Journal of Chemical Physics, 108,
5885 (1998).
13) D.M. Carey and G. M. Korenowski, Journal of Chemical Physics, 108, 2669
(1998).
14) H.E. Stanley, Introduction to Phase Transitions and Critical Phenomena,
15) W.H. Koehler et al., The Journal of Physical Chemistry, 83, 3264 (1979).
16) T. Ujike and Y. Tominaga, Journal of Raman Spectroscopy, 23, 485 (2002).
17) M. Buback and K.R. Schulz, The Journal of Physical Chemistry, 80, 2478 (1976).
18) J. Mellqvist and A. Rosen, J. Quant. Spectsoc. Radiat. Transfer, 56, 187 (1996).
19) J. F. Bertran and B. La Serna, Journal of Molecular Structure, 56, 283 (1979).
20) P. Gans and J. B. Gill, Faraday Discussion, 64, 150 (1977).
Figure 2.2 UV Raman scattering from supercritical water.
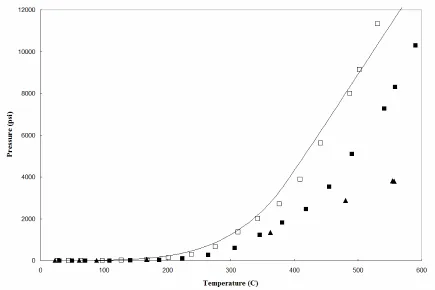
Figure 2.3 Temperature-pressure relationship for supercritical water.
Figure 2.4 νmax and FWHM of the O-H stretch of supercrtical water.
Figure 2.7 Temperature-pressure relationship for supercritical ammonia.
Figure 2.8 Log ammonia ν1 molar intensity vs. temperature
Figure 2.10 ν1,max and FWHM of the N-H stretch of supercrtical ammonia.
Figure 2.11 Temperature dependence of anharmonic force constant, K144.
Figure 2.12 Intensity of NH3 ν1 band as a function of pressure.
Figure 2.13 Raman spectra of solid and solvated NaN3.
Figure 2.15 Azide and nitrogen Raman intensity and pressure vs. time.
Figure 2.16 Schematic of location of precipitates after autoclave evacuation.
Figure 2.17 Temperature dependence of K144 in azide-ammonia system.
Anharmonic force constants, K144, are plotted as a function of temperature for a 65% ammonia fill (□) and for a 60% ammonia fill with 0.5 M NaN3 (∆)
0 2000 4000 6000 8000 10000 12000 14000 16000
0 50 100 150 200 250 300 350 400 450
Temperature (C)
Pr
essu
re (p
si
)
Figure 2.18 Temperature-pressure relationship for azide-ammonia system.
3. Surface Enhanced Raman Spectroscopy of Silver
Nanostructures Grown by Ferroelectric Lithography
ABSTRACT
Silver nanowires created by photoreduction of silver nitrate on periodically poled lithium
niobate substrates are evaluated for use in Surface Enhanced Raman Spectroscopy (SERS).
SERS increases scattering intensities by factors of 106 or more enabling submonolayer or
even single molecule detection. The technique relies on a suitably roughened silver
surface to excite surface plasmon resonance. Many current SERS substrates suffer from
lack of reproducibility, and ferroelectric lithographic control over silver nanoparticle
position, shape, and size could help overcome this deficiency. With this technique, silver
selectively deposits on domain boundaries forming nanowires with roughness features on
the order of 10-100 nm which is appropriate for SERS with visible excitation. In this
study, pyridine, benzoic acid, and Rhodamine 6g are used as analytes. Spatially periodic
enhancement factors are observed as the laser spot is moved perpendicular to the wires;
however, the periodicity has the frequency of the domains not that of the wires. Laser
induced photographitization occurs on positive domains and forms a SERS active carbon
layer which obscures the enhancement from the wires. Scanning Auger Microscopy
(SAM) shows that a small amount of silver normally undetected by Atomic Force
3.1 Introduction
Surface enhanced Raman spectroscopy (SERS) has had a revival in popularity
recently due to its possible use in biodetection and single molecule spectroscopy SERS. 1
The increased enhancement factor due to interparticle interaction allows detection of
submonolayer or single molecule detection.2 In order to avoid reliance on hot spots, control
over nanoparticle shape, size, and location must be achieved. Ferroelectric lithography
offers this control and nanowires created by this technique are evaluated in this study as
SERS substrates.
Early on in the development of the SERS mechanism, Creighton et al. observed
that the maximum enhancement factors were attained at the wavelength that corresponded
to the maximum of the extinction spectrum.3 The extinction spectrum is the addition of the
scattered and absorbed and is given by Mie theory.4 Below the Rayleigh limit (R=λ/20)
the extinction spectrum is not a strong function of particle size, but above this limit, the
extinction maximum increases with particle size. In order to achieve highest enhancement
factors, the surface plasmon resonance must be optimally excited which requires
coordination of the size of the particle and excitation wavelength. For visible excitation
this corresponds to silver nanospheres with radius 30 to 90 nm.3 The shape of the
nanoparticles also affects the optimal excitation wavelength and can add to the
enhancement factor by the so called “lightning rod effect.” 5
Substrate materials have ranged from the alkali metals6 to Al7 to In8, but the
coinage metals, Ag, Au, and Cu, display the greatest enhancement factors.9 Silver, in
frequency.10 The low plasma frequency and small imaginary component of the dielectric
constant create a sharp, intense resonance ideal for SERS. Also, the position of the
extinction band maximum will be a function of the real component of the dielectric
function of the substrate material. It was shown in Chapter 1 that for nanospheres,
plasmon resonance occurs when
( )
2 0Reε ωR =− ε .
This condition is met for silver in the visible range.3
Capacitive field effects of nanoparticle arrays can further increase enhancement
factors by five orders of magnitude.11 When the interparticle spacing is on the same order
of magnitude as the particle diameter, interparticle interactions can strongly affect the
optical response, especially when the incident electric field is polarized in the direction of
the interparticle seperation.1 Zhao et al.12 showed that the resonance was optimally tuned
for interparticle separation, D, and particle radius, R when
D/(2R)=5.
Silver nanowires created in this study by ferroelectric lithography exhibit
roughness features and particle sizes13 that are appropriate to surface enhancement with
3.2 Experimental
Periodically poled lithium niobate (PPLN) substrates measuring 0.5 mm square
were purchased from Crystal Technologies. The samples were cleaned by ultrasonication
in acetone and methanol each for 20 minutes. PPLN samples were reused after silver
deposition and SERS analysis. AFM and XPS confirmed all silver was removed by
sonication.
Silver was deposited on the samples by photoreduction of silver nitrate. One drop
of 0.01 M aqueous sodium nitrate was placed on the cleaned sample. The sample was
illuminated by an Oriel Instruments Hg lamp. The primary line of the the Hg emission
spectrum is at 254 nm which is above the band gap of lithium niobate. Illumination times
ranged from 30 seconds to 15 minutes, however reported results are from 3 minute
illumination times unless otherwise noted. After deposition, samples were rinsed in
deionized water and blown dry with forced nitrogen. Atomic force and piezoresponse
force microscopy (AFM and PFM respectively) data were recorded by a Park Scientific
Instruments Model Autoprobe M5.
For SERS analysis, samples were mounted on a specially prepared microscope
slide shown in Figure 3.1. A small drop of analyte in solution was added to the sample and
was covered by a glass cover slip. Samples normally remained wet throughout SERS
detection. The sample and slide were mounted on an XY micrometer stage with 2 µm
resolution. Micro-Raman data were obtained using a BH3 Olympus microscope attached
I-90 argon ion laser were used as excitation. The laser was focused to a Gaussian spot of
approximately 3 µm in diameter.
Scanning Electron Microscopy (SEM) images were taken on a JEOL 6400F Field
Emission SEM with Everhart-Thornley (E-T) secondary electron detector. Scanning
Auger Microscopy was performed at the University of Florida’s Major Analytical
3.3 Results and Discussion
3.3.1
Spatial Periodic Surface Enhancement from
Silver on PPLN
Prior research has established that silver preferentially deposits on domain
boundaries under ordinary deposition conditions as can be seen in Figure 3.2. 13 Because
LiNbO3 has a relatively low defect density, the internal polarization is screened primarily
by surface charges.13 This external screening leads to singularities in the electric field near
the surface.14 The electric field has a maximum at the domain boundaries. Electrons
excited into the conduction band by the UV illumination are attracted to the domain
boundaries by this field where they reduce silver ions in the AgNO3 solution. The wires
produced by this technique are actually chains of roughly hemispherical clusters ranging
from 30 to 150 nm in diameter as can be seen in the inset of Figure 3.2.
Initial SERS studies utilized pyridine in aqueous solutions ranging from 10-4 to 10-1
M. Substrates with silver and analyte in these concentration ranges showed signifigant
enhancement of the pyridine signal. Substrates without silver showed no enhancement and
the pyridine was undetectable. The spectra of two samples, one with and one without
silver, each with 0.01 M aqueous pyridine are shown in Figure 3.4. All bands below 900
cm-1 that are shared by both spectra are typical of LiNbO3.15 The two bands at 1006 and
1023 cm-1 are the ring breathing modes of pyridine that are shifted slightly to larger Raman
shifts, typical of pyridine adsorbed on silver.16 The broad features at 1350 and 1500 cm-1
are associated with amorphous carbon.17 Inclusion of these carbon bands is typical in
When the laser is scanned across the sample in a direction perpendicular to the
wires, the enhancement of the pyridine breathing mode varied periodically. When
scanning parallel to the wires, the enhancement was nearly constant. These trends are
shown in Figure 3.5. The maxima in this figure are 20-28 microns apart. Wire separation
is expected to be half of this. Also, the half-widths of the peaks are up to 10-18 microns
wide. The assumption is that the enhancement is not from the wires alone.
The periodicity of the enhancement factor was invariant to deposition time between
30 seconds and 15 minutes. Although, at longer deposition times (greater than 10
minutes), enhancement is present at all positions (i.e. the minima do not go to zero), but
the trend is still periodic with the same frequency.
The period of enhancement was also invariant to analyte type (including benzoic
acid and Rhodamine 6g), analyte concentration, and excitation frequency (479, 488, and
514 nm). Pyridine excited with 514 nm light showed the most intense signal (although, not
necessarily the most enhancement) and was used for most measurements. Rhodamine
fluorescence (which will also be enhanced by surface resonance) was extremely intense
and the Raman signal could only be detected with 479 nm excitation.
Pyridine was detected at 10-6 M but not at 10-8 M. Benzoic acid and Rhodamine 6g
were studied at concentrations between 10-2 and 10-4 M, but no attempts were made to
3.3.2 Laser
Damage
Optical micrograph images of samples obtained after SERS characterization
showed significant damage in the regions where the laser light was incident on the surface.
The damage regions appeared as bright, reflective areas in the optical microscope images
that are normally only present on one of the two domains. By defocusing the laser spot a
uniform laser damage region can be created with an approximately 30 µm diameter. After
the analyte solution had dried, AFM and PFM were performed to determine that the laser
damage occurred exclusively on the positive domains (Figure 3.6). The AFM topography
results show that the damage is actually deposition of a surface layer as thick as 0.2 µm.
On PPLN samples without silver nanowires, no laser damage occurred. The damage
phenomenon was also dependent on the presence of an analyte.
Laser induced damage observed on silver electrodes in electrochemical SERS
studies have been explained as surface enhanced photodissociation of either the adsorbed
analyte or dissolved CO2 resulting in a disordered carbon layer. 18 The electromagnetic
enhancement mechanism responsible for SERS also affects other phenomenon associated
with the interaction of a molecule and an electromagnetic field such as luminescence,
absorption, and photochemistry. 19
It was also found that these damaged regions were still Raman active even when
the analyte had dried. (Normally, enhancement is only seen on samples which are still
wet.)
Because the laser damage required silver, it is hypothesized that the damage occurs
that region during illumination. AFM of longer depositions showed that silver eventually
begins to decorate the entire positive domain (Figure 3.3). This is explained by noting
that, while the electric field created by polarization and screening charges has a maximum
at the domain boundary, the field near the positive domain will still be positive and
therefore attractive to conduction band electrons. 14
Although silver islands located away from the wire are occasionally detected, they
are not consistently observed to be preferentially located on either domain. In depositions
with illumination time less than or equal to three minutes, on-domain silver was not
normally detected by AFM. SEM was also not able to detect interstitial silver. SEM
images of a 3 minute deposition showed that most of the silver was on the wires (Figure
3.7). There were some small islands (also observed occasionally in AFM) on the domains,
but they were not preferential to either domain.
SAM was performed on a sample with silver deposition time equal to 5 minutes.
An Auger scan taken from a positive domain is shown in Figure 3.8, and an Auger line
scan taken in a direction perpendicular to the domain stripes is shown if Figure 3.9. The
theoretical spatial resolution of the SAM electron source is 0.5 µm. The SAM line scan
shows results similar to that of the SERS characterization; the period and width of peaks
are in accordance with those of the domains. This finding is consistent with the theory that
residual silver is located on the positive domain. The fact that SAM line scans did not
detect the wires is attributed to lack of spatial resolution. Because LiNbO3 is insulating, a
high scattering angle had to be used (60º) which will adversely affect the spatial resolution.
By decreasing the incident laser power to <1mW, laser damage did not occur even
was not detected from the undamaged regions. These laser powers could be used,
however, to collect SERS scattering from regions previously damaged by more intense
laser light. Figure 3.10 shows a region studied under these conditions. It is apparent from
these results that the spatial periodicity observed in early SERS measurements of the
PPLN/Ag-nanowire system is due to the preferential deposition of SERS-active disordered
carbon layers on the positive domains.
Having demonstrated that laser damage effects obscure the enhancement from the
wires alone, the effects of laser power and exposure times were examined in order to
hopefully avoid photographitization.
SERS intensity was measured as a function of time of exposure to laser radiation
and as a function of laser intensity. Laser damage occurred in the silver pyridine system
on a time scale of the same order of magnitude as a typical Raman scan (~1 minute).
However, for the aqueous benzoic acid system, laser damage occurred much more slowly
and enhancement could be monitored as a function of time. Figure 3.11 shows the SERS
intensity as a function of time for three different laser powers (25, 50, and 100 mW) each
taken at a unique location. An equilibrium is reached for each laser power after
approximately 30 minutes, but it can be seen that the enhancement in this system is not
linear with laser powers above 50 mW.
This can also be seen in pyridine by measuring enhancement factors at several
locations with different laser powers after five minutes of illumination (Figure 3.12). The
laser damage caused by laser powers above 50 mW created irreversible damage to the
enhanced signal. Although some authors have explained this difference by suggesting that
the carbon-like layer is created at the expense of the adsorbed analyte.20
No enhancement is observed on samples for approximately 20 minutes after adding
the analyte. This is normally believed to be the time required for the analyte to adsorb to
3.4 Conclusions
Despite the increased control over the position and shape of the nanoparticles
offered by ferroelectric lithography, substrates studied still suffer from lack of
reproducibility typical of SERS substrates. Greater attention paid to surface preparation
may help to create silver features in a more predictable and repeatable manor.
Several options are proposed for avoiding the laser damage phenomenon which
must be achieved in order to study the enhancement of the nanowires alone. Surface
carbon Raman peaks are evident in many SERS experiments although few authors use post
SERS analysis to check for carbon deposition or laser damage.21 The chemical process
that leads to photographitiaztion is proposed by Cooney et al.22 The process begins when
trace amounts of CO2 in the aqueous solvent are electroreduced to create HCO2- which is
adsorbed on the silver along with the analyte. The organic analyte and formate decompose
under surface enhanced excitation to form an oxidized graphite layer which can further
intercalate the analyte. It is proposed that the carbon-analyte matrix increases the
concentration of analyte in the damage region and thus increases the enhancement. Kim et
al. established that the carbon layer is not required for surface enhancement by using
non-aqueous solvents, it was also noted that the enhancement was greater in systems in which
photographitization occurred.23
Carbon dioxide’s solubility in water makes it a potential contaminant in aqueous
solutions. Non-aqueous solvents such as methanol and isopropanol are commonly used in
SERS experiments and may help to limit photographitization.24 Initial measurements with
rapid evaporation rate of these solvents. Although SERS has been detected for both
solutions on PPLN/Ag-nanowire substrates, the enhancement factors were orders of
magnitude smaller than their aqueous counterparts. Enhancement factors were so low that
SERS spectra can only be observed at seemingly randomly located hot spots.
Laser damage has also been avoided by using longer wavelength light25 and even
protective monolayers that prevent silver complexation.26
Ferroelectric lithographically deposited silver nanostructures could eventually be
used by depositing macromolecules (much larger than the nanowires) on the wires in order
to exclusively enhance the Raman modes of the part of the molecule near the wire.
Because macromolecules have thousands of bonds, their Raman signals are very complex,
and being able to isolate certain portions of the molecule for enhancement may enable
References
1) M. Moskovits, in Surface Enhanced Raman Scattering: Physics and Applications,
edited by K. Kneipp, M. Moskovits, H. Kneipp (Springer-Verlag, Berlin, 2006) p.1.
2) D. Pristinski et al., Journal of Raman Spectroscopy, 37, 762, (2007).
3) J. A. Creighton, C. G. Blatchford, M. G. Albrecht, Jounal of the Chemical
Society-Faraday Transactions II, 75, 790 (1979).
4) G. Mie, Ann. Physik, 25, 377 (1908).
5) W. H. Yang, G. C. Schatz, and R. P. Vandyne, Journal of Chmical Physics, 103,
869 (1995).
6) P. A. Lund, R. R. Smardzewski, and G. E. Tevault, Chemical Physics Letters, 89,
508 (1982).
7) P. F. Liao and M. B. Stern, Optics Letters, 7, 483 (1982).
8) C. Jennings, R. Aroca, A. M. Hor, and R. O. Loutfy, Analytical Chemistry 56, 2033
(1984).
9) D. S. Wang, H. Chew, and M. Kerker, Applied Optics, 19, 2256 (1980).
10) J. Gersten and A. Nitzan, Journal of Chemical Physics, 73, 3023 (1980).
11) O. Sestak, P. Matejka, and B. Vlckova, Collect. Czech. Chem. Commun., 61, 59
(1996).
12) L. Zhao, K. L. Kelly, and G. C. Schatz, J. Phys. Chem. B, 107, 7343 (2003).
13) J.N. Hanson, B.J. Rodriguez, R.J. Nemanich, A. Gruverman, Nanotechnology, 17,
4946 (2006).
15) J.G. Scott et al., Appl. Phys. A, 79, 691 (2004).
16) T. Watanabe, O. Kawanami, K. Honda, Chemical Physics Letters, 102, 565 (1983).
17) M. R. Mahoney, M.W. Wood, R.P. Cooney, Chem. Phys. Lett., 71, 59 (1980).
18) T. P. Mernagh, R. P. Cooney, and K. E. Turner, Chemical Physics Letters 110, 536
(1984).
19) A. Nitzan A. and L. E. Brus, Journal of Chemical Physics, 75, 2205 (1981).
20) J.C. Tsang, J.E. Demuth, P.N. Sanda, J.R. Kirtley, Chemical Physics Letters, 76, 54
(1980).
21) G. Ritchie and C. Y. Chen, in Surface Enhanced Raman Scattering, edited by R. K.
Chang and T. E. Furtak (Plenum Press, New York, 1982).
22) R.P. Cooney et al., Chem. Phys. Lett., 79, 459 (1981).
23) Kim, Chemical Physical Letters, 122, 139 (1985).
24) M. W. Howard and R. P. Cooney, Chemical Physics Letters, 87, 299 (1982).
25) M. L. McGlashen, U. Guhathakurta, K. L. Davis, and M. D. Morris, Applied
Spectroscopy, 45, 543 (1991).
Figure 3.3 AFM height profile of selective deposition on domain boundary and positive domain.
Figure 3.4 SERS of 10-4 M pyridine on lithium niobate with and without silver nanowires.
Figure 3.6 AFM and PFM of laser damaged region.
Figure 3.7 SEM of silver nanowires on lithium niobate.
a)
b)
Figure 3.10 SERS of laser damaged region.
Figure 3.11 Benzoic acid SERS intensity as a function of time.
4. Epilogue
4.1 Ammonothermal Future Work
The Raman spectra of supercritical water and ammonia have been collected with
both visible and UV excitation over a temperature and pressure range appropriate for
solvothermal growth. Several parameters including hydrogen bonding, Fermi resonance,
and pyramidal height, which may affect transport and chemical properties, are monitored
by Raman spectroscopy as functions of temperature, pressure, and fill percent. These
parameters seem unaffected by the addition of sodium azide. Solutions of sodium azide in
ammonia are monitored up to the decomposition temperature. As NaN3 decomposes to
form NaNH2, N2 and H2 are also produced. The Raman intensity of the azide decreases at
an increasing rate as the reaction proceeds suggesting that the reaction rate increases with
pressure. The N2 Raman signal is also observed to increase during the reaction.
The obvious next step in this work is the inclusion of metallic gallium or powdered
GaN feedstock. This will allow detection of the proposed ternary amide intermediates
(Ga(NH2)4- or Ga(NH2)52-). It has been determined that the intermediate, once formed, is
highly soluble at even moderate temperatures making detection likely. Being able to
observe the rate of formation and thermodynamic conditions that facilitate not only the
formation, but also the precipitation of GaN would be possible. Simulating the dissolution
region should be possible with current fill designs, but the crystallization zone is at a much
higher temperature (due to the retrograde solubilities of these intermediates). If the
growers due to KNH2 solubility) could be observed through their decomposition
temperature (380 C). Several improvements to the cell will have to be made to make this
possible.
The window braze joints are the key weak spot of the cell. Metalization of the
sapphire cylinder outer diameter can keep braze material off of the front and back faces of
the window and will make this joint stronger. Moving the window all the way to the tip of
the housing, or using a different alloy with more compatible thermal expansion coefficient
may help increase the temperature ability. There are also fill valves that can handle higher
temperatures, this would allow the entire internal volume to be held at a constant
temperature and simplify the thermodynamic analyses. There are also types of pressure
transducers which are more linear over this temperature range. Adding a port to the cell to
place the thermocouple in better thermal contact with the solvent would increase
thermodynamic accuracy which is important to perform alongside spectral analysis. Use
of a higher quality sapphire can prevent sapphire fluorescence which can obscure Raman
data at certain temperatures. An inert internal standard would make intensity comparisons
4.2 SERS Future Work
A spatially periodic enhancement factor is observed from several analytes adsorbed
on silver nanowires grown on PPLN. The enhancement period is equal to the period of the
domains not of the wires. Laser damage, caused by photographitization of CO2 and the
organic analytes occurs preferentially on the positive domains because small amounts of
silver are deposited there. The carbon laser damage regions are SERS active and obscure
enhancement from the wires.
Because periodically poled lithium niobate is relatively expensive, substrates were
cleaned and reused for SERS experiments. Even though it was determined by AFM/PFM
that the damage caused to the sample for one cleaning cycle was minimal, the surface and
wire quality is probably decreased by dozens of cleaning cycles. Surface preparation has
been seen to be very important in the silver deposition. Using fresh samples and
examining more closely the effects of surface preparation on wire growth are the most
important next step. Samples made using the same deposition conditions can show islands,
whole domain coverage, or only wires.
Deposition at elevated temperature showed better wire quality on stoichiometric
LN. Stoichiometric LN also allows for custom domain patterning, but SLN is much more
expensive than the congruent counterparts used in this study.
Because low laser powers did not cause laser damage, they could be used to
higher scattering cross section could be increased. Several other methods for avoiding
laser damage include non-aqueous solvents, protective layers, and longer wavelength