ABSTRACT
ATIQ, AASIM AHMED. Influence of Anchoring Group Isomerization on Electron Injection and Total Conversion Efficiency in Dye-sensitized Solar Cells. (Under the direction of Dr. Ahmed El-Shafei.)
Dye-Sensitized Solar Cells (DSSCs) offer a promising alternative source of energy
to address growing needs for electricity. They have potential to be inexpensively
made using abundant resources and possess the unique attribute of posing a low
negative impact on the environment, unlike many other technologies used to
generate electricity.
Reported are the synthesis, characterization and application of two heteroleptic
Ruthenium (II) bistilbazole-based sensitizers,
Ru(4,4’-dicarboxylic-acid-2,2’-bipyridine)(4,4’-bis((E)-2-(9-ethyl-9H-carbazol-3-yl)vinyl-2,2’-bipyridine)(NCS)2
(named RAAP) and Ru(5,5’-dicarboxylicacid-2,2’-bipyridine)
(4,4’-bis((E)-2-(9-ethyl-9H-carbazol-3-yl)vinyl-2,2’-bipyridine)(NCS)2 (named RAAM) to study the effects of altering the position of the anchoring groups on the bipyridyl ring in sensitizers
designed to absorb light at longer wavelengths compared to current benchmark
sensitizer N-719. UV-Visible spectrophotometeric measurements show that RAAP
and RAAM exhibit 56% and 22% greater molar extinction coefficients, respectively,
than the current benchmark dye N-719. Spectroscopic and I-V (current-voltage
Table 1-0: Spectroscopic and I-V properties of N-719, RAAP and RAAM. % increase
compared to N-719
Dye
λ
max
(nm)
ε
maxEmission Wavelength
(nm) JmA/cmSC, 2 Efficiency (η) %
η JSC
N-719 528 13,200 738 17.4 9.27 - -
RAAP 545 20,700 748 20.6* 10.32* 18.4 11.3
RAAM 548 16,100 780 5.62 2.46 - 67.7 - 73.5
*Indicates value achieved with 1 equivalent of tetrabutylammonium hydroxide in dye
I-V characterization and Incident Photon to Current Conversion Efficiencies (IPCE)
show that RAAP exceeded the performance properties of N-719 with higher total
solar-to-electric conversion efficiency and extended photocurrent response at longer
wavelengths. The effect of isomerism in RAAM leads to attenuation of photocurrent
Design and Synthesis of Novel Ruthenium Based Sensitizers for Dye Sensitized Solar Cells
by
Aasim Ahmed Atiq
A thesis submitted to the Graduate Faculty of North Carolina State University
in partial fulfillment of the requirements for the Degree of
Master of Science
Textile Chemistry
Raleigh, North Carolina
2011
APPROVED BY:
Dr. Ahmed El-Shafei Dr. Harold S. Freeman
Chair of Advisory Committee Member
Dr. Peter J. Hauser Dr. David Hinks
Member Member
BIOGRAPHY
Aasim Ahmed Atiq was born and raised in Karachi, Pakistan. In 2003, he started his
undergraduate education at Textile Institute of Pakistan where he met Fakeha
Naeem who he married in March 2008 after graduating with a BSc (Honors) in
Textile Science. Following graduation, Aasim chose to pursue a career in research
and academics and starting working as a Research Assistant at the Textile
Research and Innovation Centre (TRIC) where he worked on technical textiles and
surface modification of textiles with atmospheric plasma. During his tenure at TRIC
he presented at various local and international conferences including the 86th Textile Institute World Conference in Hong Kong. He was awarded the Talented Research
Exchange Program (TRXP) award by British Council to collaborate his research with
the Centre of Materials Research and Innovation (CMRI) in Bolton, UK where spent
the Summer of 2009 working on various collaborative projects between TRIC and
CMRI.
Aasim was awarded a Research Assistantship at NCSU and came to Raleigh in
August 2009 where he changed directions and started working on synthesis of
ACKNOWLEDGEMENTS
This work would not have been possible without support from my advisor Dr. Ahmed
El-Shafei. I thank him for having confidence in me to employ me to work on the
DSSC project and for his consistent encouragement that helped me pull through
courses in chemistry, after coming to NCSU with a modest background in the
subject. I thank Dr. El-Shafei for his patience with my unconventional ways and
allowing me leverage to work from my comfort zone while at the same time, driving
our research forward to bring the DSSC project to the point where it stands today.
I am very thankful to Dr. Ashraful Islam, Principle Scientist at National Institute of
Material Science for his time and effort for conducting IPCE tests, I-V measurements
and measuring the excited and ground state potential of the dyes.
I owe gratitude to the members of my advisory committee Dr. Harold Freeman, Dr.
Peter Hauser, Dr. David Hinks and Dr. Euykyung Shim for their valuable input. I
thank Dr. Keith Beck for helping with chromatography and discussions that provided
practical knowledge. I appreciate Ms. Birgit Anderson for helping with the use of
instruments in the analytical lab, particularly UV-Visible spectrophotometry and FTIR
and Ms. Judy Elson for help with equipment and providing expertise on cutting glass
to fabricate solar cells. I would not have been able to get started on my project
experiments. Sasha Ormond was very helpful with advice on tedious filtration
procedures of synthesized complexes. I also thank her for lending equipment for
some of my work and for the efforts put into trying to get the fluorometer in order.
The time spent at NC State would have been dull without friends. I thank Mian
Sajeel, Qasim Lone, Zohaib Qazi, Raza Abbas, Sadaf and Imran Khan, Ahmer
Ghani, Professor Maqbool, Brian Edwards and all our friends whose names would
take pages to mention for all the wonderful dinners, tea/coffee sessions and
memories made during road trips and shopping sessions.
I thank my wife Fakeha for her unwavering support throughout the course of my
Masters degree studies including the long research hours and assignments that led
to uncountable late nights. Even though, at times I could not comprehend her
frustration, I owe her for the sacrifices she has made in being here with me and for
her patience with visa related restrictions in the US. I am proud of her for
undertaking community service work and helping me stay focused on my goal by
keeping engaged with initiatives at the NC State Craft Center.
For their unconditional love and support, I thank my parents, family members and
TABLE OF CONTENTS
LIST OF FIGURES ... ix
LIST OF TABLES...xii
1 INTRODUCTION ... 1
1.1 Solar Spectrum ... 3
1.2 Overview of Photovoltaic Technologies and Market ... 5
2 DYE-SENSITIZED SOLAR CELLS (DSSCs) ...10
2.1 Historical Background ... 10
2.2 Cell Structure and Dynamics... 12
3 CELL COMPONENTS AND CHARACTERIZATION ... 16
3.1 Conductive Electrodes ... 16
3.2 Oxide Semiconductors ... 17
3.3 Sensitizer Dye ... 21
3.4 Electrolytes... 22
3.5 Counter Electrode Catalyst ... 24
3.6 Electrical Contacts ...25
3.7 Sealing ... 26
3.8 Photovoltaic Characterization ... 26
4 SENSITIZER DYES...30
4.2 Review of Ruthenium(II)-Polypyridyl Complexes ... 33
4.3 Closing Remarks for Literature Review...51
4.4 Work Plan... 51
5 EXPERIMENTAL ... 53
5.1 General Information ...53
5.2 Synthesis... 53
5.3 Purification ... 55
6 CHARACTERIZATION ...57
6.1 Dye Characterization...57
6.1.1 Fourier Transform Infrared Spectroscopy... 57
6.1.2 UV-Visible Spectroscopy ... 58
6.1.3 Fluorescence Spectroscopy ... 58
6.1.4 Nuclear Magnetic Resonance (NMR)...58
6.1.5 Electrospray Ionization Mass Spectrometry ... 59
6.2 Cell Preparation and Characterization ...59
6.2.1 Photovoltaic Measurements ... 60
6.2.2 Incident Photon to Current Conversion Efficiency ... 60
7 RESULTS AND DISCUSSION ... 61
7.1 Synthesis... 61
7.2 Fourier Transform Infrared Spectroscopy ...65
7.4 Mass Spectrometry ...69
7.5 Nuclear Magnetic Resonance ... 71
7.6 Photovoltaic Measurements... 73
7.7 Incident Photon to Current Conversion Efficiency (IPCE)...80
7.8 HOMO and LUMO of Dyes ... 83
8 CONCLUSIONS... 86
9 FUTURE WORK ... 88
10 REFERENCES ... 89
11 APPENDIX... 100
Appendix A1, Intermediate Antenna Ligand for Target Compounds (4,4’-bis((E)-2-(9-ethyl-9H-carbazol-3-yl)vinyl-2,2’-bipyridine) ... 101
Appendix A2, RAAP Crude Product... 102
Appendix A3, RAAP Purified... 103
Appendix A4, RAAM Crude Product ... 104
Appendix A5, RAAM Purified ... 105
Appendix B1, RAAP ESI-MS... 106
Appendix B2, RAAM ESI-MS ... 107
Appendix C1, RAAP Full Spectra (Temperature Variation) ...108
Appendix C2, RAAP Aromatic Region (Temperature Variation) ...109
Appendix C3, RAAP CH3 (Temperature Variation)... 110
Appendix C5, RAAP Full Spectrum... 112
Appendix C6, RAAP Aromatic Region ...113
Appendix C7, RAAM Full Spectrum ... 114
Appendix C8, RAAM Aliphatic Region ...115
Appendix C8, RAAM Aromatic Region...116
Appendix D1, I-V Tables (Preliminary Testing, Day 1)... 117
Appendix D2, I-V Tables (Preliminary Testing, Day 4)... 118
Appendix D3, I-V Tables (TiO2 Thickness Studies)... 119
Appendix D4, I-V Tables ...121
LIST OF FIGURES
Figure 1-1: Spectra of the extraterrestrial AM 0 radiation and AM 1.5G standard solar reference radiation [6]. ... 4 Figure 1-2: Current photovoltaic research-cell efficiencies (figure by L. Kazmerski, National Renewable Energy Laboratory (NREL) [7]. ... 6 Figure 1-3: Global PV markets in 2010 (GW) [Up to date PV module and system prices available at [8]. ... 7 Figure 1-4: US PV market breakdown [8]. ... 8 Figure 1-5: Area-related price and power output for various technologies [9]. ... 9 Figure 2-1: Incident-photon-to-current conversion efficiency as plotted as a function of wavelength single crystale anatase cut in the (101) plane (left), Nanocrystalline anatase film (right) [5]. ...12 Figure 2-2: Schematic of dye sensitized solar cell... 13 Figure 2-3: Schematic energy diagram of kinetic processes in dye sensitized solar cells [5, 15, 16]... 15 Figure 3-1: Schematic showing diffusion of electrons after injection from dye into TiO2...20 Figure 3-2: Effect of frequency at constant bias (left) and different bias light at
frequency of 0.7 Hz (right) on IPCE [85]... 28 Figure 3-3: Comparison IPCE in DC and AC (1Hz, ca.10mA; 0.5 sun bias) modes [85]...29 Figure 4-1: The structures of N-719 (left) and Black Dye (right) [51]...30 Figure 4-2: Schematic showing components of organic sensitizer dye anchored on TiO2...32 Figure 4-3: Cis-X2Bis(2,2’-bipyridyl-4,4’-dicarboxylate)ruthenium(II) complexes (X = H2O, Cl-, Br-, I-, CN- or SCN-) [36]. ... 34 Figure 4-4: Photocurrent action spectrum for cis-Ru(II)L2(H2O)22–coated TiO2 films in 0.1 M aqueous NaI. Lower curve shows the photoresponse of TiO2 in the absence of sensitizer [60]... 35 Figure 4-5: IPCE Spectra of TiO2 electrodes sensitized with different Ru(II)
polypyridine complexes, electrolyte: 80% ethylene carbonate, 20% propylene carbonate, 0,5M KI, 40mM I2. Dye (b) adsorbed from water, dyes (c) and (d)
Figure 4-7: IPCE spectra of cis-di(cyanato)Bis(2,2’-bipyridyl-4,4’-dicarboxylate) ruthenium(II) (-) and cis-(cyanato)Bis(2,2’-bipyridyl-5,5’-dicarboxylate)ruthenium(II)
(...) [66]... 38
Figure 4-8: UV–Vis absorption spectra of cis- and trans -dithiocyanatobis(2,2′-bipyridine-4,4′-dicarboxylic acid) ruthenium(II) complexes [72]. ...41
Figure 4-9: I–V curves for a solar cell based on (■) trans-Ru and (●) cis-Ru (N-3) in simulated AM1.5 sunlight (924 Wm−2) [73]...41
Figure 4-10: Structure of Ru(L2 )(NCS)2 where L = 4,4′-bis(carboxyvinyl)-2,2′-bipyridine [76]. ... 43
Figure 4-11: Examples of functional ligands...44
Figure 4-12: Structure of “Black Dye”. ... 45
Figure 4-13: IPCE spectra for RuL2(NCS)2 (N-3) and RuL’(NCS)3 (Black Dye) with two carboxylic acid moieties deprotonated with TBAOH [78]. ... 46
Figure 4-14: Dependence of IPCE spectra on haze of TiO2 [24]. ...47
Figure 4-15: Molecular structure of CYC-B11 [79]... 48
Figure 4-16: Electronic absorption spectra of CYC-B11, its anchoring and ancillary ligands in DMF[79]... 49
Figure 4-17: Molecular structure of N845 [80]. ...50
Figure 4-18: Structures of RAAP (left) and RAAM (Right)... 52
Figure 5-1: Arrangement of Sephadex LH-20 Column showing three bands. ... 56
Figure 7-1: Synthesis of 4,4’-dicarboxlalic acid-2,2’-bipyidine. ... 61
Figure 7-2: Synthesis of antenna ligand, 4,4’-bis((E)-2-(9-ethyl-9H-carbazol-3-yl)vinyl-2,2’-bipyridine. ...62
Figure 7-3: Synthetic scheme for RAAP. ... 63
Figure 7-4: Synthetic scheme for RAAM. ... 64
Figure 7-5: FTIR spectrum for crude RAAP with impurity... 66
Figure 7-6: FTIR spectrum for RAAP with impurity band at 1980 cm-1 attenuated... 66
Figure 7-7: FT-IR spectrum for RAAP impurity showing amplified intensity of band at 1950cm-1. ... 66
Figure 7-8: UV-Vis and emission spectra of dyes measured using 2x10⁻⁵M solutions in DMF. ... 68
Figure 7-9: Positive Ion ESI mass spectrum for intermediate RAA. ...69
Figure 7-10: Negative Ion ESI-MS for RAAP showing the (2M-2H)2- peak... 70
Figure 7-11: Negative Ion ESI-MS for RAAM showing (2M-2H)2- peak. ... 70
Figure 7-12: Negative Ion SI-MS for RAAM showing (M-2H)2- peak. ...71
Figure 7-14: I-V curves using RAAP (0.3M tBP), RAAM (0.3M tBP) and N-719 (0.5M
tBP) sensitizers. ... 75
Figure 7-15: I-V curves for RAAP showing effect of variation in thickness of TiO2 layer with 5µm scattering layer. ... 77
Figure 7-16: IPCE spectra of RAAP, RAAM and N-719. ... 82
Figure 7-17: IPCE spectra of RAAP with 0.3M tBP ... 83
LIST OF TABLES
Table 7-1: Extinction coefficients and emission maxima ... 67
Table 7-2: preliminary I-V characteristics of DSSCs... 76
Table 7-3: I-V characteristics of RAAP DSSCs with varying TiO2 thickness. ... 77
Table 7-4: I-V characteristics of DSSCs after aging for 4 days. ...78
Table 7-5: Bias averaged I-V characteristics of RAAP DSSCs with TBA control. .... 79
1 INTRODUCTION
Work towards development of solutions to combat the energy crisis is at the forefront
of agendas throughout the globe. Our need for energy has been ever increasing
since the first discovery of fire and with rising demands and rapidly depleting
resources there is a clear need to find alternate sources of energy to keep at par
with requirements.
It is not only well known that the world’s fossil reserves are depleting and will
eventually run dry [1, 2] but exploitation of the planet’s resources also comes at a
heavy price in terms of the impact it causes on the environment. Advances in
technology add to the existing load on the eco-system and the increasing need for
energy has not only led to geopolitical tension but has also caused profound
environmental damage, putting life itself at risk [1].
Clearly, an alternate source of energy is needed to meet these ever increasing
requirements. While many forms of sustainable energy systems are being used,
putting a harness to the energy from the sun has potential to be a viable alternative
to current practice. At present, energy is globally consumed at a rate of about 15 TW
and geothermal nearly 20% of global electricity consumption is based on renewable
sources out of which the majority is contributed by hydropower. Even though
installed renewable energy capacities are increasing, their shares in energy and
electricity consumption have been constant for the past two decades. [3]
The photovoltaics sector is the fastest growing power generation technology and has
been growing at an annual rate of about 40% for the past couple of decades [4]. This
growth can be attributed to the development of new, less expensive technologies
such as the thin-film cell and reduction of prices due to economies of scale.
However, these new technologies haven’t been able to match the conversion
efficiencies of their silicon counterparts. While installation of solar cells with an
efficiency of 10% on about 0.1% of the earth’s surface area would be enough to
satisfy our current energy needs [5], for photovoltaics to make a significant impact in
the future energy figures, there is a need for efficient and low cost cells made of
abundant materials with low toxicity using simple manufacturing process. Such cells
would also need to have the ability to last long enough in the performance
environment to provide sufficient return on investment.
This potential is held by dye-sensitized solar cells (DSSCs) developed at the Ecole
Polyechnique Federale de Lausanne in 1991. DSSCs promise to be a significant
contributor to the future global energy portfolio. Although efforts are already in place
series of challenges before the technology can be successfully commercialized.
These are in part related to optimizing individual components of the device to
enhance the overall conversion efficiencies in order to achieve a suitable benchmark
that can supersede performance of current technologies in terms of cost per unit
watt to achieve “grid parity”.
A variety of strategies can be employed to increase the overall efficiencies of the
Dye sensitized solar cell (DSSC). The purpose of this thesis is to explore the role of
dye which serves as a sensitizer in dye sensitized solar cells (DSSCs) and work on
the design and synthesis of novel dyes with the ultimate goal of improving the
solar-to-electric conversion efficiency of these devices beyond 11% so that their overall
cost per unit watt output can make them successful competitors in the photovoltaic
market.
1.1 Solar Spectrum
In order to understand the performance of any solar cell, it is important to first
scrutinize the characteristics of the solar spectrum that powers such devices.
Solar radiation from the sun can be transformed into various other types of energies
such as heat, chemical energy or electricity. A solar cell converts light into electricity
characteristics of light used for illumination of these devices are thus vital to the
ability of a cell to perform efficiently.
According to Planck’s distribution, the irradiation of the sun can be approximated by
a black body emitting radiation at a temperature of 5800 K. A comparison of the
tabulated solar irradiance outside the earth’s atmosphere which is referred to as the
black body spectrum (AM 0) and the standard solar reference spectrum (AM 1.5G) is
shown in Figure 1-1.
The AM 1.5G spectrum is defined and modeled by the American Society for Testing
and Materials (ASTM). It is the standard reference spectrum in photovoltaics and
corresponds to the total global (hemispherical) spectrum [6]. The number AM 1.5G
defines the standard spectrum of the sun after passing through the earth’s
atmosphere, inclined at a zenith angle of 48.19o which corresponds to an air mass of 1.5. The AM 1.5G spectrum shows high spectral irradiance especially for the
wavelength regime ranging from 410 to 910 nm.
1.2 Overview of Photovoltaic Technologies and Market
Photovoltaic (PV) devices can be divided into four major classes namely:
Multi-junction concentrator systems, crystalline silicon, thin film technologies and
emerging PVs which include organic, inorganic and dye sensitized solar cells. A
Figure 1-2: Current photovoltaic research-cell efficiencies (figure by L. Kazmerski, National Renewable Energy Laboratory (NREL) [7].
While the PV industry has shown considerable growth over the past two decades,
there are a variety of challenges faced by each of the existing technologies that keep
them from attaining commercialization.
Most conventional solar cell technologies are faced with the challenge of high costs
whereas thin film systems need to work on replacement of indium, which is
expensive and in limited supply [5]. Dye sensitized solar cells are on their way to
commercialization with companies such as Dyesol, Solaronix and G24i boldly
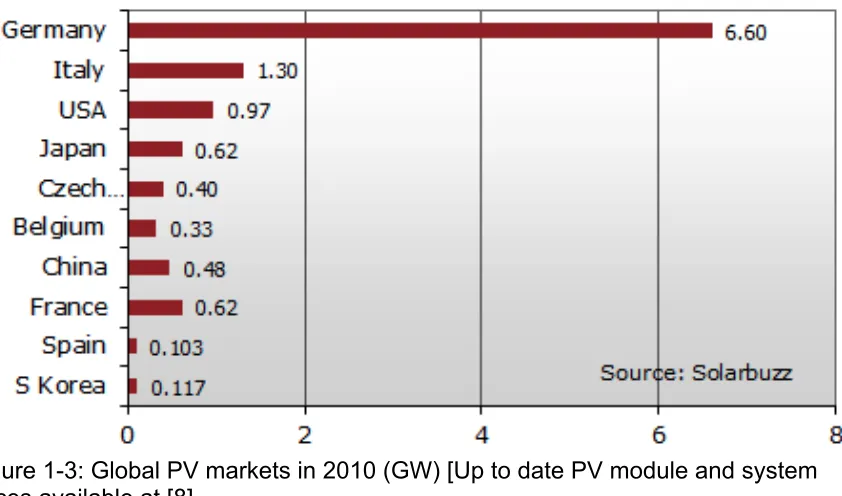
2010 by consumption in gigawatts (GW). With a growth of 36% in 2010, USA lies
third on the leader board. Over the next few years the market in USA is expected to
grow to around ten times the size it was in 2009 at an average growth rate of 30%
per annum [8].
Figure 1-3: Global PV markets in 2010 (GW) [Up to date PV module and system prices available at [8].
The current breakdown of the US market is shown in Figure 1-4 with California
taking the lion’s share in business largely due to strong pre-existence of a silicone
Figure 1-4: US PV market breakdown [8].
Prices of PV electricity in the US vary between 17-70 US cents per kWh based on a
20 year life span of installed systems [8]. While these numbers are currently not low
enough to outperform the grid, there are instances involving remote applications in
areas where they may be feasible. For instance, PV can be a cheaper alternate to
consider in areas where a grid connection may be more than a distance of 1km from
the point of application [8].
Figure 1.5 shows the area related price and power output for different solar
technologies [9]. It is perceived that no one technology will dominate the PV market
or solar cell covered laptop or sunroof, consumers might be willing to pay a higher
price per unit watt to take advantage of high power output cells. On the other hand,
to power a building with a surface area of over 10,000 m2 that can be covered with solar cells, a better option might be one of the lower efficiency cells available at a
lower cost.
Figure 1-5: Area-related price and power output for various technologies [9].
It is evident that photovoltaic technologies hold remarkable potential for growth in
coming times and DSSCs offer remarkable attractive features that make them a
strong contender in the race. It is also clear that the improvement in efficiencies of
these types of cells with preservation of attractive features from cost benefits will
further improve their potential to out perform other technologies in the photovoltaic
market. This potential has made the DSSC arena an area of growing interest over
2 DYE-SENSITIZED SOLAR CELLS (DSSCs)
2.1 Historical Background
DSSCs work by absorption of light by a dye molecule attached to the surface of a
nanoporous large band gap semiconductor. Photons excite an electron from the
highest occupied molecular orbital (HOMO) of the dye to its lowest unoccupied
molecular orbital (LUMO). The excited electron is injected into the conduction band
of TiO2 within a matter of a few femtoseconds leaving behind a hole that is subsequently replenished by an electron from an electrolyte system. The injected
electrons move through the semiconductor into a conductive electrode and flow back
to the electrolyte through an external circuit to reduce the electrolyte and complete
the cyclic process [5].
The origins of photosensitization lie in the well-established field of photography. A
series of notable discoveries in the 19th century are important events in the history of photosensitization. Namba and Hishiki established a link between photography and
photoelectrochemistry in 1964 by demonstrating both processes by use of a single
dye [10]. In 1873 Vogel discovered that the spectral response of photographic silver
halide emulsions could be enhanced from the blue to the green region by addition of
a dye [11]. While the photoelectrochemical effect had been demonstrated in 1839 by
Edmund Becquerel, a French experimental physicist who noticed the generation of
placed in an electrolyte [12], it wasn’t until the late eighties that Mozer reported
enhancement of phtoelectrochemical response by dye-sensitizing a photoelectrode
using the dye erythrosine on silver halide electrodes [5, 13]. Even though it was
established in the sixties and seventies that the sensitization process was that of
charge transfer rather than that of energy transfer from the dye to the semiconductor
[14], the achieved currents at the time were quite low since light was absorbed by a
monolayer of dye attached to a single crystal [5].
In 1976, Tsubomura et al. demonstrated an efficiency of 1.5% using porous ZnO to
enhance the sensitization area but the real breakthrough came in 1991 from
O’Regan and Grätzel when they reported a cell made of sensitized mesoporous
TiO2 with a conversion efficiency of 7.1% [15].
The Incident Photon-to-Current Efficiency (IPCE) conversion curves representing
photosensitized current from a single crystal and nanoporous TiO2 both anchored with ruthenium complex cis-RuL(SCN)2 are shown in Figure 3.1 as adapted from a review article by Michael Grätzel published in 2001 [5]. IPCE curves, which measure
the photocurrent generated by photovoltaic devices as a function of wavelength,
Figure 2-1: Incident-photon-to-current conversion efficiency as plotted as a function of wavelength single crystale anatase cut in the (101) plane (left), Nanocrystalline anatase film (right) [5].
2.2 Cell Structure and Dynamics
A schematic representation of a typical DSSC is shown in Figure 2-2. Photons from
sunlight pass through a glass electrode coated with a thin layer of transparent
conductive oxide. This conductive oxide is usually fluorine doped tin oxide (FTO).
The front glass electrode supports a layer of colloidal TiO2. Typical sizes of the TiO2 particles are about 20-30nm with a thickness of about 10µm and porosity of
approximately 60%. These films are attributed to an internal surface area many
thousand times larger than the projected area of the electrode. To enhance light
entrapment, a layer of TiO2 particles with an average size of around 200nm is added with an approximate thickness of 5µm. This serves as a light scattering layer and
acetonitrile. The back conductive layer of the electrode is coated with catalytically
active platinum to efficiently reduce the oxidized redox species and sealed with a hot
melt polymer to produce a working dye sensitized solar cell.
Figure 2-2: Schematic of dye sensitized solar cell.
The principle chemical phenomena of a DSSC are summarized by equations 2.1
through 2.7 and the processes that take place in inducing an electric current are
S + hv → S* Photoexcitation (2.1)
S*→ S+ + e
-(TiO2) Charge injection (2.2)
S+ + 2I- → S + I2●- and 2I2●- → I3- + I- Dye regeneration (2.3) I3- + 2e- →3I- Electrolyte regeneration (2.4)
S*→ S Dye relaxation (2.5)
S+ + e
-(TiO2) → S Recombination via dye (2.6)
2e-(TiO2) + I3
- →3I- Recombination via electrolyte (2.7)
The fermi level of electrons in TiO2 in the absence of light is equilibrated with the redox energy level of the electrolyte. When a photon is absorbed by the sensitizer
dye (S), an electron is pushed from the HOMO to the LUMO. The excited sensitizer
(S*) injects an electron into the conduction band of the TiO2. This injection happens on a femto to picosecond time scale (equation 2.2) in contrast to about 10 ns taken
for the electron to relax back to its ground state (equation 2.5) [15, 16]. The dye, now
in an oxidized state (S+), is reduced to its original state (S) by redox reactions shown by equation 2-3 in a timescale of approximately 10µs. These reactions are favored
over recombination reactions via dye and electrolyte shown in equations 2.6 and 2.7
Figure 2-3: Schematic energy diagram of kinetic processes in dye sensitized solar cells [5, 15, 16].
The photocurrent response of state of the art laboratory devices commonly reaches
values close to 100% at the wavelengths of maximum dye absorption when
measured using IPCE. Accounting for reflection losses in glass, this means that at
certain wavelengths, every photon of light absorbed by the dye leads to extraction of
an electron at the anode. Current understanding of DSSC dynamics suggests that
losses due to dye relaxation and regeneration through an injected electron from TiO2 are negligible [16]. However, the processes of electron injection and dye
3 CELL COMPONENTS AND CHARACTERIZATION
This section discusses the various materials used in making dye sensitized solar
cells (DSSCs) and the function of each component in a cell. Over the years,
materials have been explored which offer various new avenues for research such as
plastic substrates for flexible cells and solid state electrolytes. Exploration and use of
alternate materials for DSSCs is a complex subject and is often studied in dedicated
projects. This section, thus explores the materials that are used in standard DSSCs
based on liquid electrolytes using glass electrodes.
The main components of cells as shown in Figure 2-2 in section 2 include the
conductive electrodes, TiO2 nano-particles, sensitizer dye, electrolyte, sealant, counter electrode catalyst and additives for the electrolyte.
3.1 Conductive Electrodes
DSSC electrodes are prepared by coating glass with a transparent conductive oxide
(TCO). The most commonly employed material for this purpose is fluorine-doped tin
oxide (SnO2:F) commonly referred to as FTO. Widespread use of this material is due to its ability to withstand heating up to 450-500 oC required for sintering TiO
TCO coated glass is available in a variety of sheet resistances. Selection of material
is on the basis of compromise between high conductance at the expense of low
transmittance of light. Sheet resistances varying between 7-20 Ω/sq are available
from several commercial manufacturers which include Libbey Owens Ford, Nippon
Sheet Glass, Asahi and Pilkington who subcontract their product to Hartford Glass.
Plastics, which can be used as alternatives to glass substrate face limitations due to
high sintering temperature required for TiO2. This is an area of research on its own and is beyond the scope of this thesis.
3.2 Oxide Semiconductors
Exceptional stability against photo corrosion and wide band gap (>3 eV) of oxide
semiconductors has made them the material of choice in photochemistry [20]. Apart
from TiO2, various other materials which have been used in fabrication of DSSCs include ZnO, CdSe, CDS, WO3, Fe2O3, SnO2, Nb2O5 and Ta2O5 [21]. However, it is TiO2 that was published in the seminal work by Grätzel in 1991 and remains the leading oxide semiconductor in use today.
TiO2 can exist in three crystal forms, anatase, rutile and brookite. Out of these, brookite is difficult to produce and is not of practical interest for DSSCs. Anatase
with a band-gap of 3.2 eV with a physical structure comprising of conical crystals is
structure at a temperature between 700-1000 oC [20]. The large band gap of anatase makes it the most favored form of TiO2 used in DSSCs [29].
While initial cells were made with a TiO2 paste formulated at EPFL, work has been carried out on commercially available TiO2 pastes reporting high conversion efficiencies. TiO2 can be purchased in powdered form by one of several manufacturers but is also available as pre-prepared paste, especially formulated for
specific application processes such as screen printing or doctor blading. The
dependence of cell efficiency on microstructure of nano-particles has been
investigated and studies suggest little difference in cell efficiencies in spite of
significant variation in microstructure [22].
The TiO2 can be deposited on the TCO glass by one of several methods such as screen printing, doctor blading or spin coating with the objective to achieve a uniform
layer of known thickness. Deposition can be carried out by repeated steps of
application followed by drying at 125 oC until desired thickness is achieved which is usually between 12-14 µm for the working electrode. The same steps can be
followed for the scattering layer which is usually 4-5 µm thick [23]. The thicknesses
of the oxide layers can be modified to tune the maximum efficiency of a cell
depending on the characteristics of the sensitizer dye [24]. Once an acceptable
This burns out any binders and surfactants and establishes good electrical contacts
between particles of TiO2 as well as with the TCO.
The TiO2 electrode can be further treated with a 0.2M solution of TiCl4 in ice water. Several groups have reported this after treatment from time periods of an hour to
two days [26, 27]. This treatment is said to form a thin layer of pure TiO2 without any iron impurities on the surface of the existing nanoparticles. The iron impurities are
more soluble in solution and hence preferentially remain in solution leaving the
freshly nucleated surface relatively pure. The effectiveness of this treatment is
confirmed whereby its efficacy is lost if the electrode is air-dried after removal from
solution rather than being washed with deionized water [28].
Further studies suggest that the performance of the cell after TiCl4 treatment could be improved because the fresh TiO2 interconnects existing particles, reducing the chance for electrons to recombine with the electrolyte [29]. Investigation shows that
the TiCl4 treatment leads to the formation of a rutile top layer on the anatase particles. The increased thickness also enhances light scattering properties of the
film which could be another reason behind the observed improvement in cell
performance [30].
It has been shown experimentally that after treatment of dye coated electrodes with
recombination thus improving the Voc from 0.38 V to 0.66 V and the fill factor from 0.48 to 0.63 [28]. The observation suggests that charge recombination in DSSCs
mainly takes place via electrolyte and dark current reduces because
4-tert-butylpyridine blocks any access points for the electrolyte on the TiO2 particles that is directly exposed to electrolyte as shown in Figure 3-1.
Figure 3-1: Schematic showing diffusion of electrons after injection from dye into TiO2.
Several groups report similar findings, however, further exploration of this
phenomenon has, in cases, shown depreciation in cell performance with addition of
ammonia and have reported improvements in performance with the addition of such
additives. [33, 34, 35].
3.3 Sensitizer Dye
The role of the sensitizer (dye) in DSSCs is to significantly enhance the spectral
response of the TiO2 by absorbing light from the visible to near infra-red portion of the electromagnetic spectrum. The two most prominent dyes in the DSSC arena to
date are cis-RuL2(NCS)2 where L is 2,2´-bipyridyl-4,4´-dicarboxylic acid commercially called “N-3” and
tri(cyanato)-2,2´,2´´-terpyridyl-4,4´,4´´-tricarboxylate)ruthenium(II) referred to in the literature as “N-749” or “Black Dye”.
The highest efficiency reported date for a research cell with an active area of 0.158
cm2 using a modified version of N-3 is 11.18%, reported in 2005 using a mono-protonated salt of N-3 with three molecules of tetrabutylammonium hydroxide
(TBAOH) per dye [36]. Although Black Dye has strikingly attractive properties with
absorbance well into the 800nm region, it hasn’t been able to surpass the 11.18%
barrier. In 2006, Black Dye was able to achieve a conversion efficiency of 11.1% that
was certified by the National Institute of Advanced Industrial Science and
Technology, AIST using a cell with an active area of 0.219cm2 [24].
to fully impregnate the nanoparticles with dye. It has been reported that the
electrode is highly sensitive to water and its presence can adversely affect
performance, however, this statement is not supported by published experimental
work [37]. Deoxycholic acid is often used as a coadsorbant in the dye solution to
prevent aggregation of dye molecules in solution and on the surface of TiO2 [25, 32].
3.4 Electrolytes
The electrolyte that has resulted in highest efficiency cells to date is a redox couple
based on iodine (I-) and triiodide (I
3-) with acetonitrile as a solvent. The redox couple is usually prepared by adding I2 to the solvent together with some iodine salt such as KI [15] and LiI [37].
It was not until 2001 that work was published highlighting the importance of the
cation of the iodine salt in the performance of the DSSC. The photocurrent output
was found to increase linearly as the cation radius decreased and the smallest
cations Li+ and K+ showed highest performance. The results also show that the relative concentration of iodine to triiodide in the electrolyte is an important factor
that affects cell performance [38].
Commercial viability of DSSCs strongly depends on the solvent system used for the
electrolyte. The initial choice of solvent was acetonitrile which seems to be the best
use in the natural environment for up to 20 years [39, 40] and acetonitrile’s low
boiling point of 82 oC coupled with high volatility which causes solvent to escape from the seals of sandwich type cells and high toxicity limits its application in
commercial cells. The choice for solvent is usually a trade off between high
conversion efficiencies using volatile solvents with better ion diffusion properties
against long term stability using high viscosity solvents that have lower ion mobility
with comparatively forgiving sealing requirements [41]. Long term stability has been
demonstrated using molten salts such as methyl-hexyl-imidazolium iodide, which
serve as both high viscosity solvents and iodine salts for the electrolyte. These
materials work well for low power indoor DSSC applications [41].
Methoxypropionitrile has shown promise as a potential candidate towards
commercialization of DSSCs because of its low toxicity and boiling point of 160 oC [40].
Iodide/triiodide based redox elelctrolytes are now commercially available from
several commercial suppliers. Among these commercial suppliers, Dyesol, Soloranix
and Everlight offer a mix of electrolyte systems with volatile and non-volatile
solvents.
Tetrabutylammonium hydroxide (TBAOH) can be added to the electrolyte to
decrease inner filtration of light because of absorption by the triiodide species [39].
-at the counterelectrode [42]. The increased pH causes a neg-ative fl-atband potential
shift of the TiO2 photoelectrode leading to a higher photovoltage. This comes at the expense of some loss in current but the total conversion efficiency often improves
due to a better fill factor. Furthermore, additives such as 4-tert butylpyridine (tBP)
are added to the electrolyte instead of being adsorbed onto the electrode through a
separate impregnation step after dye adsorption [24, 32].
3.5 Counter Electrode Catalyst
A catalyst is needed at the counter electrode for efficient reaction kinetics of the
redox couple. To date, the most widely used material for this has been platinum. A
sputter coated layer of platinum on the counter elelctrode was used as a catalyst
and served as a reflecting surface in initial DSSCs made at EPFL. However,
subsequent work has shown that while the presence of Pt is vital, the thickness of
the film has no significant effect on cell performance [43].
The method of choice for Pt deposition that has caught on since it was first
introduced offers a cheaper method to form a thin film of Pt by deposition from a
precursor solution composed of a 5mM solution of hexachloroplatinic acid or
platinum tetrachloride in anhydrous isopropanol. A few drops of this solution are
placed on the electrode and the solution is evaporated. The electodes are then
placed in a hot air furnace and their temperature is gradually increased at a ramp
temperature is recommended to be maintained for 10-15 minutes before cooling
[44].
Substantial work is being carried out to find viable alternates to Pt, primarily because
of its high cost. Deposition of amounts less than 0.1 µg/cm2 result in deterioration of cell performance [39] and large area cells could be significantly impacted by the cost
of such materials even if amounts less the 3 µg/cm2 are used [44]. A viable alternative is carbon and has been successfully used in DSSC modules [39]. A
variety of other materials have been experimented with including carbon, single and
multi-walled carbon nanotubes and conducting polymers and their composites [45],
however, search in this area continues to find a viable commercially applicable
alternative with competitive properties.
3.6 Electrical Contacts
Electrical contacts in DSSCs can be crucial to good cell performance as resistive
losses from the TCO layer can significantly affect photocurrent if the distance
between the photoactive TiO2 and electrical contact exceeds 1 cm [39, 46]. Highly corrosive iodine based electrolytes attack most metals including silver, aluminum,
copper, nickel and gold and this causes problems, especially when it comes to
designing integrated DSSC modules [39, 40]. For research lab applications it is
advantageous to coat the conductive glass contacts with silver paint or solder with
3.7 Sealing
Good sealing is essential to the longevity of DSSC in the outdoor environment.
However, the volatile and corrosive nature of the electrolyte makes the matter
complicated. Surlyn ionomer resin from Du Pont has long been the material of
choice for sealing of research based cells and has at least lasted six years of
stability testing exceeding outdoor temperatures of 70oC [47].
New methods for sealing have been proposed but are pending publication due to
pending patents. On the other hand Sharp Corporation Japan and Sony are current
leaders in submodule technology with confirmed efficiencies of over 8.2% [48] and
9.5% [49] respectively. Sony has recently reported an enhancement of up to 9.9%
on their modules using the concerto effect [50]. The sealing systems used in these
devices have not been disclosed [48, 49, 50].
3.8 Photovoltaic Characterization
The testing methodology for DSSCs is different from that of silicon based solar cells.
A study conducted to specifically address accurate photovoltaic measurement of
DSSCs in 2004 shows that the performance is dependent on sampling delay time
and that the average of forward and reverse bias experiments on DSSCs with dwell
measurements should therefore be carried out in forward and reverse sweep
directions with a dwell time of 40 ms or longer and an average of the results offers
the most reliable, accurate and reproducible assessment of photovoltaic
characteristics. An electrode area of 23.04 mm2 was used for experiments.
Furthermore, the overall conversion efficiency can also be affected by the amount of
light falling on the active area of the cell. The photoresponse of cells measured by
masking the cell around its active area was reported as the best approach to
accurately measure the photoresponse of the cells. This was done by masking cells
using an aperture to expose an area slightly larger than that of the active electrode
[23].
IPCE measurement of DSSCs is also subject to ambiguities akin to photovoltaic
measurement. A variety of approaches have been used for measurement such as
AC measurements using different chopping frequencies, variable intensity of bias
light and DC measurement in absence of bias light. A series of experiments
employing 5 x 50 mm electrode based cells have been reported in literature out to
Figure 3-2: Effect of frequency at constant bias (left) and different bias light at frequency of 0.7 Hz (right) on IPCE [85].
The photoaction spectra in Figure 3-2 show that chopping rates lower than 1Hz are
favored for DSSC measurement because of the slow response times of these
devices compared to those of conventional solar cells. Furthermore, flooding of
Figure 3-3: Comparison IPCE in DC and AC (1Hz, ca.10mA; 0.5 sun bias) modes [85].
Comparison of DC mode measurement and AC mode at 1Hz with 10mA light bias
4 SENSITIZER DYES
4.1 Overview of Sensitizers for DSSCs
While the performance of a DSSC is dependent on a variety of inter-related factors,
the dye plays a fundamental role in sensitization of large band-gap semiconductor
electrodes. This section takes an in depth look on the subject of sensitizer dyes for
DSSCs. Two of the benchmark sensitizers that have been produced to date, N-719
and N-749 refereed to as “Black Dye” in literature are shown in Figure 4-1.
The operating principle of the DSSC has been discussed earlier where the role of
dye has been introduced as being responsible for absorption of photons and charge
injection into the conduction band of TiO2. The mechanism of this injection is based on metal to ligand charge transfer (MLCT). The HOMO of the N-719 dye has been
calculated to be located around the –NCS and Ru core while its LUMO is around the
bipyridyl moieties and extends into the COOH groups [51]. The dye is anchored onto
the TiO2 at the COOH groups by the exchange of a proton. This causes spatial overlap between the LUMO level of the dye and the conduction band of TiO2 and results in the ultra-fast electron injection from the dye to the TiO2.
An ideal sensitizer for DSSCs should be panchromatic which means that it should be
sensitive to all wavelengths below a threshold of about 900nm. It should graft firmly
to the semiconductor oxide and inject electrons with a quantum yield of unity. It
should also have a high enough redox potential to undergo rapid reduction to be
efficiently regenerated by the electrolyte and should be able to sustain at least 108 redox turnovers that correspond to about 20 years of exposure to natural light [51].
Sensitizers which come close to satisfying this criteria are classified with the general
structure ML2(X)2, where L stands for 2,2’-bipyridyl-4,4’-dicarboxylic acid, M for Ruthenium or Osmium, and X for a halide, thiocyanate or water [28, 52]. The only
other dye to come close to the sensitization power of N-719 and its analogues has
been tri(cyanato)-2,2′,2′′-terpyridyl-4,4′,4′′-tricarboxylate)ruthenium(II) which is also
region. However, between the two dyes, the higher conversion efficiency record for a
research cell is still held by N-719 [53].
Ruthenium based complexes were the first to be developed and have shown the
highest conversion efficiencies in DSSCs but interest is increasing in the area of
organic sensitizers [54]. The working principle of organic sensitizers is similar to that
of metal complex systems. The HOMO of the dye is located around the donor group
shown in figure 4-2 whereas the LUMO is located close to the acceptor that is
anchored onto the TiO2 semiconductor nano-particles.
Figure 4-2: Schematic showing components of organic sensitizer dye anchored on TiO2.
To date, organic dyes have shown efficiencies of up to 9.8% in research cells and
stable performance that retained over 96% of initial function after 1000 hours of
promising new avenues for organic sensitizers that had faced the problem of lower
efficiencies compared to metal complex dyes along with stability issues.
It is most convenient to sub-classify dyes for DSSCs into two classes for the purpose
of a literature review. Ruthenium(II)–polypyridyl complexes which include the N-3
and Black Dye and their derivatives and metal free organic dyes. This section will
take a look at the development of Ruthenium(II)–polypyridyl complexes as
sensitizers and discuss their development while outlining strategies which have been
employed to enhance their properties for DSSCs.
4.2 Review of Ruthenium(II)-Polypyridyl Complexes
The first high performing Ruthenium(II)–polypyridyl complex developed for DSSCs,
published in the pioneering work by Grätzel was N-3 dye [15] and it is the
tetrabutylammonium hydroxide (TBAOH) salt of this dye with three TBAOH groups
per dye molecule that currently holds the world record for the highest efficiency of a
research DSSC measured as 11.18% [36]. The N-3 dye can reversibly converted
into N-719 by addition of 2 moles of TBAOH to the N-3 dye solution [36]. N-3 has
been preceded by polypyridyl complexes that have been under investigation as
redox sensitizers since much earlier with the most work put into
tris(2,2’-bipyridyl)ruthenium(II) and its homologues [56, 57]. However, significant solar
energy conversions were only seen when the carboxylated analog was developed
tris(2,2’-bipyridyl)ruthenium(II) [58]. The dye was adsorbed from slightly acidic water which
resulted in electrostatic attachment of its deprotonated carboxyl groups to the
protonated hydroxyl groups on TiO2. Using 0.1 M KI in aqueous 1mM HClO4 as electrolyte an IPCE of 73% at 470nm was reported [59].
Figure 4-3: Cis-X2Bis(2,2’-bipyridyl-4,4’-dicarboxylate)ruthenium(II) complexes (X = H2O, Cl-, Br-, I-, CN- or SCN-) [36].
A further improvement in results was reported in 1988 with a Ruthenium(II)-bipyridyl
complex cis-X2Bis(2,2’-bipyridyl-4,4’-dicarboxylate)ruthenium(II), where X= H2O as shown in Figure 4-3, that was able to achieve conversion efficiencies of 2% [60]. The
Figure 4-4: Photocurrent action spectrum for cis-Ru(II)L2(H2O)22–coated TiO2 films in 0.1 M aqueous NaI. Lower curve shows the photoresponse of TiO2 in the absence of sensitizer [60].
The photocurrent behavior of RuL3, RuL[Ru(bipy)2(CN)2]2 and RuL2(NCS)2 where L= 2,2’-bipyridyl-4,4’-dicarboxylate was reaffirmed after the first solar cell exceeding 7%
efficiency was published. Figure 4-5 shows the obtained IPCE spectra from this work
[61].
It is thought that the hydroxylation of TiO2 due to adsorption of dye from aqueous media could have led to purely electrostatic attachment of the dye. Because
RuL2(NCS)2 or N-3 can be adsorbed from ethanol, it can result in covalent binding of the carboxyl groups to coordinately unsaturated Ti4+ centers on the TiO
2, thus enhancing its ability to inject electrons into TiO2 [61].
A systematic study to determine the effect of the thiocyanate ligand was carried out
in 1993, that confirmed the superiority of cis-X2 Bis(2,2’-bipyridyl-4,4’-dicarboxylate)ruthenium(II) with X as SCN- over other analogues which included Cl-, Br-, I- and CN- [36]. Although it had previously been shown that the excited state lifetimes of such complexes are short [62], the work was warranted owing to the fast
injection dynamics of such compounds that were known to take place on a
femtosecond time scale [15, 16]. It was believed that the molecules could have
served as efficient electron injectors regardless of their short lived excited state
because the injection times would still have been relatively faster than excited state
relaxation.
The results explain the performance characteristics of N-3. The excited state
lifetimes of the compounds with halide and aqua ligands were short, around 110 ns
for the halides and 165 ns for the aqua ligands at 125 K and too short to be
measured at 298K. In contrast, excited state lifetimes of 960 ns and 1123 ns for the
longer excited state lifetimes contribute to better injection. The lower performance of
the molecules with the CN ligands could be attributed to the 41 nm blue shift in its
absorption maximum that limited its spectral response at longer wavelengths. The
lowering of response can also be seen from the photocurrent action spectra shown
in Figure 4-5. Inability of the CN based molecule to reach the high conversion of its
counterpart could be because its absorption maximum has to compete with the
absorbance wavelength of the electrolyte. Results from emission spectroscopy are
also in agreement with preceding observations with the halide and aqua based
ligand compounds showing a broad emission peak around 800nm when measured
at room temperature in contrast to distinct emission peaks for the dyes based on
NCS and CN ligands [36].
Studies on RuL[Os(bipy)2(CN)2]2 employing osmium as the metal centre have shown that such compounds do not perform well as sensitizers due to sluggish reduction of
dye from the redox system [52]. Other studies have shown that using Os(II)
complexes can extend the spectral response of TiO2 based cells but IPCEs show comparatively lower response than N-3 at some of the shorter wavelengths [63, 64].
This happens because direct population of low energy 3MLCT states is less forbidden in these systems, thereby allowing the presence of corresponding charge
Amongst the homologues of N-3 considered for study were isomers cis-X2 Bis(2,2’-bipyridyl-5,5’-dicarboxylate)ruthenium(II). A comparison of the structures of these
isomers used in the in the study are shown in Figure 4-6.
Figure 4-6: 2,2’-bipyridyl-4,4’-dicarboxylate (left) and 2,2’-bipyridyl-5,5’-dicarboxylate (right) [65, 66].
Results show that the 5,5’ substituted isomer has a more redshifted absorption
spectrum and shows stronger photoresponse at lower energy wavelengths.
However, figure 4.7 shows the overall photoresponse of these isomers is lower,
close to a maximum of 40% compared to over 70% at individual wavelengths of blue
light for the 4,4’ isomer.
The 5,5‘ isomer was also reported to have short excited state lifetimes at room
temperature that were within the response function of 21 ns for the instrument used
for analysis and could therefore not be measured. The short excited state lifetimes
suggest that the non radiative decay processes in 5,5‘ substituted compound,
cis-(cyanato)Bis(2,2’-bipyridyl-5,5’-dicarboxylate)ruthenium(II), are short enough to
compete with the electron injection process thereby resulting in a low photocurrent
response [66, 67].
Further investigation which included the 2,2’ bipyryridyl-3,3’-dicarboxylate analogue
of N-3 revealed even poorer performance owing stearic hindrance in the 3,3’ based
bipyridyl moiety. The rate of radioactive decay has been calculated to be higher for
the 3,3’ analogue as compared to N-3 because of a difference in dipole moment on
the basis of Fermi’s golden rule denoted by Equation 4.1. The rule states that the
rate of radioactive decay is proportional to the product of the square of the transition
dipole moment and the cube of the radiative energy gap between the 3MLCT and 1A 1 states (i.e., the energy of emission) [68].
Other variations in the series of Ru (II) dyes have been incorporation of biquinoline
which causes a red shift in the absorption spectra. However, such dyes yielded low
photocurrent efficiencies mainly due to lowering of the excited state potential of the
ruthenium complex such that it becomes less negative than the conduction band
edge (Ecb) of TiO2 [69, 70]. Some biquinoline based compounds show good photoresponse because their excited state reduction potentials lie slightly above the
conduction band of TiO2. However addition of tBP, which shifts the TiO2 conduction band to slightly more negative values causes a drastic decline in IPCE values and
total solar to electric conversion efficiencies [71].
Numerous other angles were probed to try and enhance the spectral response of the
dyes in the low energy wavelengths. Among these dyes were the isomers of N-3,
cis- and trans-dithiocyanatobis(2,2′-bipyridine-4,4′-dicarboxylic acid) ruthenium(II).
The absorbance spectra along with the structures of these compounds are shown in
Figure 4-8 [72]. Interestingly, it seems as though this approach was not followed in
subsequent works until the year 2000 when work was published showing that the
trans analog of N-3 showed better light harvesting properties with an efficiency of
8.6% as compared to 6.7% for N-3 under similar conditions [73]. The reported I-V
curves are shown in Figure 4-9. The trans complexes however, are not of much use
as sensitizers due to their thermal and photoinduced isomerization back to the cis
Figure 4-8: UV–Vis absorption spectra of cis- and trans -dithiocyanatobis(2,2′-bipyridine-4,4′-dicarboxylic acid) ruthenium(II) complexes [72].
The anchoring group of the dye not only serves to form efficient bonds with the
semiconductor oxide but its nature can affect the energy of the conduction band.
This is an indication that the anchoring group can be used to fine-tune the
performance characteristics of DSSCs. The most commonly employed anchoring
group is the carboxylic acid moiety, which serves to graft the dye molecules onto the
semiconductor surface by forming ester linkages. Many variations in anchoring
groups have been attempted such as esters, acid chlorides, carboxylate salts,
amides, sulphonic acid, silanes (SiX3), ethers, acetylacetonate, salicylates and hydroxymethyl groups but the most frequent replacement seen is the phosphonic
acid group. Compared to carboxylic analogues, the phosphonic acid dyes show a
blue shifted absorption spectrum. This difference has been speculated to be
because of the sp3 hybridization of the phosphorous atom in –PO3H2, which doesn’t favor interactions with the bipyridyl core. In contrast, the co-planarity between the
sp2 hybridized carbonyl carbons and bipyridyl moieties favors such interaction [65]. In general the stronger bonds formed between the semiconductor and phosphonic
acid groups contribute to long term stability of the cells as these groups are less
likely to be replaced by presence of water which may seep into the cell in the
outdoor environment. However, the blue shifted absorption is known to adversely
affect conversion efficiencies. The efficiency for a phosphonic acid anchoring group
Another variation in the anchoring group that has shown promising results is the
carboxyvinyl group shown in Figure 4-10. Incorporation of the vinyl causes a
welcome red shift in the absorption spectrum as compared to N-3. An overall
conversion efficiency of 8.64% has been demonstrated using this dye potentially
providing avenues for further work [76].
Figure 4-10: Structure of Ru(L2 )(NCS)2 where L = 4,4′-bis(carboxyvinyl)-2,2′-bipyridine [76].
Over the years, the trend has been to develop sensitizers with higher extinction
coefficients and red shifted absorbance spectra. A variety of novel ligands have
are shown in Figure 4-11. A more comprehensive list can be found in a review article
published in 2007 [65].
A,
4,4’-dihexyl-2,2’-bipyridine(dmbpy) B, 4,4’-dinonyl-2,2’-bipyridine(dmbpy) C, 4,4’-ditridecyl-2,2’-bipyridine(dtdbpy)
D,
4,4’-bis(p-methoxystyryl)-2,2’-bipyridine E, 4,4’-di(2-(3,6-dimethoxyphenyl)-ethenyl)-2,2’-bipyridine F, 4,4’-bis(p-hexyloxystyryl)-2,2’-bipyridine
G, 2,2’:6’,2”-terpyridine-4’-(4-carboxylic acid) phenyl
H, 4-CH3 ,4’-N,N-(di-p-anisylamino)phenoxy
methyl-2,2’-bipyridine
I, 10-((2-(4-methylpyridin-2-yl)pyridin-4-yl)methyl)-
10H-phenothiazine
A systematic study involving the incorporation of alkyl chains on the non-anchoring
ligands shown in Figure 4-11 A, B and C showed blue shifted absorbance spectra as
compared to N-3 and lower conversion efficiencies. While efficiencies increased
slightly with increasing chain length, the key benefit gained by increasing the length
of the alkyl chain was enhanced hydrophobicity which contributed to long term
stability of cells due to decreased susceptibility of dye desorption because of
seepage of water into the cell [77].
In 2001 a breakthrough was made with the development of a new class of Ru (II)
terpyridyl compounds on the basis of which the “Black Dye” was developed [78].
Figure 4-13 shows the IPCE spectrum for black dye with a marked enhancement in
photoresponse in the near infra-red region as compared to N-3. The reported
conversion efficiency with this dye using a cell of 0.1863 cm2 research cell was 10.4% as certified by NREL [78]. The extinction coefficient in DMF at 600 nm for the
complex used in measurements was around 7640 M-1cm-1, improving on which could help absorb more light using thinner TiO2 films. A key problem for the Black dye is its lower adsorption onto TiO2, as compared to N-719, due to its anionic nature [78]. Addressing these points could significantly enhance the performance of cells made
using these complexes.
Figure 4-13: IPCE spectra for RuL2(NCS)2 (N-3) and RuL’(NCS)3 (Black Dye) with two carboxylic acid moieties deprotonated with TBAOH [78].
In 2006 an efficiency of 11.1%, certified by the National Institute of Advanced
optimization of TiO2 scattering layer thicknesses to increase haze [24]. Figure 4-14 shows the corresponding IPCE spectra.
Figure 4-14: Dependence of IPCE spectra on haze of TiO2 [24].
Among the more recently developed Ru complexes with higher extinction
coefficients and red shifted absorption spectra compared to N-719 is the CYC-B11
shown in Figure 4-15. The dye boasts a record conversion efficiency of 11.5%
measured on a research cell with an active area of 0.158cm2 [79]. This is the highest efficiency for a research cell that has been reported to date. However, details on I-V
Figure 4-15: Molecular structure of CYC-B11 [79].
The high performance of the CYC-B11 can be attributed to its higher extinction
Figure 4-16: Electronic absorption spectra of CYC-B11, its anchoring and ancillary ligands in DMF[79].
While it may be clear that enhancement of extinction coefficients at longer
wavelengths is the key to enhancing conversion efficiencies of DSSCs, the
complexity of mechanisms taking place involved in generating electricity with these
cells has fueled alternate approaches to intelligent dye design. The structure of
N845 shown in Figure 4.17 demonstrates the attachment of a donor group to the
Figure 4-17: Molecular structure of N845 [80].
The donating group replenishes the demand for an electron of the ruthenium core
upon electron injection into the conduction band of TiO2. The positive charge on the dye is thus effectively transferred away from the surface of the TiO2. This retards charge recombination by loss of an electron back into the dye by a thousand fold
![Figure 1-1: Spectra of the extraterrestrial AM 0 radiation and AM 1.5G standard solar reference radiation [6]](https://thumb-us.123doks.com/thumbv2/123dok_us/1512909.1185338/18.612.93.536.279.638/figure-spectra-extraterrestrial-radiation-standard-solar-reference-radiation.webp)
![Figure 1-2: Current photovoltaic research-cell efficiencies (figure by L. Kazmerski, National Renewable Energy Laboratory (NREL) [7]](https://thumb-us.123doks.com/thumbv2/123dok_us/1512909.1185338/20.612.94.537.79.364/current-photovoltaic-research-efficiencies-kazmerski-national-renewable-laboratory.webp)
![Figure 1-4: US PV market breakdown [8].](https://thumb-us.123doks.com/thumbv2/123dok_us/1512909.1185338/22.612.114.537.73.368/figure-us-pv-market-breakdown.webp)
![Figure 1-5: Area-related price and power output for various technologies [9].](https://thumb-us.123doks.com/thumbv2/123dok_us/1512909.1185338/23.612.91.537.210.440/figure-area-related-price-power-output-various-technologies.webp)
![Figure 2-3: Schematic energy diagram of kinetic processes in dye sensitized solar cells [5, 15, 16]](https://thumb-us.123doks.com/thumbv2/123dok_us/1512909.1185338/29.612.126.518.81.368/figure-schematic-energy-diagram-kinetic-processes-sensitized-solar.webp)

![Figure 3-3: Comparison IPCE in DC and AC (1Hz, ca.10mA; 0.5 sun bias) modes [85].](https://thumb-us.123doks.com/thumbv2/123dok_us/1512909.1185338/43.612.127.501.73.363/figure-comparison-ipce-dc-and-ac-bias-modes.webp)
![Figure 4-1: The structures of N-719 (left) and Black Dye (right) [51].](https://thumb-us.123doks.com/thumbv2/123dok_us/1512909.1185338/44.612.90.536.288.588/figure-structures-n-left-black-dye-right.webp)
![Figure 4-3: Cis-X2Bis(2,2’-bipyridyl-4,4’-dicarboxylate)ruthenium(II) complexes (X = H2O, Cl-, Br-, I-, CN- or SCN-) [36]](https://thumb-us.123doks.com/thumbv2/123dok_us/1512909.1185338/48.612.206.408.179.418/figure-cis-bis-bipyridyl-dicarboxylate-ruthenium-complexes-scn.webp)
