
ABSTRACT
AYERS, MARTIN WILLIAM PAUL. Lithium-Oxygen Batteries – A Comprehensive Finite Element Model. (Under the direction of Dr. Hsiao-Ying Shadow Huang.)
The development of improved energy storage technologies with greater specific
energies is critical to the success and development of electric vehicles and renewable energy
products. Among the different energy storage technologies under study, lithium-oxygen
batteries are one of the most promising due to their great gravimetric energies and capacities
6-10 times greater than other technologies such as conventional lithium-ion cells.
Lithium-oxygen batteries still pose several challenges before they can be commercialized. Some of
the most prominent and important issues that require investigating with lithium-oxygen
batteries are the formation of dendrites on the anode surface as well as the buildup of
precipitate (Li2O2) within the cathode. The objective of this research is to develop a
comprehensive understanding of how the anodic and cathodic designs and parameters affect
the discharge characteristics of lithium-oxygen cells through the use of the finite element
method and computational fluid dynamics software ANSYS Fluent. Using these programs,
three lithium-oxygen battery models were constructed with varying anode surface
homogeneities and dendrite structures. The discharge characteristics were collected and
compared to assess the overall performance of the cells. The finite element models consider
each of these previously mentioned issues to gain an understanding of their collective effect
on the performance of a lithium-oxygen cell. This comprehensive understanding will aid in
© Copyright 2015 Martin W.P. Ayers
Lithium-Oxygen Batteries – A Comprehensive Finite Element Model
by
Martin William Paul Ayers
A thesis submitted to the Graduate Faculty of North Carolina State University
in partial fulfillment of the requirements for the degree of
Master of Science
Mechanical Engineering
Raleigh, North Carolina
2015
APPROVED BY:
_______________________________ _______________________________
Dr. Hsiao-Ying Shadow Huang Dr. Kara Peters
DEDICATION
To my parents, David and Beth Ayers, for their support throughout my academic career and
forever encouraging me to pursue excellence.
My brother and sister, Danny and Jaci.
And the NYE group
BIOGRAPHY
Martin William Paul Ayers was born in Ottawa, Canada on July 27th, 1990. His
family moved throughout the United States, from the East Coast to the Midwest, before
settling in Raleigh, North Carolina when Martin was 13 years old. He attended Athens Drive
High School before pursuing an undergraduate degree at the University of North Carolina at
Charlotte. While attending UNC Charlotte, Martin discovered his passion for learning which
led him to pursue dual Bachelor of Science degrees in Mechanical Engineering and Physics
with a minor in Economics. His undergraduate concentration was in Energy Engineering in
which his final engineering project and technical elective courses focused on energy
production and energy policy in the United States. Upon completing his undergraduate
degree in May of 2013, Martin moved back to Raleigh, North Carolina to work as an intern
at Highwoods Properties to work on the Energy Engineering team. Martin began to pursue
his Master of Science degree in Mechanical Engineering at North Carolina State University
the following August to further sharpen his technical skills expand his knowledge on energy
related technologies. Throughout his graduate career, Martin did research on lithium-oxygen
ACKNOWLEDGEMENTS
I would like to thank North Carolina State University for giving me the opportunity to
pursue my graduate degree in a world-class school of Engineering. It has been an honor and a
privilege to attend classes and pursue my research with the diverse faculty and students of the
University. My experiences at the University have shaped me as an engineer and provided
me with the technical acumen and confidence to go forth and pursue my career and
professional goals.
I would like to thank my family and friends for their ongoing support and
encouraging me to challenge myself each and every day of graduate school.
To my fellow lab mates in the Laboratory for Mechanics of Energy Materials and
Biological Tissues, whom I worked alongside of for many hours, I would like to thank you
for encouraging me to push forward with my research and class work.
I would like to thank the members of my committee, Dr. Kara Peters and Dr. Alexei
Saveliev, for providing me their valuable input on my thesis and research project. The classes
taught by these professors directly contributed to my academic and professional development
through graduate school.
Most of all I would like to thank my advisor, Dr. Hsiao-Ying Shadow Huang for
reaching out to me when I was still completing my undergraduate degree and helping me
make my decision to come to NCSU; whose continued guidance made this all possible.
TABLE OF CONTENTS
LIST OF TABLES ... vii
LIST OF FIGURES ... viii
CHAPTER 1: INTRODUCTION ...1
1.1 Lithium-Oxygen Batteries ...1
1.2 The Demand for Batteries ...3
1.2.1 Electric Vehicles ... 5
1.3 Government Funded National Labs and Private Research ...7
1.3.1 Argonne National Laboratory ... 7
1.3.2 NASA Glenn Research Center ... 8
1.3.3 Yardney Technical Products, Inc... 9
1.4 Objectives of the Study ...11
CHAPTER 2: LITERATURE REVIEW...13
2.1 Lithium Oxygen Batteries Attractive Properties ...13
2.2 Challenges with Lithium-Oxygen Batteries ...14
2.3 Transport Limitations in Li-O2 Batteries ...18
2.3.1 Li2O2 Distribution in Cathodes ... 22
2.4 Formation of Discharge Product (ORR) – Li2O2 ...25
2.5 Li2O2 Reactivity with Carbon Cathodes ...30
2.6 Lithium Dendrite Growth in Lithium Metal Batteries ...33
2.6.1 Dendrite Growth in Lithium/Polymer Cells ... 35
2.6.2 Dendrite Growth in Li-O2 Cells with Ionic Liquid... 38
2.7 Dendrite Growth and Battery Capacity Loss ...40
2.8 Computational Modeling of Lithium Dendrite Growth ...41
2.9 Mitigating Dendrite Growth ...44
CHAPTER 3: MODEL DEVELOPMENT ...49
CHAPTER 4: SIMULATION RESULTS ...56
4.1 Flat Anode vs. Small Dendrite Model ...56
4.2 Comparisons of Flat Anode, Small Dendrite, and Long Dendrite Models ...62
4.3 Small Dendrite Model vs. Long Dendrite Model ...66
4.4 Capacity Loss – Experimental Results vs. Computational Modeling ...70
4.5 Cathode Porosity Effect on Discharge Properties ...71
4.5.1 Adjusting Cathode Porosity – Flat and Small Dendrite Models ... 71
4.5.2 Adjusting Cathode Porosity – Dendrite Models ... 77
4.6 Mass Fraction of O2 on Discharge Properties ...79
4.6.1 Mass Fraction of O2 Effect on Flat Anode Model ... 79
4.6.2 Mass Fraction of O2 Effect on Dendrite Models ... 82
4.7 Mass Flow Rate of O2 Effect on Discharge Properties ...85
CHAPTER 5: SUMMARY AND CONCLUSIONS ...88
5.1FUTURE WORK ...90
REFERENCES ...92
APPENDIX ...97
Appendix A: ANSYS Project Reports ...98
A1: Geometry and Mesh of the Flat Anode Model ... 98
A2: Fluent Iterations of Flat Anode Model ... 101
A3: Mesh of the Long Dendrite Anode Model... 108
A4: Fluent Iterations of Long Dendrite Anode Model ... 109
A5: Mesh of the Small Dendrite Anode Model ... 116
A6: Fluent Iterations of Small Dendrite Anode Model ... 117
LIST OF TABLES
Table 1: Physical properties of common Lithium-oxygen and Li-ion battery discharge
products (and Li metal) [2] ...4
Table 2: Summary of Calculations and Results to Present ...12
Table 3: Formula Constants and Parameters of Butler-Volmer Formulas [30] ...50
Table 4: Material Properties of Lithium-Oxygen Battery Reactants ...54
LIST OF FIGURES
Chapter 1
Figure 1: Lithium-ion battery vs. Lithium-oxygen battery. (a) Conventional lithium-ion battery (b) Lithium-oxygen battery (c) Schematic of dendrite forming on anode surface and effects on battery cell [3]. ... 2
Figure 2: Sales of Plug-In electric vehicles. Numbers include both all electric vehicles (EVs) and plug-in hybrid electric vehicles (PHEVs). These numbers do not include non-plug-in hybrid vehicles [5]. ... 6
Figure 3: The experimental lithium-oxygen battery cell used in the experiments by Reid et al. The battery itself was developed by Yardney Lithium [7] ... 9
Figure 4: An SEM image of the porous cathode used in the experiments conducted by Yardney Technical Products [8]. ... 10
Chapter 2
Figure 5: Estimated Gravimetric and Volumetric Energy Densities of Practical LiCoO2 and Lithium-Oxygen Batteries [1] ... 14
Figure 6: Cyclability of Lithium-Oxygen Cells with Carbonate Electrolytes [2] ... 16
Figure 7: Oxygen Reduction Reaction Schematic [1] ... 18
Figure 8: Air-Cathode Capacity Restriction with Carbon Black Cathode Materials. (A) Small discharge rates leasing to Li2O2 forming within cathode with poor conduction characteristics leading to poor volume utilizations. (B) Higher discharge rates leading to transport issues and cathode clogging [13]. ... 19
Figure 9: Different structures of Graphene and Carbon Nanotubes (a) Single wall carbon nanotube (b) multi-walled carbon nanotube (c) Single graphene sheet (d) a crumpled
graphene sheet configuration [13]. ... 21
Figure 10: Li2O2 Formation within cathode. From left to right, increase oxygen diffusion rates: (a) DO2=0.5 (b) DO2=1 (c) DO2=3. Increasing diffusion coefficient of O2 resulted in increased precipitation growth of 1.8 and 3.8 times for cases (b) and (c), respectively [9]. .. 23
Figure 11: (Top) Lithium concentration for cases a, b, and c from Figure 10 (Bottom)
Oxygen concentration for cases a, b, and c from Figure 10 [9]. ... 24
Figure 12: SEM Images of Discharged Toroid-Like Particles [1]. ... 26
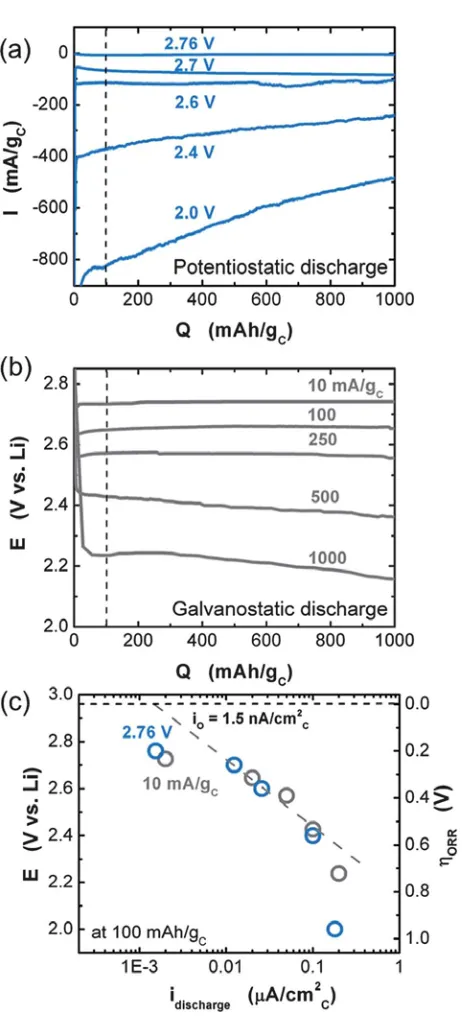
Figure 13: (a) Discharge current vs. capacity of lithium-oxygen cell with CNT. Discharged potentiostatically from 2.76 to 2.0 V (b) Discharge current vs. capacity of lithium-oxygen cell with CNT. Discharge galvanostatically from 10 to 1000 mA/gc (c) Tafel plot of
Figure 14: Discharge curve of lithium-oxygen battery. Through discharge, the cell voltage slowly deceases to 2.6 V due to increasing discharge products where voltage dropped off and ORR stops [18]. ... 29
Figure 15: Li2O2 morphology as the lithium-oxygen cell goes through discharge [18]. ... 30
Figure 16: Morphology of Li2O2 and Li2CO3 on Carbon Nanotubes [1]. ... 31
Figure 17: (a) Growth of Li2CO3 through cycling (b) Effect of parasitic products on charging voltage [1]. ... 32
Figure 18: (a) Needle-Like Dendrite Formation (b) Bush-Like Dendrite Formation [12]. ... 33
Figure 19: Dendrite Length in Ionic Liquid as a function of time [22]. ... 35
Figure 20: High-Current density discharge within lithium/polymer cell [23]. ... 36
Figure 21: Low current density resulting in the formation of the thin needle-like dendrite [23]. ... 37
Figure 22: Morphology of Lithium Dendrite Growth at Different Current Densities [22]. .. 39
Figure 23: Lithium metal cell capacity vs. cycle number at different cycling rates [24]. ... 40
Figure 24: Schematic of System Modeled by Monroe et al. [11]. ... 42
Figure 25: Dendrite Growth with Uniform and Step-Function Diffusion Coefficients (a) Dendrite Position (b) Lithium-ion Concentration at Dendrite Tip (c) Kinetic Potential at Dendrite Tip [12]. ... 43
Figure 26: The change in cell capacity as the battery is cycled. Each line represents a
different amount of lithium metal used in the initial anode [29]. ... 45
Figure 27: Images using SEM technique of Li-O2 anode surface after 10 cycles (a) Li = 0.9 mg (b) Li = 7 mg (c) Li = 14 mg [29]. ... 46
Figure 28: Lithium Deposition Process through “self-healing process” [21]. ... 48
Chapter 3
Figure 29: Schematic of PEM Fuel Cell for Fluent Fuel Cell Module [30]. ... 51
Figure 30: Schematic of x-y plane of lithium-oxygen cell with flat, homogeneous anode surface(not drawn to scale). ... 52
Figure 31: Schematic of x-y plane of lithium-oxygen cell with small dendrites on lithium metal surface (not drawn to scale). ... 53
Figure 32: Normalized I-V Curve of Flat and Small Dendrite Models. The Flat model portrays a better performing cell since the discharge voltage does not fall as quickly as the dendrite model when the discharge voltage is lowered to 2.6 V. ... 57
Figure 34: Contour Plots of Flat and Small Dendrite Models at 2.75 V and 2.70 V ... 60
Figure 35: Contour Plots of Flat and Small Dendrite Models at 2.65 V and 2.60 V ... 61
Figure 36: I-V curve of flat, small, and long dendrite models at a cathode porosity of 0.75. As the dendrites grew to represent a cell that had been continuously cycled, the discharge current of the cell greatly decreased. ... 63
Figure 37: Normalized kMol of Li2O2 Formation of Flat, Small, and Long Dendrite Models at cathode porosity of.75. The lower the discharge voltage, the greater the kMol of Li2O2 formed. ... 64
Figure 38: Contour plots of the formation of Li2O2 within the cathode of the three different anode models at different discharge voltages. Note the depth of discharge of the flat anode as well as total amount of Li2O2 formed is much greater. ... 65
Figure 39: I-V Curve of the long dendrite and small dendrite models. A porosity of 0.75 was used for each model. The discharge current was normalized based on the values of the small dendrite model. ... 66
Figure 40: Amount of discharge product forming in the cathode of the dendrite models. A cathode porosity of 0.75 was used. The formation of Li2O2 was normalized based on the values of the small dendrite model. ... 67
Figure 41: Contour plots of the two dendrite models. A cathode porosity of 0.75 was used. The scaling of the images shows a much higher depth of discharge in comparison to the previous contour plots in Figure 38. The total cathode utilization of the small dendrite model was much greater than the long dendrite model’s utilization. ... 69
Figure 42: I-V Curve of Flat and Small Dendrite Models at Varying Porosities. Varying porosites had little effect on polatization curves of cells. ... 72
Figure 43: Normalized kMol of Li2O2 Formation of Flat and Small Dendrite Models at cathode porosities of 0.25, 0.5, and 0.75. The lower the discharge voltage, the greater the kMol of Li2O2 formed. ... 73
Figure 44: Contour Plots of Flat Model at 2.75 V and 2.70 V ... 75
Figure 45: Contour Plots of Small Dendrite Model at 2.75 V and 2.70 V ... 76
Figure 46: I-V Curve of Small Dendrite and Long Dendrite Models at Varying Porosities. Varying porosites had little effect on polatization curves of cells. ... 77
Figure 47: Normalized kMol of Li2O2 Formation of Flat and Small Dendrite Models at cathode porosities of 0.25, 0.5, and 0.75. The lower the discharge voltage, the greater the kMol of Li2O2 formed. ... 78
Figure 48: I-V Curve of Flat Model with Limited Oxygen. Decreasing the amount of oxygen to react in cell decreases the discharge current faster than the cell with more oxygen. ... 80
Figure 50: Contour Plots of Flat Anode Model at different mass fraction of O2. Mass fraction of O2 of 0.75 shown on the left. Mass fraction of O2 of 1 shown on the right. ... 82
Figure 51: I-V Curve of dendrite models with a 25% reduction in mass fraction of oxygen available in cathode. ... 83
Figure 52: Formation of Li2O2 within cathode of cells with a 25% reduction in mass fraction of oxygen available in cathode. ... 84
Figure 53: I-V Curves of Flat and Dendrite models at increased oxygen mass flow rate through battery cell. The I-V curves of the dendrite models are significantly decreased
compared to the values of the flat anode model. ... 85
Figure 54: The kMol of discharge product within the cathodes of the flat and dendrite
CHAPTER 1: INTRODUCTION
1.1 Lithium-Oxygen Batteries
Lithium-oxygen batteries, also commonly referred to as lithium-air batteries, have
received a great deal of attention over the years due to their high theoretical gravimetric
energies and energy densities [1]. These batteries can theoretically supply a car with power
and speed characteristics comparable to gasoline. A big reason these lithium-oxygen batteries
have such greater theoretical energy densities and gravimetric energies is because they do not
require a transport metal (such as Cobalt, Co) to bond to the lithium as it travels between the
electrodes of the battery [2]. Without the need of a heavy transport metal, the gravimetric
energies of the battery are increased [2].
Lithium-oxygen batteries are composed of three different parts: a pure lithium metal
anode, electrolyte, and a cathode. The three components work together to store and release
energy through charging and discharging of the battery cell. While the cell discharges,
lithium undergoes an oxidation process, releasing electrons through the circuit and moving to
the cathode where the lithium bonds with oxygen to form lithium peroxide (Li2O2). Through
charging, a high voltage is applied to the cell leading to a reduction reaction and the lithium
bonding again with the lithium metal anode [2].
A basic schematic of a lithium-oxygen battery can be seen in Figure 1. In this diagram
structure. These two electrodes are separated by some type of electrolyte. During discharging
of the battery, electrons are released from the lithium into the circuit resulting in positively
charged lithium-ions within the battery. The positive lithium-ions then travel through the
electrolyte and bond with the negatively charged oxygen to form Li2O2 [2]. During charging,
a specified voltage and current is applied to the battery to reverse this process. Another
unique characteristic of the battery is the theoretical ability of the battery to absorb and
release oxygen into the atmosphere as needed, again leading to greater theoretical
gravimetric energies since the oxygen does not have to be stored within the battery [2].
Figure 1: Lithium-ion battery vs. Lithium-oxygen battery. (a) Conventional lithium-ion battery (b) Lithium-oxygen battery (c) Schematic of dendrite forming on anode surface and effects on battery cell [3].
Lithium-oxygen batteries are part of a larger group of batteries known as
lithium-metal batteries that are characterized by their pure lithium lithium-metal anodes instead of a graphite
type anode commonly seen in ion batteries. Another interesting property of a
lithium-oxygen battery is the lithium-oxygen permeable layer on the cathode. This layer acts between the
outer cathode surface and the atmosphere. The permeable layer is designed to allow oxygen
oxygen is no longer needed [2]. While some lithium-oxygen battery designs do omit the
oxygen permeable layer by including a small oxygen storage tank as part of the battery
design, these cells have significantly smaller volumetric energies
1.2 The Demand for Batteries
As the global demand for energy increases, the need for suitable energy storage
devices continues to grow. Our current energy storage technology of choice is the lithium-ion
battery which is commonly found in handheld devices, electric vehicles, and other portable
electronics. Since the lithium-ion battery was first introduced in the mid-1970s, it has grown
to become an extremely popular commercial technology with specific energies of 0.58
kWh/kg and 2.09 kWh/L for the LiFePO4 discharge product [2]. While one of the main
benefits of a lithium-ion battery is the technology’s maturity and cyclability, lithium-oxygen
batteries present great benefits with their greater theoretical energy. As seen in Table 1
below, the discharge product Li2O2 has theoretical specific energies of 3.46 kWh/kg and 7.99
kWh/L [2].
With the greater theoretical energies of lithium-oxygen batteries, there is a great
potential for these batteries to be used in many different applications. These applications
range from electric vehicle applications to reduce “range-anxiety” to portable electronic
energy storage. With the growing interest in renewable energy sources such as solar and
wind, lithium-oxygen batteries also pose a benefit for storing the energy generated by the
1.2.1 Electric Vehicles
With the continuous rise in oil prices leading to the rise in the price of gasoline, the
demand for electric vehicles has continued to grow since they came back on the market in
2010. Although oil prices have fallen as of late, it is widely believed that the low price of oil
is temporary and will eventually rise again, raising the price of gasoline as well.
The idea of electric vehicles is old and has been around as long as cars have been on
the road. But while the idea of electric vehicles (EVs) has been around for some time, the
battery technology needed for these ideas has not been up to the task until recently. This was
seen with the development of the GM EV-1, a battery powered car that was released in 1996
and ran off of lead-acid batteries and had an advertised range of 70-100 miles. The car was a
disaster and was scrapped several years later [4]. In 2010, EVs were reintroduced to the
market and sales have been growing ever since. Figure 2 below portrays the sales of pure
electric vehicles and plug-in electric vehicles (PEVs) each year in the United States [5]. Even
in 2014, with gas prices beginning to fall in the United States, the sales of plug-in vehicles
Figure 2: Sales of Plug-In electric vehicles. Numbers include both all electric vehicles (EVs) and plug-in hybrid electric vehicles (PHEVs). These numbers do not include non-plug-in hybrid vehicles [5].
The electric vehicles on the road today use lithium-ion battery technology, utilizing
huge battery packs that can often take up most, if not all, of the undercarriage of the vehicle.
These batteries at best can deliver a 200 mile range in the Tesla Model-S while other electric
vehicles such as the Nissan Leaf, can only go 75-120 miles on a single charge. These
relatively short ranges are due to the possible energy densities of the battery packs requiring
large and heavy packs installed in these vehicles. With further development of the
lithium-oxygen battery, it is theoretically possible to install batteries that can delivery 4-6 times the
vehicle range due to the greater specific energies.
345 17,735 52,835 96,702 118,773 0 30000 60000 90000 120000
2010 2011 2012 2013 2014
1.3 Government Funded National Labs and Private Research
Many nationally recognized labs have been conducting extensive research on
lithium-oxygen batteries for years. Some of the more notable research that has been conducted in
these labs has been briefly summarized below. A more extensive review of previous
lithium-oxygen battery research is presented in Chapter 2.
1.3.1 Argonne National Laboratory
Argonne National Laboratory has been conducting research on lithium-oxygen
batteries for several years. A team of engineers and scientists led by Khalil Amine and
Michael Thackeray has begun to develop their own lithium-oxygen batteries that will have
the capacity to store five to ten times the energy of conventional lithium-ion batteries [6].
The interdisciplinary staff at Argonne National Labs has developed a deep understanding of
the challenges of lithium-oxygen batteries and has been using this understanding to develop a
safe rechargeable lithium-oxygen battery for the last five years [6]. With their extensive
experience researching and developing lithium-ion batteries, the researchers at Argonne
National Labs have access to the most advanced research facilities such as their Advanced
Photon Source, the Center for Nanoscale Materials, and some of the world’s fastest super
1.3.2 NASA Glenn Research Center
Groups working at the NASA Glenn Research Center have been developing their own
lithium-oxygen battery with a theoretical specific capacity of 11,400 Wh/kg. The batteries
under investigation by Reid et al. are being developed for Mobile Oxygen Concentrators,
equipment that requires extremely lightweight energy storage [7]. Their group is constructing
their own battery cells for experiments with various cathode catalysts and carbon cathode
structures to develop a cathode with the optimal active surface area [7]. Other experiments
are underway to stabilize the lithium metal surface and prevent dendrite growth on the pure
lithium metal anode [7]. One of the experimental cells used in their experiments is shown in
Figure 3 below. It is important to note that the work published by Reid et al. is done on
primary lithium-oxygen batteries, meaning these experimental cells are not designed to be
Figure 3: The experimental lithium-oxygen battery cell used in the experiments by Reid et al. The battery itself was developed by Yardney Lithium [7]
1.3.3 Yardney Technical Products, Inc.
Dobley et al. have published work of their own to develop a higher capacity
lithium-oxygen battery by incorporating transition metal catalysts with improved cathode structures.
While it is widely known that the main limiting factor in lithium-oxygen battery cells is the
poor rate of oxygen diffusion within the positive electrode [8]. Recognizing this as the
limiting factor of lithium-oxygen batteries, Dobley et al. focused on developing and
improving the cathode design and structure [8]. The air cathode used is a layered structure of
carbon composite, constructed using carbon, a metal Manganese (Mn) catalyst, and a Teflon
increasing the discharge rate of the cell by two times resulted in less than half of the capacity
loss of the cell – likely due to poor clogging in their carbon cathode structure [8]. Figure 4
below shows the SEM images of the porous carbon cathode used in their experiments.
Figure 4: An SEM image of the porous cathode used in the experiments conducted by Yardney Technical Products [8].
The interest in developing future energy storage technologies such as lithium-oxygen
and lithium metal batteries is apparent from the extensive research conducted by national and
private labs. Despite this continuous work, there is still a great opportunity to contribute to
this conversation and help develop the general understanding of these battery cells. The
research presented in this study aims to help develop our understanding of anode and cathode
1.4 Objectives of the Study
Many of the problems with lithium-oxygen batteries can be categorized as issues
related to either the lithium-metal anode or the carbon cathode structure. Both electrodes
provide their own challenges for developing a commercially viable lithium-oxygen battery.
Many studies have been published to better understand the morphology and formation of
lithium dendrites on metal anodes and model the growth of dendrites in lithium-oxygen cells
using numerical methods. At the same time extensive work has also been done to model the
precipitate growth (Li2O2) within the cathode numerically and through in-situ techniques
[9-12]. Despite these studies, the effects of dendrite growth on the formation of Li2O2 within the
cathode at discharge have not been studied together to a satisfactory degree. The main
objective of the study is to complete our own comprehensive finite elements model of a
lithium-oxygen battery that can take into account the structure of the lithium metal anode as
well as various design aspects of the carbon cathode to understand how these different
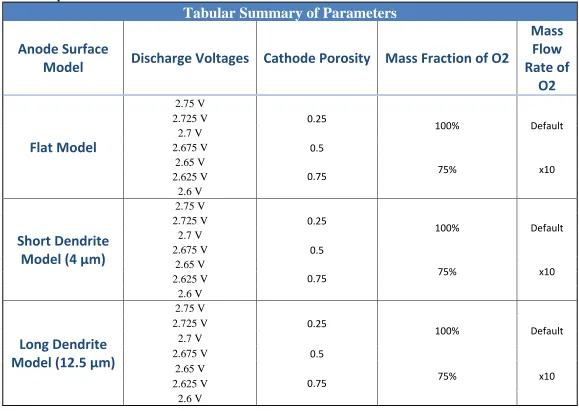
behaviors affect the discharge performance of a lithium-oxygen battery. Table 2 below
Table 2: Summary of Calculations and Results to Present
Tabular Summary of Parameters
Anode Surface
Model
Discharge Voltages Cathode Porosity Mass Fraction of O2
Mass
Flow
Rate of
O2
Flat Model
2.75 V 0.25 2.725 V100% Default
2.7 V
2.675 V 0.5
2.65 V
75% x10
2.625 V 0.75
2.6 V
Short Dendrite
Model (4 μm)
2.75 V
0.25
2.725 V
100% Default
2.7 V
2.675 V 0.5
2.65 V
75% x10
2.625 V 0.75
2.6 V
Long Dendrite
Model (12.5 μm)
2.75 V
0.25
2.725 V
100% Default
2.7 V
2.675 V 0.5
2.65 V
CHAPTER 2: LITERATURE REVIEW
2.1 Lithium Oxygen Batteries Attractive Properties
Lithium-oxygen batteries have been receiving a lot of attention in the last few years due
to their great theoretical gravimetric energies and energy densities when compared to current
lithium-ion batteries. One of the great advantages of lithium-oxygen is that instead of relying
on intercalation reactions where the electrode crystal structure is maintained, these
technologies use a conversion reaction where the electrode crystal structure is altered [1].
In the lithium-oxygen battery, the oxygen ions within the cathode are reduced by
electrons and bond with lithium ions that travel from the anode, without any type of transport
metal (such as Co). These products help to form 𝐿𝐿2𝑂2 as shown in equation 1 below.
2𝐿𝐿+𝑂2 =𝐿𝐿2𝑂2 (1)
Gravimetric energies of lithium-oxygen are calculated to range between 1800-2800 Wh/kg.
The range largely comes from various possible electrode materials in non-carbonate
electrolytes. With typical lithium-ion batteries showing gravimetric energies of about 600
Wh/kg, lithium-oxygen batteries may have 3-5 times higher specific energies [1].
Figure 5 displays the advantage of lithium-oxygen batteries over typical lithium-ion
batteries but also shows that the calculated volumetric energy densities of the batteries are
battery can be constructed with specific energies between 700 and 800 Wh/kg [1].
Figure 5: Estimated Gravimetric and Volumetric Energy Densities of Practical LiCoO2 and
Lithium-Oxygen Batteries [1]
There are many different issues that must be addressed before cyclable
lithium-oxygen batteries can be made commercially available. To address many of these issues such
as finding a stable electrolyte and lithium metal electrode, the oxygen reduction and
evolution reaction mechanics must be further understood.
2.2 Challenges with Lithium-Oxygen Batteries
Despite some of the major advantages of lithium-oxygen batteries, there are still
several major challenges that must be overcome before these batteries will be available for
of the lithium metal anode, designing an applicable oxygen permeable membrane, and
accommodating volume changes within the cell [2].
One of the main barriers to developing a suitable lithium-oxygen battery is the design
of a suitable electrolyte that will promote a cyclable reaction within the cell. Carbonate
solvents have proven to be poor candidates for these systems due to the fact that CO2
becomes a discharge product rather than O2 as the battery is charged [2]. This leads to Li2O2
not being a principal discharge product and therefor limits the cyclability of a cell with
carbonate electrolytes. Figure 6 below, taken from Christensen et al., demonstrates the
diminishing performance of lithium-oxygen cells with different electrolytes. So far, no
publication has been able to cycle a lithium-oxygen cell 100 times with 90% cyclability [2].
Several other electrolytes that have been investigated include ethers and ionic liquids but
Another major issue that must be addressed is the development of an oxygen
permeable membrane that would allow oxygen to enter and exit the system as needed. This
membrane also must prevent contaminants from entering the cell [2]. Several papers have
been published showing promising developments in this field by Zhang et al. and Max Power
Inc., where polymer derived membranes are currently being designed [2]. Unfortunately,
these membranes have only been demonstrated to work at limited current densities and are
still being developed. It is worth noting that on-board storage has been explored (such as
utilizing a small tank of oxygen) but it greatly reduces the energy density and specific energy
of the cell and would not be ideal [2].
Another roadblock in the development of a commercially available lithium-oxygen
battery is a better understanding of the reaction mechanics of the system represented in
Figure 7 below; it represents the basic reaction scheme of the oxygen reduction reaction
(ORR) that takes place in a nonaqueous electrolyte [1]. The first two branches (r1 and r2)
represent the ORR reactions of large cations in a nonaqueous media, forming O2- as an
intermediate species through a one electron transfer before forming YO2 (where Y represents
a large cation). By replacing the large cations with lithium ions (r3) disproportionation may
occur as represented by r4 in Figure 7. The disproportionation from LiO2 to Li2O2 occurs
because of lithium’s inability to stabilize O2-. The other possible reaction is a second electron
transfer to occur as represented by r5 to still form Li2O2. X-ray diffraction results further
prove that Li2O2 is the main discharge product in nonaqueous media instead of Li2O and
Figure 7: Oxygen Reduction Reaction Schematic [1]
2.3 Transport Limitations in Li-O2 Batteries
One of the challenges in manufacturing a rechargeable lithium-oxygen battery is due
to the inability of typical cathode materials to accommodate large amounts of
lithium-peroxide, limiting the overall capacity of the battery. This issue is demonstrated in Figure 8.
The cathode material demonstrated in the material is battery grade carbon black. Studies
show that upon discharge the internal volume filling is low with most cases suggesting a
small ~10-15% internal pore volume being filled [13]. Figure 8a demonstrates the dense low
conducting Li2O2 films forming at low current rates, leading to low internal volume filling
[13]. Figure 8b demonstrates how higher discharge rates can lead to transport issues resulting
Figure 8: Air-Cathode Capacity Restriction with Carbon Black Cathode Materials. (A) Small discharge rates leasing to Li2O2 forming within cathode with poor conduction characteristics leading
to poor volume utilizations. (B) Higher discharge rates leading to transport issues and cathode clogging [13].
A cathode’s ability to accommodate the lithium peroxide on discharge depends on the
cathode pore system structure rather than the internal cathode pore volume [13]. The logic is
that the cathode pore size, if too narrow, will be blocked quickly by discharge products, but if
it is too large the side surfaces of the pore will be plated with oxides thick enough to stop
charge transfer since Li2O2 is a known insulator. It is suggested that meso-pore volumes (5-
10 nm diameter) may be the most effective cathode system, allowing the formation of the
were found to lead to pore orifice clogging, meaning the 5-10 nm diameter pore orifices may
be optimal for cathode filling [13].
Other studies point to the capacity of lithium-oxygen cells increasing as the pore size
of the carbon cathodes grows larger. A linear relationship is reported between the average
pore cathode diameter and the capacity of the lithium-oxygen cell with the majority of
lithium oxides residing in the larger pores of the cathode [14].
The most extensively studied nanostructures for energy storage capabilities are
graphene and carbon nanotube structures with their various structures represented in Figure 9
[13]. Figure 9a represents a single wall carbon nanotube (SWCNT), consisting of a single
rolled up graphite sheet. Figure 9b represents a multi-walled carbon nanotube, consisting of
numerous SWCNTs fitted one inside another. Figure 9c represents a single graphene sheet
(of one atom thickness) and 9d portraying the “crumpled graphene sheet configuration” [13].
The cathode structure and design greatly affect the performance of lithium-oxygen batteries,
Figure 9: Different structures of Graphene and Carbon Nanotubes (a) Single wall carbon nanotube (b) multi-walled carbon nanotube (c) Single graphene sheet (d) a crumpled graphene sheet
2.3.1 Li2O2 Distribution in Cathodes
The distribution of precipitate in the cathode has been studied using high energy x-ray
diffraction methods, and they have been carried out to investigate mass-transport limitations
during discharging. The work done by Shui et al. cycled a lithium-oxygen battery 11 times,
and each time finding similar charging/discharging cycles [10]. It was found that Li2O2 is not
distributed evenly through the cathode and that the highest concentration of precipitate was
found closer to the separator than the oxygen permeable membrane [10]. It makes intuitive
sense as the mixing front between lithium and oxygen would occur closer to the separator
than the membrane, leading to the highest concentration of Li2O2.
Further, the transport limitation of lithium-oxygen batteries further limits the depth of
discharge and the capacity and cyclability of the cells [9]. Ryan et al. has investigated the
growth of precipitate in the cathode by modeling the reactions of lithium and oxygen within a
porous cathode using models developed by Tartakovsky et al [15]. General
advection-diffusion-reaction equations are solved to model the movement and reactions of lithium and
oxygen within the cathode [9]. The reaction that occurs as the lithium-oxygen battery is
discharged is shown below.
From their numerical analysis, it was found that increasing the diffusion coefficient of
oxygen does help to move the mixing front deeper into the wetted area of the cathode but
does not help to utilize more of the cathode and increase the capacity of the battery [9].
preventing further formation of lithium peroxide. In the case where a catalyst was utilized, it
was found that if the reaction rates deep in the wetting portion of the cathode can be
increased in relation to the reaction rates closer to the air side, a larger portion of the cathode
can be utilized before pore blockage occurs and the electrochemical reaction stops [9]. The
results from Ryan et al. are demonstrated in Figure 10 where the increase in oxygen diffusion
rates can be seen to affect the depth of discharge within the cathode as well as the amount of
Li2O2 formed [9].
Figure 10:Li2O2 Formation within cathode. From left to right, increase oxygen diffusion rates: (a)
DO2=0.5 (b) DO2=1 (c) DO2=3. Increasing diffusion coefficient of O2 resulted in increased
precipitation growth of 1.8 and 3.8 times for cases (b) and (c), respectively [9].
Figure 11 demonstrates the concentrations of oxygen and lithium moving through the
cathode. It can be seen that the pore blockage caused by the Li2O2 formations prevents
further mixing of the species.
Figure 11: (Top) Lithium concentration for cases a, b, and c from Figure 10 (Bottom) Oxygen concentration for cases a, b, and c from Figure 10 [9].
The results of this analysis contend that a cathode for a lithium-oxygen battery must
be developed that can increase the reaction rates as specified above, likely by the use of some
catalyst within the cathode [9]. While the paper does not go further into suggesting how to
achieve these greater capacities, the results do shed some light on the precipitate growth
2.4 Formation of Discharge Product (ORR) – Li2O2
The morphologies of the Li2O2 formed during discharge were found to depend on the
applied potential with small particles (10-20 nm) forming at lower discharge potentials and
larger disc-like particles (~50 nm thick, 200 nm diameter) forming at higher potentials [16].
These discs are the intermediate to the formation of the toroid-like particles. These findings
suggest that larger discharge potentials (E > 2.7 V) promote the growth of Li2O2 on Li2O2
while smaller discharge potentials (E < 2.7 V) promote the growth of Li2O2 on carbon [16].
The abrupt change between the morphology of Li2O2 with respect to different potentials is
due to a nucleation barrier of Li2O2 on carbon and this nucleation barrier may change with
different electrode materials [16].
The formation of thicker discharge products (hundreds of nm instead of several nm)
must be achieved in order to reach higher discharge capacities. The formation mechanisms of
bulk Li2O2 must be better understood and analyzed before higher discharge capacities can be
achieved.
It has been reported that discharge in non-carbonate electrolytes forms large Li2O2
particles (on the order of one µm) with distinct toroid-like shapes as can be seen in Figure 12
[1]. These toroid shapes appear to be characteristic of Li2O2 and not dependent on electrolyte
or electrode materials. Toroid-like shapes begin as small particle shapes before evolving into
Figure 12: SEM Images of Discharged Toroid-Like Particles [1].
Studies have shown that the Li2O2 morphology directly influences the oxygen
reduction reactions and the oxygen evolution reactions within lithium-oxygen cells [16].
Figure 13 portrays the discharge potentiostatic (a) and galvanostatic (b) discharge profiles as
well as the Tafel plot of discharge voltage versus discharge current (c). A decrease in current
can be seen with the potentiostatic discharge plot, especially at lower voltages (less than 2.6
V). This is likely due to electronic limitations that increase as more Li2O2 forms and acts as
Figure 13: (a) Discharge current vs. capacity of lithium-oxygen cell with CNT. Discharged potentiostatically from 2.76 to 2.0 V (b) Discharge current vs. capacity of lithium-oxygen cell with CNT. Discharge galvanostatically from 10 to 1000 mA/gc (c) Tafel plot of discharge voltage vs.
The galvanostatic discharge plot agrees well with the results seem from the
potentiostatic discharge profile at low discharge capacities as can be seen by the linear
relationship of the Tafel plot in Figure 13 [16]c. The slope of the Tafel plot in Figure 13c is ~
290 mV/dec [16]. The “dec” unit is short for “decade” and is referring to the fact that the
x-axis of Figure 13c is on a logarithmic scale. At low discharge currents, it can be seen that the
discharge voltage and overpotential deviated from a linear relationship and begins to
approach ~2.8 V and 0.16 V respectively, or a minimum overpotential. At very high
discharge currents, the discharge voltages again deviated from the linear relationship and
decreased very quickly, greatly increasing the overpotential [16]. These results are supported
by previous studies by Viswanathan et al., however, other reported recent activity but further
studies are needed to better understand why these deviations from the linear relationship
occur [16, 17].
These findings were confirmed through the work done by Xia et al. where work was
done to better control Li2O2 properties and morphologies to improve lithium-oxygen cell
cyclability [18]. Their experimental cell would discharge to a voltage of 2.6 V before the
buildup for discharge products which caused the voltage to drop off and cease discharge as
seen in Figure 14. It was found that at low discharge current, Li2O2 deposits were found on
carbons surfaces resembling small disc-like particle before more Li2O2 nucleated on disc-like
Figure 14: Discharge curve of lithium-oxygen battery. Through discharge, the cell voltage slowly deceases to 2.6 V due to increasing discharge products where voltage dropped off and ORR stops [18].
As the experimental cell continued to discharge, a defective super-oxide phase was
found to form on the rims of the disc-like particles, forming a toroid shape that is highly
Figure 15: Li2O2 morphology as the lithium-oxygen cell goes through discharge [18].
2.5 Li2O2 Reactivity with Carbon Cathodes
Another issue resulting from the reduction reactions is the Li2O2 reacting with carbon
(from ether-based electrolytes) to form Li2CO3. Products such as Li2CO3 have been seen to
form on carbon nanotubes and can represent an irreversible reaction and should be prevented
as seen in Figure 16 below [1]. Recent experiments utilizing XANES have shown Li2CO3
present at lower loadings (~1000mAh/g) but have not been observed at higher capacities
(2000 and 4700 mAh/g). Gallant et al. proposes the apparent absence of Li2CO3 at higher
capacities is due to the large Li2O2 particles covering up the Li2CO3 as seen in Figure 14 [1].
small Li2O2 thickness [19]. Further, Thotiyl et al. reports that the formation of Li2CO3 is
largely related to electrolyte decomposition (instead of cathode decomposition) on discharge
[20] . This was found experimentally when it was discovered that the parasitic products
contained 12C (from the electrolyte) instead of 13C (from the electrode) upon discharge.
However when the battery was charged, the presence of 12C or 13C in the parasitic products
depended on the charge potential [1, 16]. These findings again highlight the importance of
developing a noncarbonated electrolyte so these parasitic products can be mitigated.
Figure 16: Morphology of Li2O2 and Li2CO3 on Carbon Nanotubes [1].
Figure 17 below portrays the effect that parasitic products such as Li2CO3 can have on
the discharge profiles of a lithium-oxygen battery. Figure 17a shows the formation and
voltage required through cycling. It can be seen that at higher cycles, the charging voltage
required increases as the parasitic products (Li2CO3) continue to grow.
Figure 17: (a) Growth of Li2CO3 through cycling (b) Effect of parasitic products on charging voltage
2.6 Lithium Dendrite Growth in Lithium Metal Batteries
Another problem in the development of lithium-oxygen batteries is the growth of
dendrites (tree-like structures) on the lithium metal anode of the battery. The growth of
dendrites on pure lithium metal has been a known issue for several decades and has been a
subject of study for over 40 years [21]. These dendrites can lead to low columbic efficiency
of the battery and eventually catastrophic failure of the system due to shorts. These dendrites
form through the cycling of the battery and are observed not just in lithium-oxygen batteries,
but in all battery systems with a pure lithium metal anode. Figure 18 below shows an image
of dendrites forming within a lithium-oxygen cell, with Figure 18a portraying a needle-like
dendrite and Figure 18b portraying the bush-like dendrite formation, two different dendrite
formations that form at low and high current densities, respectively [12].
These dendrites can lead to changes in local transport properties, increased in joule
heating in the anode, and eventual breakage of the dendrites (and shorts in the system) [21].
These events are unacceptable and a suitable solution must be found to mitigate these
structures from forming before a safe and cyclable lithium-oxygen battery is developed.
The length of the dendrite arms as a function of time are measured and are
demonstrated in Figure 19 below where it can be seen that the dendrite growth is
proportional to the square root of time. Figure 19 demonstrates the initial dendrite growth is
slow while the dendrite growth begins to increase once it exceeds a specific certain length.
This is due to the slow growth rate of the smaller whisker-like dendrite growing initially that
Figure 19: Dendrite Length in Ionic Liquid as a function of time [22].
2.6.1 Dendrite Growth in Lithium/Polymer Cells
Dendrites are known to grow in all battery systems with a pure lithium metal
electrode. All lithium-oxygen batteries utilize this metal anode and thus dendrite growth is
something that must be dealt with in every type of lithium-oxygen cell. One common type of
lithium-oxygen battery cell that was introduced in the 90s is the lithium/polymer cell [23].
properties of the electrolyte [23]. It is known that a solid state electrolyte can help mitigate
dendrite growth through the application of some pressure on the anode surface and thus pose
an interesting investigation.
Brissot et al. published in-situ work, experimenting with their own lithium/polymer
cells under galvanostatic conditions. It was found that the lithium dendrites grow and had
different structures based on the discharge current density of the battery cell. In the
high-current density, the dendrites take on the previously discussed “bush” like morphology as
seen in Figure 20. It was also observed that these dendrite structures were not able to grow
When the cell was discharged at a low-current density, the thin needle-like dendrite
was formed as seen in Figure 21. Unlike the bush like dendrites previously discussed, the
needle-like dendrites do not have a limit to how long they can grow and pose a safety hazard
with the potential to short out the battery cell.
While it is not yet fully understood how the current density affects the formation of
dendrite on the anode surface through cycling, it is thought that various inhomogeneity’s that
already exist in the anode surface can lead to the formations of these structures [23].
2.6.2 Dendrite Growth in Li-O2 Cells with Ionic Liquid
The potential use of lithium metal as the anode of lithium-ion batteries in order to
increase the energy density of the batteries has been investigated for decades. One of issues
with battery cells with pure lithium metal anodes is dendrite growth that inhibits
electrochemical reversibility as well causing short-circuit issues. The use of ionic liquids as
the electrolyte has also been explored for use in both lithium-ion and lithium-oxygen
batteries.
The effects of both the ionic mass transfer rate and the electrodeposited surface
morphology and how these characteristics affect lithium deposition onto metal was
investigated by Nishida et al. 5mm square Ni sheets were used as the working electrode while the “counter” electrode was made of Li metal foils of 200 μm thickness [22]. The
lithium dendrite growth was observed using a digital optical microscope and the current
densities imposed on the experimental cells ranged from 0.1 to 5.0 mA/cm2. The results from
the study can be seen in Figure 18.
Figure 22 demonstrates the dendrite growth observed based on different current
applied current densities with the smaller current densities (<0.5 mA/cm2) forming long
needle-like dendrites [22]. The larger current densities shift the formation of lithium
dendrites from needle-like structures to a seaweed-like form. These dendrites do not form
right away as these cases present smooth surfaces up to about 300 mC/cm2. Also worth
noting from Figure 22 are the needle-like dendrites appear to form at lower capacities as the
discharge current of the battery cell is decreased.
2.7 Dendrite Growth and Battery Capacity Loss
The work published by Orsini et al studied the lithium dendrite growth within lithium
metal battery cells and the associated capacity loss as the cells were cycled [24]. It is well
documented that lithium dendrites grow as the lithium-oxygen batteries are continuously
cycled. From the work published by Orsini, the experimental lithium cells experienced a
90% capacity loss as the cells were cycled as few as 25 times [24]. Figure 23 below
demonstrates the decrease in capacity of their lithium metal cells as they were continuously
cycled, with y-axis representing the normalized cell capacity. The smaller the discharge
The study on lithium metal batteries revealed that the higher discharge current
densities of the battery led to larger dendrite formations and deposits [24]. The formation of
the mossy, or bush-like, dendrites was shown to be the cause of the rapid deterioration of the
lithium-electrolyte interface and led to the rapid decrease in battery cell capacity [24].
2.8 Computational Modeling of Lithium Dendrite Growth
Many papers have been published relating to the modeling of dendrite growth in
lithium metal batteries. Monroe et al. published a paper in 2003 that provides a summary
relating to dendrite growth in lithium metal systems. They compiled the most relevant
research in this field and developed their own comprehensive numerical dendrite growth
model. A large part of the model developed by Monroe et al. was based off of modeling work
done by Barton and Bockris. Their group developed a dendrite model that made several
critical assumptions such as neglecting mechanical and inertial forces, incorporating surface
forces to resist infinite dendrite thinning, spherical diffusion dominates linear diffusion, and
mass transfer and surface forces dominate kinetics of dendrite growth [11].
Monroe et al. took the assumptions and theories developed by Barton and Bockris,
and other groups such as Diggle et al. and Chazalviel et al., in order to produce their own
model [25-27]. Based off of the schematic in Figure 24 below, the concentration profile and
mass transfer profiles were derived [11].
Through non-dimensionalizing the formulas for the transient diffusion equations for
at dendrite tips, and dendrite tip velocity were calculated [11].
Figure 24: Schematic of System Modeled by Monroe et al. [11].
It is interesting to note that while the methods developed by Monroe et al. are able to
model simple dendrite growth within lithium metal systems; several major assumptions had
to be made in order to simplify the system. Of the many assumptions made, one was that the
diffusion coefficient of lithium was constant throughout the entire system [11]. As explained
in the more recent work completed by Tan et al., it can be shown that the diffusion
coefficient of the lithium within the system may not be uniform in all cases [12].
When applying modeling to the dendrite growth in lithium-oxygen battery systems,
Tan et al. found that a uniform diffusion coefficient was actually able to model the growth of
needle-like dendrites well but failed to model the growth of bush-like dendrite growth
growth of bush-like dendrites much better, although this actual comparison was not made
[12]. This can be seen in Figure 25 where the lithium concentration as well as the cell
potential increases much more rapidly with a step-function diffusion coefficient, leading to
much greater dendrite velocities [12].
Figure 25: Dendrite Growth with Uniform and Step-Function Diffusion Coefficients (a) Dendrite Position (b) Lithium-ion Concentration at Dendrite Tip (c) Kinetic Potential at Dendrite Tip [12].
Various mathematical models have been developed that do not require some of the
boundary conditions and taking into account a concentration dependent diffusion coefficient,
developed a lithium-ion transport model and electrochemical reaction model to consider the
activation, concentration, and surface curvature overpotentials of the dendrites [28]. Akolkar
found that if the concentration of lithium near the dendrite surface is known, then the tip
current density can be calculated as a function of the dendrite tip radius [28]. It leads to a
much more simple formula to calculate the dendrite tip current density than previously
developed.
2.9 Mitigating Dendrite Growth
Other areas that have been explored to mitigate dendrite growth in lithium metal
batteries include utilizing the changing battery cell volume through cycling. Jang et al.
experiments with different amounts of lithium metal to observe the effects on both the cell
capacity and dendrite growth through cycling [29]. With cells ranging from 0.9 mg to 14 mg
of lithium metal, it was found that a cell with 0.9 mg of lithium could utilize almost all of the
metal anode during discharge before cycling back and depositing on the remaining lithium
metal through charging [29]. Each cell was shown to decrease in capacity as the cells were
cycled and the smaller the volume of lithium that was available, the smaller the total capacity
Although it may be counterintuitive, as the amount of lithium in the anode was
increased the anode became more porous and experienced more dendrite growth through
cycling when compared to the cells with less lithium [29]. It can be seen in Figure 27 where
the anode surfaces of three different anodes are shown. Figure 27c shows a more porous and
rough anode surface after cycling due to the greater amounts of lithium used in the anode.
Figure 27: Images using SEM technique of Li-O2 anode surface after 10 cycles (a) Li = 0.9 mg (b) Li
Figure 28 portrays a step-by-step process of the “self-healing” shield developed
through experiment. In the first diagram (Figure 28a), both lithium and the cation additive
begin to deposit onto the surface of lithium metal through charging. It is important to note
that charging voltage in this case must be slightly lower than the lithium reduction potential
but higher than the cation reduction potential. Figure 28b shows the beginning of the
formation of a protuberant tip of lithium on the lithium metal, which as stated previously,
will continue to grow due to the higher electric field of the protrusion.
As the lithium-protrusion (dendrite) continues to grow, the cation additives will begin
to “accumulate around the tip to form an electrostatic shield” due to their smaller reduction
potential (Figure 28c and 28d). Because of their positive charge, this electrostatic shield from
the cations will drive the lithium ions to deposit in the surrounding regions of the lithium
metal (Figure 28e) until a smooth surface is once again formed on the lithium metal (Figure
CHAPTER 3: MODEL DEVELOPMENT
We are hopeful that a better understanding of the operating mechanisms of the
lithium-oxygen cell can be obtained by studying the effects of the anode and cathode together
through a finite element model. The goal is to construct three different models within
ANSYS Fluent with different anode surface structures – one smooth/homogeneous and two
differing anode surface structures reflecting lithium dendrite growth.
3.1 Fuel-Cell Module Theory
The Fuel-Cell Module will be used within ANSYS Fluent due to the ability to model
chemical reactions that can be modified to reflect the well-known reactions of a
lithium-oxygen cell shown below in equation 2.
2 2 2 2 2
O + e− + Li+←→Li O (2)
The Fluent Fuel-Cell module solves two potential equations shown in equations 3 and
4 as the driving force for the reactions lies in the cell overpotential. Equation 3 represents the
potential equation for the electron transport through the anode while equation 4 solves for the
* (
s
solφ
sol)
R
sol0
∇
∇
+
=
(3)* (
s
memφ
mem)
R
mem0
∇
∇
+
=
(4)Further, the volumetric transfer current (R) are computed through the Butler-Volmer and
Tafel equations shown in equations 5 and 6 [30]. Table 3 below demonstrates the constants
and parameters taken from the ANSYS manual [30].
F F
RT RT
[A]
R
* (
)
* (e
e
)
[A
]
an an cat an an
ref an an an
ref
j
a η a η
γ
ζ
=
−
(5) F F RT RT[C]
R
* (
)
* (e
e
)
[C
]
cat cat cat an an
ref
cat cat cat
ref
j
a η a η
γ
ζ
=
−
(6)
Table 3: Formula Constants and Parameters of Butler-Volmer Formulas [30]
j
reference exchange current density
per active surface area (A/m^2)
ζ
specific active surface area (1/m)
[],[]
reflocal species concentration,
reference value (kmol/m^3)
γ
concentration dependence
α
transfer coefficient (dimensionless)
Constructing a finite element model of the lithium-oxygen cell gives the benefit of
adjusting parameters such as electrode porosity, oxygen diffusivity, and mass flow rates
through potentiostatic or galvanostatic discharge. Examining these cell and experimental
characteristics with the different anode surface structures gives us the ability to make
observations that may be difficult to conduct through pure experimental work.
Below in Figure 29 is the schematic of the PEMFC fuel cell used in the fuel cell
module. Using this schematic, the lithium-oxygen battery models were constructed.
Figure 29: Schematic of PEM Fuel Cell for Fluent Fuel Cell Module [30].
3.2 Model Construction and Parameters
In order to customize the fuel cell module within Fluent to model the reaction of a
and oxygen in exchange for the properties of H2O and hydrogen. A cell will then be drawn
with the same dimensions seen in the literature previously discussed with different models to
reflect different anode surfaces [31, 32]. Our goal is to observe how the effects of different
anode surfaces (and other cell properties) affect the discharge capacity, voltage, species
concentration, and other characteristics to get a better understanding of how the entire cell
operates. The current dimensions of the model can be seen in Figure 30 and 31 below.
Figure 31: Schematic of x-y plane of lithium-oxygen cell with small dendrites on lithium metal surface (not drawn to scale).
One of the apparent differences between our lithium-oxygen cell models and the
PEMFC fuel cell model is the considerably wider gas channels of our models. These are
adjusted to span nearly the entire length of the electrodes to ensure an even distribution of
lithium and oxygen in the x-direction of the electrodes.
Table 4 below represents the properties of lithium, oxygen, and lithium peroxide used
in the model. It is important to note that the molecular weight of lithium in Table 4 is the
actual molecular weight of 6.94 kg/kmol. Our model uses a molecular weight of 13.88
kg/kmol to represent Li2 rather than a single Li. With the 13.88 kg/kmol we can use an
Table 4: Material Properties of Lithium-Oxygen Battery Reactants
Property Units Lithium Oxygen Lithium
Peroxide Thermal Conductivity
[32, 33]
W/m*K 85 0.0246 14.5
Viscosity kg/m*s 8.41E-06 1.92E-05 1.34E-05
Molecular Weight [32] kg/kmol 6.94 31.9988 45.88
Electrical Conductivity [32, 34]
1/ohm*m 1.1E+7 1.00E-16 5E-18
Table 5 below portrays the operating parameters of the lithium-oxygen battery
models. Many of these values were taken from the values given by Li et al. to ensure realistic
battery behaviors [32].
Table 5: Default Operating Parameters of Lithium-Oxygen Model
Parameter Value Units
Anode Ref. Current Density
3.11 A/m2
Cathode Ref. Current Density
3.11 A/m2
Diffusivity of Li 8E-11 m2/s
Diffusivity of O2 1E-09 m2/s
Diffusivity of Li2O2 0.00001 m2/s
Open Circuit Voltage 2.8 V
It is important to note that the diffusivity values of the different species were adjusted
so the computational model could better converge. The values portrayed in Table 5 are actual
values taken from Li [32]. The diffusivities in the model are larger but the differences in
Several cell parameters were adjusted and the discharge properties compared. The
current vs. voltage curves (i.e., I-V curves) of the various cells as well as contour plots of the
Li2O2 precipitate concentrations within the cathode were all compared. The operating
parameters adjusted were listed previously in Table 2.
Potentiostatic calculations are carried out, where the discharge voltage is set for each
separate calculation and the discharge current, contour plots for Li2O2 formation, and kMol
of Li2O2 precipitate formation are recorded before another calculation at a different discharge
voltage is carried out. With the open circuit voltage of the cell being 2.8 V, the cell was
CHAPTER 4: SIMULATION RESULTS
With the model setup within Fluent, calculations were carried out to better understand
the discharge behaviors of lithium-oxygen batteries. Several sections below discuss the
observed parameters and their resulting calculations. The contour plots shown below
demonstrate the varying distributions of lithium peroxide (Li2O2) within the cathode after
discharge of the cell.
4.1 Flat Anode vs. Small Dendrite Model
The first set of calculations compared the flat anode model with the model with 4 µm
long dendrites. Both models were discharged with a cathode porosity of 0.75, which is
suggested from the literature [32]. As expected, the dendrite-free model performed better
than the dendrite model when comparing the I-V curves, the amount of discharge product
within the cathode, and when comparing a 2D contour plot of Li2O2 formation. The decrease
in performance is due to the dendrites on the anode surface. In a true experimental setup,
these dendrites increase in size as the cell is continuously cycled and the performance of the
cell declines, suggesting the dendrite formations negatively affect the performance of the

![Figure 3: battery itself was developed by Yardney Lithium [7]The experimental lithium-oxygen battery cell used in the experiments by Reid et al](https://thumb-us.123doks.com/thumbv2/123dok_us/1550866.1190325/22.612.141.493.72.335/figure-battery-developed-yardney-lithium-experimental-lithium-experiments.webp)
![Figure 4: Technical Products [8]. An SEM image of the porous cathode used in the experiments conducted by Yardney](https://thumb-us.123doks.com/thumbv2/123dok_us/1550866.1190325/23.612.143.488.180.424/figure-technical-products-porous-cathode-experiments-conducted-yardney.webp)
![Figure 22: Morphology of Lithium Dendrite Growth at Different Current Densities [22].](https://thumb-us.123doks.com/thumbv2/123dok_us/1550866.1190325/52.612.98.531.263.553/figure-morphology-lithium-dendrite-growth-different-current-densities.webp)
![Figure 23: Lithium metal cell capacity vs. cycle number at different cycling rates [24]](https://thumb-us.123doks.com/thumbv2/123dok_us/1550866.1190325/53.612.104.531.381.657/figure-lithium-metal-capacity-cycle-number-different-cycling.webp)
![Figure 24: Schematic of System Modeled by Monroe et al. [11].](https://thumb-us.123doks.com/thumbv2/123dok_us/1550866.1190325/55.612.166.458.116.321/figure-schematic-of-system-modeled-by-monroe-et.webp)
![Figure 25: Dendrite Growth with Uniform and Step-Function Diffusion Coefficients (a) Dendrite Position (b) Lithium-ion Concentration at Dendrite Tip (c) Kinetic Potential at Dendrite Tip [12]](https://thumb-us.123doks.com/thumbv2/123dok_us/1550866.1190325/56.612.92.527.202.589/function-diffusion-coefficients-dendrite-position-concentration-potential-dendrite.webp)
![Figure 26: amount of lithium metal used in the initial anode [29]. The change in cell capacity as the battery is cycled](https://thumb-us.123doks.com/thumbv2/123dok_us/1550866.1190325/58.612.146.484.84.514/figure-lithium-metal-initial-change-capacity-battery-cycled.webp)