ISSN(Online): 2319-8753
ISSN (Print): 2347-6710
I
nternational
J
ournal of
I
nnovative
R
esearch in
S
cience,
E
ngineering and
T
echnology
(An ISO 3297: 2007 Certified Organization)
Vol. 5, Special Issue 1, March 2016
Effect of CuO Nanoparticles in Polymer Blend
Electrolytes on the Performance of Natural
Dye Sensitized Solar Cells
Hari Hara Priya G1, Suganya N2 and Jaisankar V3*
PG and Research, Department of Chemistry, Presidency College (Autonomous), Chennai, India1
PG and Research, Department of Chemistry, Presidency College (Autonomous), Chennai, India2
PG and Research, Department of Chemistry, Presidency College (Autonomous), Chennai, India3 *
Corresponding author
ABSTRACT:Dye-sensitized solar cells (DSSCs) have been intensively studied over the past decade and regarded as an
alternative to the conventional inorganic devices because of their relatively high efficiency and low cost. Natural dye sensitized solar cells (NDSSCs) have been widely investigated as a next generation solar cell because of their easy availability, simple preparation technique, environmental friendliness and low manufacturing cost. In the presentwork betacyanin dye responsible for the red color of many fruitsand leaves having favorable absorption spectra with the solarspectrum has been used in fabrication of NDSSCs. A nanocomposite polymer was prepared using poly(ethylene oxide) (PEO) and poly(ethylene glycol) (PEG) as host polymers, ethylene carbonate (EC) as a plasticizerwith n-CuO as filler. The nanocomposite polymer was complexed withpotassium iodide and then iodine crystals were added to the polymer nanocompositeelectrolyte. The effect of CuO nanofiller on the morphology and ionic conductivity of plasticized polymer electrolyte for the fabrication of NDSSCs was studied using FTIR, XRD, FESEM and EIS. The NDSSCs were fabricated by sandwiching polymer electrolyte between the natural dye-sensitized nano TiO2 (n-TiO2) electrode and a carbon counter electrode with configuration of, FTO/n-TiO2/Natural Dye/Electrolyte/Carbon/FTO.The
fabricated solar cells were characterized by measuring I–V curves under illumination of sunlight.
KEYWORDS: Polymer nanocomposite electrolyte, Nanofiller, Ionic conductivity, Betacyanin, Natural dye sensitized
solar cell.
I.INTRODUCTION
Efforts in lowering energy consumption and protecting the environment have gradually motivated all the researchers in the world to explore the alternative energy sources [1]. Renewable energy resources are generally defined as energy that comes from resources which can be regenerated continuously such as sunlight, wind, hydro, rain and waves.Renewable energy sources that gain their energy conversion from the sun, such as solar cells, are expected to be capable of supplying the endless energy for mankind.
ISSN(Online): 2319-8753
ISSN (Print): 2347-6710
I
nternational
J
ournal of
I
nnovative
R
esearch in
S
cience,
E
ngineering and
T
echnology
(An ISO 3297: 2007 Certified Organization)
Vol. 5, Special Issue 1, March 2016
carbon nanotubes [6] and clays [7] into polymer electrolytes will form polymer nanocomposite electrolyte which not only improved the ionic conductivity but also enhanced the mechanical strength and stability of the polymer electrolyte. The enhancement in the conductivity is predominantly due to the increase of amorphous region in the polymer as a consequence of the dispersal of the filler particles.
Several polymers used for gel polymer electrolytes (GPEs), such as poly(ethylene oxide) (PEO), poly(methyl methacrylate) (PMMA), poly(vinyl pyrrollidone) (PVP), polyacrylonitrile (PAN), poly(vinyl chloride) (PVC), poly(vinylidene fluoride) (PVDF), poly(ethylene glycol) (PEG) and poly(vinylidine fluoride-co-hexafluoro propylene) (PVDF-co-HFP)[8,9] have been investigated for DSSCs. Among these polymers, PEO and PEG are chosen as host polymers and they are filled with CuO nanofillers by solvent casting method.
The dye plays a key role in harvesting sunlight and converting solar energy into electric energy. Ruthenium complexes are effective sensitizers that exhibit high energy conversion efficiencies in DSSCs [10]. However, these dyes contain Ru metal complexes, which are expensive and produce environmental pollution. Therefore several natural dyes such as betalains [11, 12], anthocyanins [13, 14], chlorophyll [15] and carotenes [16] have been used as sensitizers in DSSCs. In this study, betalains have been chosen as they have favorable light absorbing and antioxidant properties, and exist in nature, associated with various co-pigments that modify their light absorption properties and the requisite functional groups (-COOH) for betterbindingof the metal oxide nanostructure [17]. They can be divided into betacyanins and betaxanthins based upon their molecular structure. In this work, we developed an effective approach for extraction of betacyanin dye from Beta vulgaris (common name: beetroot).
In this work, we aimed to study the effect of CuO nanoparticles on the efficiency of natural dye-sensitized solar cells (NDSSCs) using polymer gel electrolytes of PEO/PEG blends.We used betacyanin as natural dye for their simple preparation technique, low cost, easy availability and environmental friendliness.Thus our natural DSSC is composed of the natural dye adsorbed on a nano-crystalline porous wide band gap (TiO2) electrode, a nanocomposite polymer electrolyte containing iodine ions and a carbon counter electrode.
II. EXPERIMENTAL PROCEDURES
II (a) Materials
All chemicals used were of analytical grade and have been used without purification. Copper sulphate (CuSO4.5H2O), Citric acid, Sodium hydroxide (NaOH), Iodine (I2),and Potassium iodide (KI) were purchased from Himedia. Acetonitrile was purchased from Merck. PEO(Mw 500000), PEG (Mw 6000), TiO2, Triton X-100 and ethylene carbonate(EC) were obtained from Aldrich.
II (b) Preparation of CuO nanoparticles
0.1M copper sulphate and citric acid was dissolved in 100 mL of double distilled water. 1 M NaOH was added drop by drop under stirring. The precipitated CuO was stirred for 2 h. Then the precipitate was washed several times with de ionized water and dried. The dried product was kept at 500°C for 3 hours in a muffle furnace to get the CuO nano crystals [18].
II(c) Preparation of polymer blend nanocomposite electrolyte
ISSN(Online): 2319-8753
ISSN (Print): 2347-6710
I
nternational
J
ournal of
I
nnovative
R
esearch in
S
cience,
E
ngineering and
T
echnology
(An ISO 3297: 2007 Certified Organization)
Vol. 5, Special Issue 1, March 2016
oven at 80°C for 24 h. The dried films were stored in dark desiccators to prevent them from any contamination from moisture and/or light.
II (d) Preparation of betacyanin dye
Betacyanin dye extracted from B. vulgaris (Common Beet) was obtained by immersing the B. vulgaris slice in HCl (0.1 N) solution (ethanol extract). The mixture was kept overnight, and the resulting extract was filtered to remove any solid residue and was used for sensitization. All solutions were protected from direct light and stored in the refrigerator at about +5°C; the dye solutions were stable for more than 12 months [17].
II (e) Preparation of photoelectrode
Fluorine Tin Oxide (FTO) glass was used as the substrate for both working and counter electrodes in this study. To prepare the working electrode or photoanode, an area of 1x1 cm2 was identified on the FTO-glass substrate (sheet resistance 15 Ω/square). Then theTiO2 film was fabricated by tape casting method. A drop of TiO2 paste [19] was spread on the working area by doctor blade method. The film was then left to dry in air at room temperature for about 20 min, and then sintered at 450°C for about 30 min and cooled to 80°C in an oven. The resulting film thickness was
about 20 μm. The dye-sensitized photoelectrode were prepared by immersing the films in ethanolic solution of natural
dye for 24 h at room temperature.
II (f) Preparation of counter electrode
0.3 g of carbon nanopowder was mixed with 1 ml of carboxymethyl cellulose (CMC) in water and grinded in mortar and pestle to obtain a well mixed paste. This paste was applied on FTO glass through doctor blade method and sintered at 250°C for 1 h [20].
II (g) Assembly of the NDSSCs
The solar cells were fabricated by sandwiching polymer nanocomposite electrolyte (PNE) between the natural dye-sensitized TiO2 film and a carbon counter electrode with configuration of, FTO/TiO2/Natural Dye/Electrolyte/Carbon/FTO.
II (h)Characterization
The first part of this study was focused on the preparation and characterization of the polymer nanocomposite electrolyte for solar cell fabrication. To study the interaction within PEO-PEG-KI-EC, Fourier Transform Infrared spectroscopy (FTIR) was carried out using the PerkinElmer IR spectrometer in the range of 4000 to 400 cm−1. A Siemens D 500 X-ray diffractometer with CuKα filtered radiations was used to determine the structure and crystallinity of the samples. The samples were scanned over the 2θ range from 10° to 80°. The crystallite size (D) of the nanoparticles was calculated from XRD using the Scherrer equation: D = 0.89λ/β cosθ. The structure and morphology were studied using an S-4800- High Resolution Scanning Electron Microscope (HRSEM). The composition of the n-CuOwas scrutinized by Energy Dispersive X-ray spectroscopy (EDS) spectrum. To determine the conductivity of polymer electrolyte compositions, electrochemical impedance spectroscopy (EIS) technique was used. The impedance of the samples was measured using the HIOKI 3532 LCR Hi-Tester interfaced to a computer in the frequency range 50 Hz to 5 MHz at room temperature. Each sample was sandwiched between two stainless steel electrodes of diameter 2.0 cm before performing the measurement. The conductivity was calculated using equation: σ = t/A×Rb. Here Rb is the bulk resistance (Ωor S−1) of the sample taken at the intersection of the Nyquist plot with the real impedance axis, t is
the sample thickness (cm) and A is the surface area of the electrode/electrolyte contact (cm2).
The second part of the study was concentrated on the fabrication and characterization of the DSSCs. The absorption spectra of n-CuO and betacyanin dye were taken with a Shimadzu UV–1650PC UV-Vis spectrophotometer. The photocurrent–voltage (I–V) characteristics of the DSSCs were measured by using digital multimeter under illumination of sunlight[21].
ISSN(Online): 2319-8753
ISSN (Print): 2347-6710
I
nternational
J
ournal of
I
nnovative
R
esearch in
S
cience,
E
ngineering and
T
echnology
(An ISO 3297: 2007 Certified Organization)
Vol. 5, Special Issue 1, March 2016
where Imaxand Vmaxdenote the maximum output value of current and voltage respectively, and Isc and Vocdenote the short circuit current and open-circuit voltage respectively. The overall energy conversionefficiency (η) is defined as,
η = (Isc×Voc × FF)/Pin(2)
where, Pinis the power of incident light.
III.RESULTS AND DISCUSSION
III(a) UV-Vis absorption spectra
The UV-Vis absorption measurement was carried out for B. vulgaris extract in ethanol and n-CuO (Fig.1a and b).
Fig. 1 UV-Vis absorption spectra of (a) Beta vulgaris extract in ethanol and (b) n-CuO
The betalain pigments are characterized by a maximum absorbance at about 535 nm (λmax) for the red-purple betacyanins (Fig.1a). The spectrum of sol–gel derived CuO nanoparticles (Fig. 1b) show a broad absorption band located at λmax of 270 nm in the UV range. The absorption peak is significantly blue-shifted (lower wavelength or higher energy) compared to the bulk CuO (310 nm), due to decrease in particle size.
III(b) Fourier-Transform Infrared (FTIR) Spectroscopy
ISSN(Online): 2319-8753
ISSN (Print): 2347-6710
I
nternational
J
ournal of
I
nnovative
R
esearch in
S
cience,
E
ngineering and
T
echnology
(An ISO 3297: 2007 Certified Organization)
Vol. 5, Special Issue 1, March 2016
Fig. 2 FTIR spectra of CuO nanoparticles
The FTIR spectrum of n-CuO shows bands at around 608 and 501 cm-1,which can be assigned to the vibrations of Cu(II)-O bonds. There is sharp peak observed at 501 cm-1 in the spectrum CuO nanoparticles which is the characteristics of Cu-O bond formation.
4 0 0 0 3 5 0 0 3 0 0 0 2 5 0 0 2 0 0 0 1 5 0 0 1 0 0 0 5 0 0 0
1 0 2 0 3 00 5 1 0 1 5 2 0
W a v e n u m b e r ( c m- 1)
P E
T
ra
n
s
m
it
ta
n
c
e
(
%
)
P N E
ISSN(Online): 2319-8753
ISSN (Print): 2347-6710
I
nternational
J
ournal of
I
nnovative
R
esearch in
S
cience,
E
ngineering and
T
echnology
(An ISO 3297: 2007 Certified Organization)
Vol. 5, Special Issue 1, March 2016
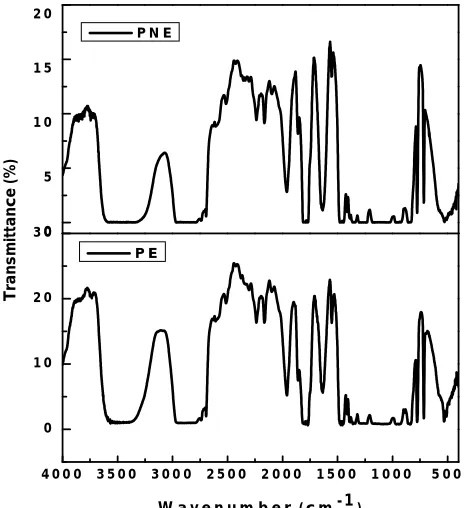
The IR spectra of PE and PNE are also shown in Fig. 3. The peak at 1664 cm-1 is due to carbonyl stretching, 2883 cm-1 is attributed to CH2 stretching, 1103 cm-1 is assigned to C-O-C stretching, 3460 cm-1corresponds to O-H stretching and 523 cm-1 corresponds to presence of metal oxide in nanocomposite. The observed shifts and variation in intensities of the FTIR spectrum of the blend suggest that the complete complexation of salt with polymer blends. The shift in the vibrational frequency for n-CuO and other groups in PNE confirm the formation of polymer nanocomposite electrolyte.
III(c) X-Ray Diffraction Analysis
In order to investigate the effect of blending, XRD analysis was performed. The diffraction patterns of the n-CuO are shown in Fig. 4.
10 2 0 30 40 5 0 6 0 7 0 80 9 0
0 20 00 40 00 60 00 80 00 100 00
In
te
n
s
it
y
(
a
.u
.)
2 theta (degree)
n-CuO
Fig. 4 X-ray diffraction patterns of n-CuO
The particles are nanocrystalline in nature and the crystallite size of n-CuO was obtained using Scherrer formula and was found to be around 55 nm. The existence of strong and sharp diffraction peaks located at the 2θ value of 35.1º and 38.7º corresponding to (0 2 2) and (1 1 1) planes respectively indicated the formation of CuO. The diffraction peaks of CuO can be matched with standard JCPDS data [JCPDS file: 41-0254] [18].
1 0 2 0 3 0 4 0 5 0 6 0 7 0 8 0 9 0 1 0 0 0
1 0 0 0 2 0 0 0 3 0 0 0 0 1 0 0 0 2 0 0 0 3 0 0 0
2 t h e t a ( d e g r e e )
P E
In
te
n
s
it
y (
a
.u
.)
P N E
ISSN(Online): 2319-8753
ISSN (Print): 2347-6710
I
nternational
J
ournal of
I
nnovative
R
esearch in
S
cience,
E
ngineering and
T
echnology
(An ISO 3297: 2007 Certified Organization)
Vol. 5, Special Issue 1, March 2016
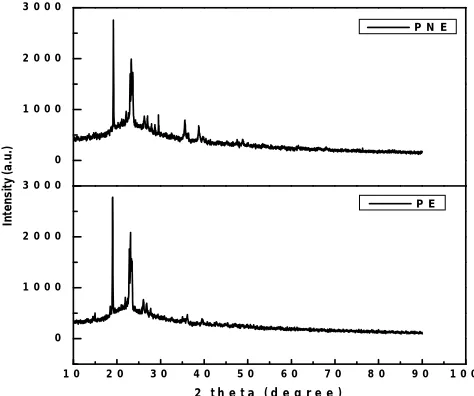
The diffraction patterns of PE and PNE are shown in Fig. 5. The PE shows diffraction peak around 2θ = 19 and 22o, which confirms the crystalline nature of the polymer film. The peaks of PE are significantly reduced in PNE and slightly shifted towards higher angle side and broadening with decreased intensity and also with some new peaks in PNE. In the case of PNE the added CuO nanoparticles disturb the crystalline part and increase the amorphous phase of PEO-PEG blend than pure blend [22]. The more amorphous nature of blend nanocomposite electrolytes may lead to higher ionic conductivity which is generally observed in amorphous polymer electrolytes with flexible backbone [15].
III (d) Scanning Electron Microscopy (SEM)
The morphology and size of the n-CuO were described by FESEM image shown in Fig. 6.
.
Fig. 6 FESEM image of CuO nanoparticles
From the SEM image, it was found that all the CuO particles are spherical in shape. The size of the particles of n-CuO are in the range of 40-85 nm which are in close agreement with the size calculated by Scherrer formula based on the XRD pattern.
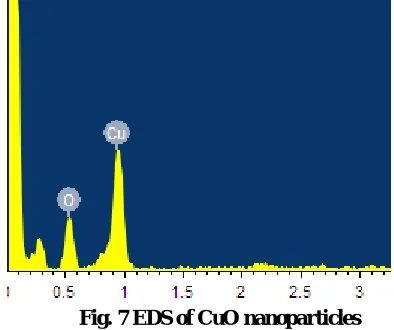
The composition of the n-CuO was scrutinized by EDS spectrum and is represented in Fig. 7.
Fig. 7 EDS of CuO nanoparticles
ISSN(Online): 2319-8753
ISSN (Print): 2347-6710
I
nternational
J
ournal of
I
nnovative
R
esearch in
S
cience,
E
ngineering and
T
echnology
(An ISO 3297: 2007 Certified Organization)
Vol. 5, Special Issue 1, March 2016
No other peak for any other element can be found in the spectrum, which confirms that the grown nanoparticles are pure CuO. Additionally, the atomic percentage of Copper and Oxygen was found to be 49.44 % and 50.56 %, respectively.
The SEM images of PEO-PEG blend and its nanocomposite electrolyte are depicted in Fig. 8(a and b).
Fig. 8 SEM images of (a) PE and (b) PNE
Fig. 8(a and b) shows scanning electron microscopy of PE and PNE. The PE (Fig. 8a) displays a surface with rough texture owing to the crystallization of the polymer matrix. However, as the 1 wt% n-CuO is added (Fig. 8b), the surface shows a uniformly distributed area and some amorphous regions are observed, showing a reduction of the crystallization. It is observed that adding nanofiller improves the amorphous nature of the polymer which is in good agreement with XRD results. More homogeneous distribution of the nanofiller in the polymer matrix is observed with an expected increase in conductivity and stability.
III (e)Conductivity study of PE and PNE electrolyte
The ionic conductivity of PE and PNE was calculated using impedance plots obtained from electrochemical impedance spectroscopy. The intercept of the Nyquist plot (Z’ vs. Z”) with the real axis at higher frequency region is taken as a bulk resistance (Rb) of polymer electrolyte membranes.
0 10000 20000 30000 40000 50000 60000 70000 0
10000 20000 30000 40000
Z
"
(
O
h
m
)
Z' (Ohm)
PE
0 10000 20000 30000 40000 50000 60000
0 5000 10000 15000 20000 25000 30000 35000 40000 45000
Z
"
(O
h
m
)
Z' (Ohm) PNE
ISSN(Online): 2319-8753
ISSN (Print): 2347-6710
I
nternational
J
ournal of
I
nnovative
R
esearch in
S
cience,
E
ngineering and
T
echnology
(An ISO 3297: 2007 Certified Organization)
Vol. 5, Special Issue 1, March 2016
Fig.9 shows the variation of ionic conductivity of polymer electrolyte without and with nanofiller. The ionic conductivities of polymer electrolyte and polymer nanocomposite electrolyte were found to be 3.76 × 10⁻⁶ S cm-1 and 2.08 × 10⁻⁴ S cm-1 respectively. The ionic transport mainly occurs through amorphous domains but not through crystals of PEO. Upon incorporation of CuO nanoparticles, the PEO chains rearrange in a three-dimensional and mechanically stable network, resulting in an increased amorphous region and thus improving ionic transport [23].
III (f) Characterization of NDSSC
The photocurrent density/voltage characteristics of NDSSC using PE and PNE were measured under the illumination of natural sunlight, and the results are presented in Fig. 10. Table 1 summarizes the values of open-circuit voltage (VOC), short-circuit current density (ISC), fill factor (FF), and conversion efficiency (η) obtained from the I–V curves for NDSSC assembled with PE and PNE. A significant increase in performance is observed for the NDSSC assembled with the PNE.
0.0 0.1 0.2 0.3 0.4 0.5 0.6 0.7 0.0 0.2 0.4 0.6 0.8 1.0 1.2 1.4 P h o to c u rr e n t (m A c m -2) Voltage (V) PE
0.0 0.1 0.2 0.3 0.4 0.5 0.6 0.7 0.8 0.0 0.2 0.4 0.6 0.8 1.0 1.2 P h o to c u rr e n t (m A c m -2) Voltage (V) PNE
Fig. 10 The photovoltaic performance of NDSSCs withPE and PNE
Table 1 Summary of the photovoltaic performance of NDSSCs with PE and PNE
Electrolyte ISC (mA cm-2) VOC (Volts) FF Efficiency(η) %
PE 1.3 0.62 0.576 0.449
PNE 1.04 0.74 0.584 0.523
The open circuit voltage (VOC) and short circuit current density (ISC) of betacyanin dye coated TiO2 based photoanode with PNE are 0.74 V and 1.04 mA cm-2 respectively. The conversion efficiency and fill factor of NDSSC with PNE are found to be 0.523%, 0.584 respectively.
IV. CONCLUSION
DSSCs have been fabricated using the highest conductingplasticized PEO polymer electrolyte containing iodine/triiodide redox couple with betacyanin (from Common beet extraction)dyes as sensitizer. The NDSSC using betacyanin dye and PNE exhibits the best performance with a short-circuit currentdensity of 1.04mA cm−2, open-circuit
voltage of 0.74 V, fillfactor of 0.584 and the highest photoconversion efficiencyof 0.523% under the illumination of natural sunlight.The addition of nanofiller to PEO–PEG polymer-blend electrolyte shows conductivity of the order of
10−4 Scm−1
ISSN(Online): 2319-8753
ISSN (Print): 2347-6710
I
nternational
J
ournal of
I
nnovative
R
esearch in
S
cience,
E
ngineering and
T
echnology
(An ISO 3297: 2007 Certified Organization)
Vol. 5, Special Issue 1, March 2016
REFERENCES
[1] J. Twidell and T. Weir, “Renewable Energy Resources”, second ed. Taylor & Francis, New York, USA, 2012.
[2] B. O’Regan and M. Grätzel, “A low-cost, high-efficiency solar cell based on dye-sensitized colloidal TiO2 films” , Nat., vol. 353, pp. 737–740,
1991.
[3] A. Yella, H.-W. Lee, H.N. Tsao, C. Yi, A.K. Chandiran, M.K. Nazeeruddin, E.W.-G. Diau, C.-Y. Yeh, S.M. Zakeeruddin and M. Gratzel,
“Porphyrin-sensitized solar cells with cobalt(II/III)-based redox electrolyte exceed 12 percent efficiency”, Sci., vol. 334, pp. 629–634, 2011. [4] J. Baxter, “Nanoscale design to enable the revolution in renewable energy”, Energy Environ. Sci., vol. 2, pp. 559-588, 2009.
[5] M.T. Byrne and Y.K. Gun’ko, “Recent advances in research on carbon nanotube–polymer composites”, Adv. Mater., vol. 22, pp. 1672-1688, 2010.
[6] S. Mozaffari, M. Dehghan, M. Borhanizarandi and M. Reza Nateghi, “Effect of single-wall carbon nanotubes on the properties of polymeric gel electrolyte dye-sensitized solar cells”, J. Solid State Electrochem., vol. 18, pp. 655–663, 2014.
[7] S. Kim, E.J. Hwang, Y. Jung, M. Han and S.J. Park, “Ionic conductivity of polymeric nanocomposite electrolytes based on poly(ethylene oxide) and organo-clay materials”, Colloids Surf. A, vol. 313, pp. 216−219, 2008.
[8] H. Yang, M. Huang, J. Wu, Z. Lan, S. Hao and J. Lin, “The polymer gel electrolyte based on poly(methyl methacrylate) and its application in quasi-solid-state dye-sensitized solar cells”, Mater. Chem. Phys., vol. 110, pp. 38–42, 2008.
[9] V. Suryanarayanana, K.M. Lee, W.H. Ho, H.C. Chen and K.C. Ho, “A comparative study based on PVDF-HFP and liquid electrolytes, containing imidazolinium ionic liquids of different carbon chain lengths in DSSCs”, Sol. Energy Mater. Sol. Cells, vol. 91, pp. 1467–1471, 2007.
[10] J. Shi, L. Wang, Y. Liang, F. Cheng and J. Chen, “All-solid-state dye-sensitized solar cells with alkyloxy-imidazolium iodide ionic polymer/SiO2 nanocomposite electrolyte and triphenylamine-based organic dyes”, J. Phys. Chem. C, vol.114, pp. 6814–6821, 2010.
[11] G. Calogero, G. Di Marco, S. Cazzanti, S. Caramori, R. Argazzi, A.D. Carlo and C.T. Bignozzi, “Efficient dye-sensitized solar cells using red turnip and purple wild Sicilian prickly pear fruits”, Inter. J. Mol. Sci., vol. 11, pp. 254–267, 2010.
[12] A.R.H. Martinez, M. Esteves, S. Vargas, F. Quintanilla and R. Rodriguez, “New dye sensitized solar cells obtained from extracted bracts of Bougainvillea glabra and spectabilis betalain pigments by different purification processes”, Inter. J. Mol. Sci., vol. 12, pp. 5565–5576, 2012. [13] G. Calogero, H.J. Yum, A. Sinopoli, G. Di Marco, M. Gratzel and M.K. Nazeeruddin, “Anthocyanins and betalains as light-harvesting
pigments for dye-sensitized solar cells”, Sol. Energy, vol. 86, pp. 1563–1575, 2012.
[14] C.G. Garcia, A.S. Polo and N.Y.M. Iha, “Fruit extracts and ruthenium polypyridinic dyes for sensitization of TiO2 in photoelectrochemical solar
cells”, J. Photochem. Photobiol. A: Chemistry, vol. 160, pp. 87–91, 2003.
[15] K. Prabakaran, S. Mohanty and S. K. Nayak, “PEO/PVdF–HFP electrolytes for natural dye sensitized solar cell applications: effect of modified nano-TiO2 on electrochemical and photovoltaic performance”, J. Mater. Sci.: Mater. Electron., vol. 26, pp. 3887-3897, 2015.
[16] E. Yamazaki, M. Murayama, N. Nishikawa, N. Hashimoto, M. Shoyama and O. Kurita, “Utilization of natural carotenoids as photosensitizers for dye-sensitized solar cells”, Sol. Energy, vol. 81, pp. 512–516, 2007.
[17] R. Hemmatzadeh and A. Mohammadi, “Improving optical absorptivity of natural dyes for fabrication of efficient dye-sensitized solar cells”, J. Theor. Appl. Phys., vol. 7, pp. 57-63, 2013.
[18] R. Asha and B. Beena, “Structural and optical absorption analysis of CuO nanoparticles”, Indian J. Adv. Chem. Sci., vol. 2, pp. 158-161, 2014. [19] R. Adel, T. Abdallah, Y.M. Moustafa, A.M. Al-sabagh and H. Talaat, “Effect of polymer electrolyte on the performance of natural dye
sensitized solar cells”, Superlattices Microstruct., vol. 86, pp. 62–67, 2015.
[20] G. Veerappan, K. Bojan and S.-W. Rhee, “Amorphous carbon as a flexible counter electrode for low cost and efficient dye sensitised solar cell”, Renew. Energy, vol. 41, pp. 383-388, 2012.
[21] A. Boyo, O. Paul, I. Abdulsalami, O. Surukite, H.O. Boyo and H. Boyo, “Application of Hibiscus Sabdariffa and leaves of Azardirachta Indica calyxes as sensitizers in dye sensitized solar cells”, Inter. J. Eng. Res. Dev., vol. 8, pp. 38-42, 2013.
[22] X.D. Ma, X.F. Qian, J. Yin and Z.K. Zhu, “Preparation and characterization of polyvinyl alcohol–selenide nanocomposites at room temperature”, J. Mater. Chem., vol.12, pp. 663-666, 2002.
[23] G. Jing, G. Zhen-Li, Y. Xiao-Li, G. Shu, Z. Zhong-Liang and W. Bo, “Investigation of the free volume and ionic conducting mechanism of poly(ethylene oxide)-LiClO4 polymeric electrolyte by positron annihilating lifetime spectroscopy. Chin. Phys. B, vol. 21, pp. 107803(1-7),