| INVESTIGATION
Fluctuating Selection in the Moran
Antony M. Dean,*,†,‡,1Clarence Lehman,†and Xiao Yi†,‡
*State Key Laboratory of Biocontrol, School of Life Sciences, Sun Yat-sen University, Guangzhou 510275, People’s Republic of China and†Department of Ecology, Evolution, and Behavior and‡BioTechnology Institute, University of Minnesota, St. Paul, Minnesota 55108
ABSTRACTContrary to classical population genetics theory, experiments demonstrate thatfluctuating selection can protect a haploid polymorphism in the absence of frequency dependent effects onfitness. Using forward simulations with the Moran model, we confirm our analytical results showing that afluctuating selection regime, with a mean selection coefficient of zero, promotes polymorphism. Wefind that increases in heterozygosity over neutral expectations are especially pronounced whenfluctuations are rapid, mutation is weak, the population size is large, and the variance in selection is big. Lowering the frequency offluctuations makes selection more directional, and so heterozygosity declines. We also show thatfluctuating selection raisesdn/dsratios for polymorphism, not only by sweeping selected alleles into the population, but also by purging the neutral variants of selected alleles as they undergo repeated bottlenecks. Our analysis shows that randomlyfluctuating selection increases the rate of evolution by increasing the probability of fixation. The impact is especially noticeable when the selection is strong and mutation is weak. Simulations show the increase in the rate of evolution declines as the rate of new mutations entering the population increases, an effect attributable to clonal interference. Intriguingly,fluctuating selection increases thedn/dsratios for divergence more than for polymorphism, a pattern commonly seen in comparative genomics. Our model, which extends the classical neutral model of molecular evolution by incorporating random fluctuations in selection, accommodates a wide variety of observations, both neutral and selected, with economy.
KEYWORDSfluctuating selection; Moran model; heterozygosity; rate of evolution
A
LL environments vary. Yet molecular sequence analyses interpret patterns of polymorphism and divergence, as-suming that selection is constant and directional. We extend the classic neutral model of molecular evolution to incorpo-ratefluctuating selection. Contrary to classical selection the-ory, fluctuating selection can promote polymorphism in haploids in the absence of frequency-dependent fitness ef-fects. The conditions for neutralfixation are broadened so that alleles temporarily subject to directional selection mightfix as if neutral. Fluctuating selection raises thedn/dsratio fordi-vergence more than for polymorphism, a pattern commonly seen in genomic comparisons.
Available field evidence suggests selection fluctuates in direction over time (Dobzhansky 1943; Fisher and Ford 1947; Lynch 1987; Cainet al.1990; Cook and Jones 1996; Saccheri
et al.2008). However, the importance offluctuating selection in patterning polymorphisms, probabilities offixation, and evolutionary divergence remains poorly understood. Clas-sical population genetics theory suggests thatfluctuating selection promotes polymorphism whenever the geometric meanfitness of the heterozygote is greater than both ho-mozygotes (Kimura 1954; Dempster 1955; Haldane and Jayakar 1963; Gillespie 1972, 1973; Jensen 1973; Karlin and Levikson 1974; Karlin and Liberman 1975; Felsenstein 1976; Maynard Smith 1998; Bell 2008). Fluctuating selec-tion alone cannot promote polymorphisms in haploids sim-ply because the clone with the largest geometric mean
fitness inevitably wins the competition. Only if fitness is frequency dependent (Felsenstein 1976; Bell 2008, 2010), as in the lottery model (Chesson and Warner 1981), or if re-combination between selected loci occurs (Kirzhner et al. 1994), can selection promote polymorphism in haploids.
In contrast to classical theory, experiments demonstrate that fluctuating selection can maintain a haploid/clonal polymorphism in the absence of frequency-dependent effects on fitness (Yi and Dean 2013). Key is in recognizing two sources of variability when using the growth ratesrAandra
Copyright © 2017 by the Genetics Society of America doi: 10.1534/genetics.116.192914
Manuscript received June 21, 2016; accepted for publication December 14, 2016; published Early Online January 19, 2017.
Available freely online through the author-supported open access option.
over a periodtto define the absolutefitnessesWA¼erAtand
Wa¼erat One (well-recognized) is variability in the
relative growth rate, rA=ra¼LogeWA=LogeWa The other (previously overlooked) is variability in the time available for growth,t.
Consider a serial transfer experiment. Following Yi and Dean (2013), letpandq= 12pbe the frequencies ofAand a immediately following dilution in fresh medium, and let eD.ibe the fold increase in population density after growth to
carrying capacity in environment i. Then the growth of the mixed culture at carrying capacity is described by perA:itiþqera:iti ¼eDi. This model [experimentally verified for strains ofEscherichia colicompeting for limiting glucose (Yi and Dean 2013)] describes exponential growth that ceases abruptly once the carrying capacity is reached. When A is rare the time taken to reach carrying capacity is t*
i ¼Di=ra:i. When a is rare the time taken isti**¼Di=rA:i.
Placing a bound on population size (i.e., restricting the fold-increase to eDi) means that the time spent growing to carrying capacity is a dependent variable, one that varies with allele frequency.
This frequency-dependent slippage in “time-for-growth” promotes diversity (Figure 1). Alleles experience more dou-blings when the leastfit is most common. This favors the rare,
fitter allele. Alleles experience fewer doublings when the
fittest is most common. This mitigates selection against the rare, lessfit allele. Fluctuating selection is passively biased in favor of rare alleles.
Motivated by the experimental results in Figure 1, we re-examined the impact of randomly fluctuating selection on polymorphism and evolution using two continuous time overlapping generation models. The first, of an infinite (though bounded) population, sets the stage for the second, of afinite population undergoing continuous mutation and allelic fixations. Results show that fluctuating selection in-deed promotes polymorphism, increases rates of evolution, and raises the ratio of nonsynonymous-to-synonymous sub-stitutions more for divergence than for polymorphism. Kimu-ra’s neutral model of molecular evolution is the limiting case where selection is zeroed.
Methods
Infinite populations
Basic model:The conditions needed forfluctuating selection to promote polymorphism in a population growing continu-ously at carrying capacity are identical to those in serial transfer (Dean 2005; Yi and Dean 2013). Consider two clonal (i.e., nonrecombining) populations (densities NA and Na)
competing in a succession ofnarbitrary environments (each of time interval ti) for a continuously replenished
growth-limiting nutrient (concentration Ri). Death rates are fixed
and birth rates vary with resource availability. To make mat-ters more concrete, and without loss of generality, let the populations inhabit a chemostat, a continuous culture device.
The differential equations describing the competition are during intervaliare:
dNA
dt ¼ ðrA:i2diÞNA; (1) dNa
dt ¼ ðra:i2diÞNa; (2) dRi
dt ¼diðRi:02RiÞ2 rA:i
Y NA2 ra:i
Y Na; (3)
where the per capita growth ratesrA.i=fA(Ri) andra.i=fa(Ri)
are increasing monotonic functions ofRi, the concentration of
resource in the growth chamber.Ri.0is the concentration of the limiting nutrient in the fresh medium entering the growth chamber.diis the chemostat dilution rate (the fractional rate at which fresh medium enters the growth chamber and spent medium and cells are washed out of it). Y is the yield co-efficient (the number of organisms produced per amount of limiting resource consumed).
During growth at quasi-steady state,dRi/dt0 and so the
mean population growth rate equals the dilution rate,prA.i+
qra.i=di. The growth rates vary with allele frequency; when
Ais rare, r*
A:i6¼r*a:i¼di and when ais rare, r**a:i6¼r**A:i¼di.
These changes are driven by changes in the quasi-steady state
concentration of the limiting nutrient,Ri. The total
popu-lation density remains constant becauseRi,,Ri0.0and so NA.i+Na.iYRi.0(Dean 2005).
Conditions for coexistence:For a rare competitor to invade a resident population at equilibrium with its environment re-quires that Pni¼1r*rare:iti.
Pn
i¼1r*resident:iti¼ Pn
i¼1diti. Hence,
mutual invasion, and thus polymorphism, is ensured when-ever the weighted arithmetic mean relative growth rates ofA anda(respectively) are both greater than one:
Xn
i¼1
diti
Pn j¼1djtj
r*
A:i
r*
a:i
!
.1; (4a)
Xn
i¼1
diti
Pn j¼1djtj
r**a:i r**A:i !
.1: (4b)
The weights,diti, are proportional to the number of
popu-lation doublings,ditiLog2e, needed to maintain population density (equivalent to the DiLog2e population doublings needed to reach carrying capacity in the serial transfer ex-periment). The weights vary with changes in the chemostat dilution rate and in the time spent in each environment (the fold-dilution and/or the carrying capacity in serial transfer experiments).
Taking reciprocals reveals that selective sweeps by common alleles are prevented when their weighted har-monic mean relative growth rates are ,1. For A and a (respectively):
1 ,
Xn
i¼1
diti
Pn j¼1djtj
r**
a:i
r**A:i !
,1; (5a)
1 ,
Xn
i¼1
diti
Pn j¼1djtj
r*
A:i
r*
a:i
!
,1: (5b)
Hence, polymorphism is ensured whenever an allele’s weighted arithmetic mean relative growth rate is .1 and its weighted harmonic mean relative growth rate is ,1 (Dean 2005; Yi and Dean 2013).
Relative fitness in discrete and continuous time: Popula-tion geneticists often define relativefitness in discrete time as WA:i=Wa:i¼eðrA:i2ra:iÞ and relative fitness in continuous
time as LogeðWA:i=Wa:iÞ ¼ ðrA:i2ra:iÞ. However, the sugges-tion that our model of selecsugges-tion is inherently frequency-dependent becauserA.iandra.ivary with allele frequency is
wrong. Halving the growth rate ofanecessarily doubles its generation time. A better way to write relative fitness is LogeðWA:i=Wa:iÞ ¼ ðrA:i=ra:i21Þra:ita:i;wherera.ita.i= Loge2 corresponds to oneageneration (doubling), andta.iis the
time needed to complete it. When quasi-steady-state growth rates are proportional to the concentration of the limiting resource, rA.i=aA.iRiandra.i=aa.iRi, and both
relative growth raterA.i/ra.i=aA.i/aa.iand relativefitness
(aA.i/aa.i21)Loge2 are unaffected by the changes in allele frequency. The conditions for a protected polymorphism simplify to
Xn
i¼1
diti
Pn j¼1djtj
aA:i
aa:i
.1; (6a)
1 ,
Xn
i¼1
diti
Pn j¼1djtj
aa:i
aA:i
,1: (6b)
Temporalfluctuations infitness can protect a polymorphism in the absence of frequency dependent effects on relativefitness (Figure 1).
It is the number of allelic doublings (i.e., generations) per environment that varies in a frequency-dependent manner. To invade, Amust grow faster than the resident agrowing at equilibrium with the chemostat dilution rate, r*
A:i.r*a:i¼di. As A approaches fixation, its growth rate
must slow to the dilution rate while a is washed out of the growth chamber,r**
A:i¼di.r**a:i. Hence, the number of
doublings experienced by A is frequency dependent; A experiences r*
A:itiLog2e.r*a:itiLog2e¼ditiLog2edoublings when rare but only r**
A:itiLog2e¼ditiLog2e.r**a:itiLog2e doublings when common. Both alleles experience more doublings in environments where the least fit allele is most common.
Nonoverlapping generations: Although we shall focus on continuous time overlapping generation models in this paper, it is worth pausing for a moment to consider the discrete time nonoverlapping generation version of our serial transfer model. The exponential growth of two competitors, perA:itiþqera:iti¼eDi; can be rewritten as pWgi
A:iþqW gi
a:i¼e
Di;whereW
A.iandWa.iare the absolutefi
t-nesses andgiis the frequency-dependent number of
genera-tions to carrying capacity during periodi. This reformulation admits two geometric progressions (say 1, 2, 4, 8, 16. . .and 1, 3, 9, 27, 81. . .). Adults need not survive from generation to generation. Overlapping generations are not needed for co-existence. This contrasts with the lottery model of Chesson and Warner (1981), where overlapping generations are es-sential to coexistence.
Frequency-dependent selection: Classical negative
frequency-dependent selection, with r*
A:i=r*a:i.1 and
r**
A:i=r**a:i,1, increases the likelihood of invasion by rare alleles
and reduces the likelihood of fixation by common alleles. Positive frequency-dependent selection, with r*
A:i=r*a:i,1
and r**
A:i=r**a:i.1, opposes the intrinsic bias in favor of rare
alleles and can prevent a polymorphism arising. In all that follows, we assume relative growth rates are not frequency dependent (i.e.,r*
A:i=r*a:i¼r**A:i=r**a:i¼aA:i=aa:i), which is
Probability of a polymorphism: Many environments vary cyclically and dramatically: tides, diurnal cycles, the seasons, etc. Imagine an infinite population with two alleles subject to
fluctuating selection in an environment that repeatedly cy-cles through an arbitrary number of seasons equal in length. Simulations (Figure 2) show that the variability in growth parametersaA.iandaa.ineeded to protect a polymorphism
becomes progressively smaller, and the correlation between them becomes progressively less important, as the number of periods per cycle is increased. At 10 periods per cycle, co-existence is likely only whenaA.iandaa.iare highly variable
and negatively correlated (Figure 2,n= 10). Conversely, the more similar the responses to environmental change, the less likely the two alleles can coexist. Nevertheless, a protected polymorphism is still possible with correlation coefficients as high as 0.9, givenaA.iandaa.iare sufficiently variable. By 104
seasons per cycle, a protected polymorphism is very likely, unlessaA.iandaa.ivary little and are tightly correlated
(Fig-ure 2,n= 10,000).
Random environments: Environmental variables can vary erratically without cycling. Let theaA.iandaa.ifor each period
i be drawn randomly from a bivariate distribution, with means EaA6¼Eaa, SDsVar(aA)6¼Var(aa), and a correlation
coefficient21,ra,1. The expected relative growth rates
ofAandawhen each is rare are, approximately (Kendall and Stuart 1979),
EðaA=aaÞ ¼
EaA
Eaa
"
1þVarðaaÞ E2aa
2CovðaA;aaÞ
EaAEaa
#
(7a)
Eðaa=aAÞ ¼
Eaa
EaA
"
1þVarðaAÞ E2aA
2CovðaA;aaÞ
EaAEaa
#
; (7b)
assuming that the doublings in each period (DiLog2e in a serial transfer experiment andditiLog2e in a chemostat) are uncor-related with the growth parametersaA.iandaa.i. The model
suggests a rare lessfit allele can still increase in frequency if the superior competitor’s growth rate is sufficiently variable. For example,Awill increase in frequency when EaA/Eaa,1
if a’s variance is sufficiently large to make E(aA/aa) .1.
Displacing a is not possible, however, because Eaa/EaA . 1;
any variability inA’s growth rate further inflates E(aa/aA).
The result is a balanced polymorphism in which the high
fitness ofais offset by its increased sensitivity to environmen-tal variability. Coexistence is not possible when the difference between the scaled variance and covariance [Var(aa)/E2aa2
Cov(aA,aa)/EaAEaa] is less than the difference in the relative
growth rates (Eaa/EaA21). Polymorphism is possible only
Figure 2 The probability that a polymorphism is protected in an infinite population increases with the number of seasons per cycle from n= 10 ton= 10,000, and as the growth pa-rameters become more variable (SDsa) and as
trade-offs become more severe (correlation co-efficientra,0). Simulations were implemented
in Mathematica. For each season i, pairs of growth rates (aAiandaai) were drawn randomly from a bivariate normal distribution, with means mA=ma= 1, a common SD (0#sa#0.35 and
the distribution truncated at zero), and a given correlation coefficient (21#ra#1). The
when a considerable overlap in the fitness distributions exists.
If the expected growth parameters are equal (EaA= Eaa=
1) and identically [Var(aA) =Var(aa)] though perhaps not
independently [Cov(aA,aa)6¼0] distributed, then
EðaA=aaÞ ¼1þs2að12raÞ; (8a)
Eðaa=aAÞ ¼1þs2að12raÞ: (8b)
The slightest variability in clonal growth rates (s2
a.0)
guar-antees a protected polymorphism except when they are per-fectly positively correlated (ra = 1). This result stands in
marked contrast to all analyses from classical population ge-netics, which predict that clonal polymorphisms cannot be protected byfluctuating selection (Kimura 1954; Dempster 1955; Haldane and Jayakar 1963; Gillespie 1972, 1973; Jensen 1973; Karlin and Levikson 1974; Karlin and Liberman 1975; Felsenstein 1976; Chesson and Warner 1981; Maynard Smith 1998; Bell 2008, 2010).
Finite populations without mutation
Polymorphisms cannot be protected infinite populations because rare alleles risk stochastic loss. Instead, fluctuating selection promotes polymorphism by retarding, rather than preventing, the loss of alleles. Weak selection fails to retard the loss of alleles to drift. Strong selection combined with infrequent environmental
fluctuations drives the directional loss of genetic diversity. The capacity for fluctuating selection to promote polymorphism therefore depends on the interaction between drift, selection, and the frequency of environmental changes.
The Moran model: We explored the interaction between drift, selection, and the frequency of environmental changes with a Moran model (Moran 1962) that we embedded in a resource, thereby forming an obvious stochastic analog to competition in chemostats. In both, reproduction and death are continuous and the populationfinite andfixed in size (N). The probability of a birth is proportional to the resource con-centration. The probability of a death is determined by afixed density independent death rate,di, which is equivalent to the
chemostat dilution rate,di.
In the Moran model, each birth is coupled to a death and so the population size remains constant. The transition state probabilities forA, frequencyj/N, are
pk;j¼
8 > > > > > > > > > > > > < > > > > > > > > > > > > :
rA:ij
rA:ijþra:iðN2jÞ
N2j
N for k¼jþ1
ra:iðN2jÞ
rA:ijþ ðN2jÞ
j
N for k¼j21
12
rA:iþra:i
rA:ijþra:iðN2jÞ
jðN2jÞ
N for k¼j
0 otherwise 9 > > > > > > > > > > > > = > > > > > > > > > > > > ;
i¼1;2:::;
(9a)
where the growth ratesrA.iandra.ifluctuate over periodsi=
1, 2. . .The density independent death rate does not appear in Equation 9a because it always cancels [e.g.,dij/(diN) =j/N].
Just as in chemostats, the absolute growth rates vary with allele frequency. WhenAis rare,ra:i¼aa:iR*i ¼di(as before,
R*
iis the resource abundance needed to maintain a pure
pop-ulation ofaat its equilibrium density), and whenais rare, rA:i¼aA:iR**i ¼di(R**i is the resource abundance needed to
maintain pure population of A at its equilibrium density). Again, proportional changes in growth rates render the rela-tive growth rates, rA.i/ra.i=aA.i/aa.i, independent of allele
frequency. Equation 9a can be rewritten as
pk;j¼
8 > > > > > > > > > > > > < > > > > > > > > > > > > :
ðaA:i=aa:iÞj ðaA:i=aa:iÞjþ ðN2jÞ
N2j
N for k¼jþ1 ðN2jÞ
ðaA:i=aa:iÞjþ ðN2jÞN
for k¼j21
12
ðaA:i=aa:iÞ þ1 ðaA:i=aa:iÞjþ ðN2jÞ
jðN2jÞ
N for k¼j
0 otherwise 9 > > > > > > > > > > > > = > > > > > > > > > > > > ;
i¼1;2:::;
(9b)
which shows that the probability that the next event, either the birth or the death of anAallele, is unaffected by changes in
Figure 3 The capacity offluctuating selection to pro-mote polymorphism in afinite population depends not only on population size, but also on the frequency of environmental change. In the symmetricfitness model (aA0.1/aa0.1=aa0.2/aA0.26¼1),fluctuations in every gen-eration (t= 1) shepherd alleles close to the nodal fre-quency of 0.5, thereby retarding the loss to drift. As
resource abundance. In both chemostats and the Moran model, the numbers of births per hr are determined by the death rates (with the allelic growth rates forced to vary proportionally to the allele frequencies). The time taken to produceNbirths istg.i= Loge2/dihrs in chemostats and
tg.i= Loge2/diin the Moran model. In consequence, an
envi-ronment that changes everyxtg.ihrs also changes everyxN
birth–death events.
The distribution ofAalleles (vj.t + 1= 0 toN) following
each birth–death event is given by the vectorvt+ 1, =Mivt
(i = 1, 2. . .) where Mi is the square (N + 1) tridiagonal
transition matrix for periodi[with probabilities of: no change in number (k=j) on the diagonal, unitary increases above (k=j+ 1), and unitary decreases below (k=j21)] andvtis
the vector of frequencies at timet(measured in birth-death events). In a cyclical environment with two alternating pe-riods the mean number of generations,G, until loss of one or other allele isG¼PNt¼1ðp0;1:iv1:tþpN;N21:ivN21:tÞt=N(i= 1, 2), wheret=Nis one generation.
Simulations were implemented in Mathematica. The mean time to fixation (the loss of either allele), for a haploid population of N = 50 individuals, initially with j = 25A alleles and assuming evolution by random genetic drift alone (aA.i=aa.i), isG= 34,164 generations. This estimate is close to
the expected time tofixation ofG=N(12p)/pLoge(12p) = 50 Loge2 = 34,657 generations. We attribute the small discrep-ancy to the theory assuming a much larger population size than 50 (Moran 1962).
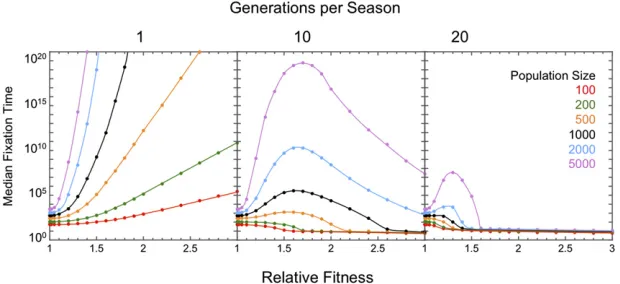
Symmetricallyfluctuating fecundities
Median time tofixation:What effect doesfluctuating selec-tion have on the rate of loss of polymorphism in a finite population? We computed the median time tofixation starting with equal allele frequencies (j/N= 0.5) and with symmetric relative fitnesses (aA0.1/aa0.1 = aa0.2/aA0.2 6¼ 1), which would guarantee a protected polymorphism if the population were infinite. Rapid switches in the direction of selection (every generation,ts= 1) retard the loss of polymorphism (Figure 3).
Switches everyt= 10 generations produce more nuanced results. Weak selection does little to promote polymorphism because it fails to shepherd allele frequencies close to the nodal frequency of 0.5. Strong selection accelerates the sto-chastic loss of alleles by driving their frequencies close to the boundaries of 0 and 1 at the end of each period. Witht= 10, the loss of diversity is slowest in large populations with in-termediate selection intensities (s 0.65 in Figure 3). Switches everyt = 20 generations further reduce both the time to fixation and the range in fitness that promotes polymorphism.
How does variability in the frequency of switching affect the rate of loss of polymorphism? Variability in the frequency of switching has little impact on the rate of loss of polymor-phism when selection is moderate in populations withN. 100 (compare switching every one and 10 generations for s , 0.1 in Figure 3). A single period .20 generations is
sufficient to purge polymorphism in populations withN, 103when selection is strong (s.0.5). Rare extended periods of environmental stasis purge variation, especially when se-lection is strong.
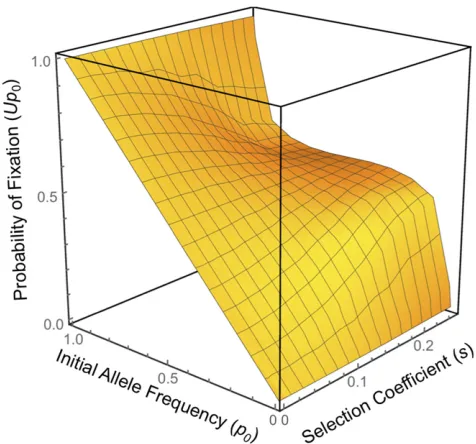
Probabilities offixation:What effect doesfluctuating selec-tion have on an allele’s probability of ultimatefixation? When the selection coefficients= |aA/aa21|,1/N, alleles
be-have as selectively neutral (Moran 1962) regardless of whether selection fluctuates. With strong symmetricfl uctu-ating selection (aA0.1/aa0.1 = aa0.2/aA0.2 .. 1) the rare currently beneficial allele will be driven back down in fre-quency when the selection reverses. However, it is not expected to return to its starting frequency because more doublings occur on the way up, when the leastfit allele is most common, and fewer doublings occur on the way down, when thefittest allele is most common. This bias ensures that rare alleles are more likely to fix than if selectively neutral (Figure 4).
Before considering what happens with fluctuating selec-tion, let usfirst remind ourselves offixation by a new allele subject to directional selection. The probability of ultimate
fixation of a new allele, frequency 1/Nwith constant relative
fitness 1 + s, is Up0 s for Ns. 1 (Moran 1962). Most beneficial alleles are lost when rare. Any beneficial allele that reaches an appreciable frequency will march, almost deter-ministically, towardfixation. For example,U0.05= 0.99 for s= 0.01 andN= 10,000. In effect,Up0sis the probability
Figure 4Probability of ultimatefixation (Up0) of an allele, initial frequency
p0, subject to symmetricfluctuating selection (aA0.1/aa0.1=aa0.2/aA0.2= 1 +s) in a population (N= 103) with selectionfluctuating each generation (t= 1). Rare alleles are more likely tofix than neutral alleles (forp0,0.5, as the surface steepens relative to the neutral edge ats= 0 assincreases). The probability that a rare allele reachesfixation is far lower when selection
that a beneficial allele, though still rare, attains sufficient numbers (p0Ns.4.6 forUp0= 0.99) to have escaped loss to drift.
Now consider a new allele (p0 = 1/N) with symmetric
fitnesses (aA0.1/aa0.1=aa0.2/aA0.2= 1 +s6¼1) in afinite population (size N) with rapid switches in the direction of selection (ts,1). Under these circumstances the mean se-lection coefficient of a rare allele iss¼ 1
2½1þsþð1þsÞ2 12 1s2/2. Hence, the probability that the allele attains a fre-quency sufficient to escape initial loss to drift iss2/2. The allele now enters a“zone of attraction,”where the impact of drift is sufficiently minimal that selection trains the allele to a stable oscillation around the nodal frequency of 0.5. This is reflected in Figure 4 as the inflection in theUp0surface at p0= 0.5 when selection is very strong (s= 0.25). Escape from the oscillation is random and does not depend on the initial allele frequency, hence the inflection. The probability offi x-ation from the stable oscillx-ation is 1/2 and so the probability of ultimatefixation of a new allele with symmetric fecundities [1 +sand (1 +s)21] isUp
01/2s2/2. Whens2/4,1/N, the allele willfix as if selectively neutral.
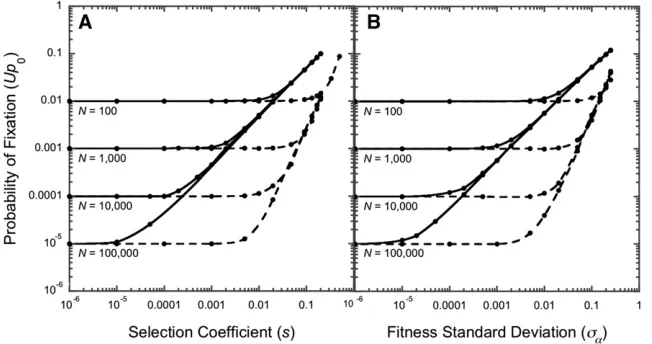
Simulations (Figure 5A) confirm that for sufficiently strong selection, the probability of ultimatefixation is proportional to the square of the selection coefficient,Up0s2/4. Allelesfix as if selectively neutral (or nearly so) forNs2,4 (found graph-ically as the intersection of linesUp0= 1/NandUp0=s2/4 on the log-log plots in Figure 5A). These results contrast with the classic analytical result forfluctuating selection in the Fisher–Wright model. There,ts,1, rather than Ns2,4, dictates that alleles fix as if selectively neutral (Takahata et al.1975).
How does the probability of ultimatefixation depend on the frequency of environmental switching? Infrequent switching imposes directional selection for many generations. A new allele eitherfixes with probabilitysif it is sufficiently benefi -cial (probability 0.5), or is purged with probability 1 if it is deleterious (probability 0.5). The chance that a new mutant allele ultimately sweeps through a population inhabiting an infrequently switching environment is therefore Up0=s/2 and the boundary for effective neutrality isNs,2 (confirmed
in simulations as the intersection of lines Up0 = 1/N and Up0=s/2 on the log-log plots in Figure 5A).
We explored the impact ofton the probability of ultimate
fixation in a population sizedN= 103. Probabilities of ulti-matefixation rise steeply betweent= 10 andt= 100 gen-erations for s . 0.04 (Figure 6A) and more gradually between t = 100 andt = 103 generations for s # 0.02. Weakly selected alleles (s,0.04)fix as if selectively neutral in rapidly changing environments but can become exposed to selection astis increased. Strongly selected alleles (s.0.02 in these simulations) are more likely tofix in rapidly changing environments (ts , 1) than in the Fisher–Wright model (Takahata et al. 1975). Simulations show Up0 0.01 . 1/N= 1/103 withs = 0.2 andt = 0.1 even thoughts= 0.02,,1 (Figure 6A). Variations in switching rates above t= 103and belowt= 10 have little effect onfixation prob-abilities in these simulations.
Randomlyfluctuating fecundities
We explored the balance between drift and selection for a biallelic Moran model using computer simulations with the following loop encoded in C:
1. Randomly choose an allele destined to die (based on allele frequency alone).
2. Randomly choose an allele destined to reproduce (based on allele frequency weighted by growth rate).
3. Increase the“birth”allele frequency by one. 4. Reduce the“death”allele by one.
5. Return to step 1.
At each environmental change, new allelic growth rates were drawn randomly from a normal distribution,N(1,sa),
truncated at zero and with 0# sa#0.25. In this model,
there is no recombination and the current growth rates are independent of the previous growth rates.
Probability offixation:Thefitness SD in our model plays a role similar to the selection coefficient in the symmetricfitness model. With rapid changes (ts#1), the meanfitness of a rare allele is EðrA=raÞ 1þs2að12raÞ (Equation 8, a and b), Figure 5 Forward simulations of the impact of ran-dom genetic drift,fluctuating selection, and the fre-quency of environmental change on the probability of ultimatefixation of a new allele,p0= 1/N, (A) with symmetricfitnesses (aA0.1/aa0.1=aa0.2/aA0.2= 1 +s6¼1) and (B) with random growth parameters (aA.iandaa.i) drawn from a normal distribution N(1, sa). Infrequent environmental changes (solid
making the probability of ultimate fixation of a new allele Up0s2að12raÞ=2. New alleles fix as if neutral when Ns2
að12raÞ,2. Forward simulations withra= 0 confirm
that lines Up0 = 1/N and Up0 = sa2/2 intersect at
sa¼
ffiffiffiffiffiffiffiffiffi 2=N p
on the log-log plot in Figure 5B.
In an infrequently switching environment selection is ef-fectively directional and so the probability that a new allele reachesfixation isUp0¼12aa:i=aA:iaA:i2aa:iwith weak
selection. The selection coefficient,s=aA.i2aa.i, is
distrib-uted as N½0; ffiffiffiffiffiffiffiffiffiffiffiffiffiffiffiffiffiffiffiffiffiffiffiffiffi2s2
að12raÞ
p
(Kendall and Stuart 1979). A new allele is purged with probability 1 ifs,0 (probability 0.5). The probability of ultimate fixation when s . 0 is therefore approximately half the mean of the folded dis-tribution N½0; ffiffiffiffiffiffiffiffiffiffiffiffiffiffiffiffiffiffiffiffiffiffiffiffiffi2s2
að12raÞ
p
(Kendall and Stuart 1979), Up0
ffiffiffiffiffiffiffiffiffiffiffiffiffiffiffiffiffiffiffiffiffiffiffiffiffiffiffiffi s2
að12raÞ=p
p
. Simulations withra= 0 confirm that
lines Up0 = 1/N and Up0 ¼sa=pffiffiffiffip intersect at
approxi-matelysa¼
ffiffiffiffi p
p
=Non the log-log plot in Figure 5B. Variabil-ity in the frequency of environmental shifts outside the range 0.1,ts,102has little impact on the probabilities offixation (corresponding to the range 1,t,103in Figure 6B). Finite populations with mutation
We explored the balance between mutation, drift, and selec-tion for a multiallelic Moran model using by modifying the computer simulation loop:
1. Randomly choose an allele destined to die (based on allele frequency alone).
2. Randomly choose an allele destined to reproduce (based on allele frequency weighted by growth rate).
3. Choose a random number to determine if a mutation occurs.
4. If no mutation occurs, increase the“birth”allele frequency by one else create a new allele with a new randomly cho-sen growth rate.
5. Reduce the“death”allele by one. 6. Return to step 1.
As before, new allelic growth rates were drawn randomly from a normal distribution,N(1,sa), at each environmental
change. There is no recombination, current growth rates are
independent of previous growth rates, and the growth rates of the mutants and their parents are uncorrelated.
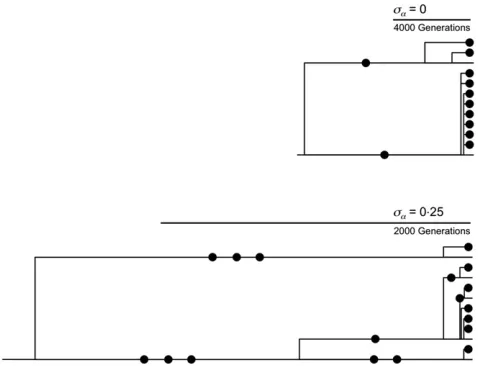
Randomlyfluctuating selection, like symmetricfluctuating selection, ensures that rare alleles are more likely tofix than if selectively neutral. This increases the rate of evolution (Figure 7). The coalescent is also affected. Unlike a typical neutral coalescent, many mutations exist only in descen-dants, the original alleles on which the mutationsfirst arose having gone extinct. Genealogies can appear as ancient bal-anced polymorphisms, even though they are relatively young (Figure 7).
Allelic heterozygosity:Simulations show that rapid random
fluctuations in selection (ts,1) elevate polymorphism. The impact is especially dramatic, with allelic heterozygosity (H= 12Ppi2) raised$1000-fold above neutral
expecta-tions, when the number of new mutant alleles produced each generation (Nu) is low and the selection (Nsa2) is strong Figure 6 Forward simulations of the impact of ran-dom genetic drift,fluctuating selection, and period length (t) on the probability of ultimatefixation of a new allele,p0= 1/Nin a population sizedN= 103. (A) Simulations with symmetricfitnesses (aA0.1/aa0.1= aa0.2/aA0.2= 1 +s6¼1). (B) Simulations used random
fitnesses drawn from a normal distribution,N(1,sa).
Simulations were implemented in C.
(Figure 8A). Randomfluctuations in growth rates have little impact on heterozygosity whenNsa2,1. The ability of
ran-domlyfluctuating selection to increase the absolute number of alleles in the population is relatively modest (Figure 8B). The curvature of the surface suggests that many more alleles might accumulate in larger populations (N.104). Simulat-ing such large populations is impractical, even on supercom-puters, as each individual birth and death must be counted in Moran models. Heterozygosities are raised byflattening the Ewens (1972) sampling distribution (Figure 9) in small and moderately sized populations (N,104).
Mixed model: selection and neutrality: We modified our multiallelic Moran simulation to include neutral mutations as follows:
1. Randomly choose an allele destined to die (based on allele frequency alone).
2. Randomly choose an allele destined to reproduce (based on allele frequency weighted by growth rate).
3. Choose a random number to determine if a mutation occurs.
4. If no mutation occurs, increase the“birth”allele frequency by one else create a new allele and choose a random num-ber to determine if the mutation is neutral or confers a new randomly chosen growth rate.
5. Reduce the“death”allele by one. 6. Return to step 1.
As before, new allelic growth rates were drawn randomly from a normal distribution,N(1,sa), at each environmental
change. There is no recombination and current growth rates are independent of previous growth rates. New alleles carry-ing neutral mutations are assigned the parentalfitness in all environments. The growth rates of new alleles with select-able mutations are uncorrelated with those of their parents. A minority of mutations subject to randomlyfluctuating selection can increase the rate of evolution dramatically when the supply of new mutants is limited (smallNu) and selection
is strong (largeNs2
a). Under these circumstances populations
rarely have more than two alleles segregating at a time and so the rate of evolution is simply the product of the number of new alleles appearing each generation,Nu, multiplied by the probability of ultimatefixation (1/Nfor neutral alleles and sa2/2 for selected alleles). The rate of evolution relative to
neutral expectations (withrmutations selected and 12x neutral) is [(dn+ ds)/u] = (xNus2a/2 + (1 2x)u)/u=
xNs2a/2 + 12x. Increases in the rate of evolution are entirely
attributable to randomfluctuations in selection.
The relative rate of evolution [(dn+ds)/u] declines as the
supply of new mutants (Nu) increases (Figure 10A), an effect attributable to the tendency of clonal interference to slow
Figure 8 The impact offluctuating selection on polymorphism. (A) Heterozygosity as a function of population size (N), variance in growth rate (sa2), and mutation rate (u)
withfitnesses drawn from a normal distribu-tion [N(1,sa)] each generation (t= 1). The
broad red line denotes the neutral expecta-tion. Heterozygosities appear unaffected by
fluctuating selection in populations to the right of the thin red line denotingNsa2= 1. (B)
The number of alleles is less affected by
fluctuating selection than is heterozygosity in both small (N= 100, red) and moderately large (N = 10,000, tan) populations. The curvature of the surface suggests that large populations (N . 10,000 require huge amounts of CPU time and so were not sim-ulated) may be able to accumulate many more alleles. Parameters were varied as fol-lows: 102#N$104, 1028#u$1021, 1023#Nu$1,t= 1.
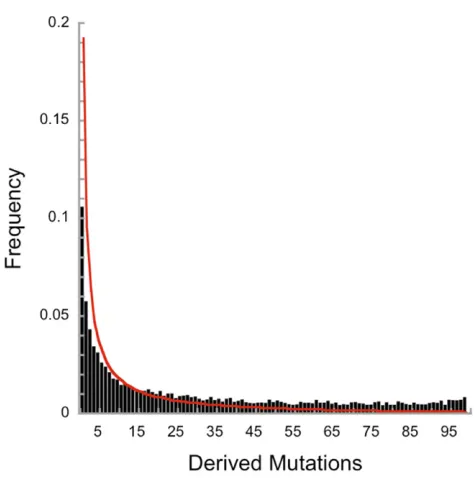
Figure 9 The impact offluctuating selection on the site frequency spec-trum in a sample of 100 alleles drawn from a population ofN= 104with
u= 1024, ands
rates offixation (it takes much longer tofix an allele when multiple alleles of similar fitness compete). Increases in ei-ther population size or the proportion of new mutants subject to randomlyfluctuating selection also increase [(dn+ds)/u].
However, as both intensify clonal interference (both increase the number of segregating alleles in the population), the impact on [(dn + ds)/u] is smaller than with increases in
s2
aalone.
The nonsynonymous-to-synonymous substitution ratio for divergence (dn/ds.div) follows a similar pattern, with clonal interference reducingdnrelative todsas the supply of new
mutants (Nu) increases. Changes in the nonsynonymous-to-synonymous ratio for polymorphism (dn/ds.poly) are less dra-matic. In consequence, thedn/dsratio for divergence is raised
relative to thedn/dsratio for polymorphism (Figure 10B).
Very strongfluctuating selection reduces polymorphism by driving alleles to fixation before the environment changes. Weaker selection, sufficiently strong to maintain selected alleles in a rapidly changing environment, also reduces poly-morphism (Figure 11). The phenomenon arises because os-cillations in frequency allowing drift to purge alleles of their selectively equivalent variants. The net effect is forfl uctuat-ing selection to purge neutral variation.
Data availability
The authors state that all data necessary for confirming the conclusions presented in the article are represented fully within the article.
Results and Discussion
We explored two models offluctuating selection in a haploid species. The first, a continuous time model of an infinite population with two alleles subject to periodic changes in
fitness, was explored analytically. The second, a probabilistic model of a finite population subject to periodic changes in selection, was explored analytically and by simulation using the Moran framework. Both confirm that, contrary to classical population genetics theory (Kimura 1954; Dempster 1955; Haldane and Jayakar 1963; Gillespie 1972, 1973; Jensen 1973; Karlin and Levikson 1974; Karlin and Liberman 1975; Takahata et al. 1975; Felsenstein 1976; Maynard
Smith 1998; Bell 2008, Huerta-Sanchezet al.2008; Uecker and Hermisson 2011; Waxman 2011; Gossmannet al.2014; Cvijovicet al.2015),fluctuating selection can promote poly-morphism in haploids in the absence of frequency-dependent effects onfitness.
The conditions for coexistence in a temporally variable environment (Equations 4 and 5) are similar to those derived by Levene (1953) for coexistence in a spatial model with random dispersal of alleles into habitats at each generation. A common criticism of the Levene model as a mechanism for maintaining polymorphism is that it is robust only with large
fitness differences (Hoekstraet al.1985). This criticism ap-plies to our model when cycling between two habitats. How-ever, the likelihood of coexistence increases with the number of habitats (Figure 2) to the point that, in a randomly chang-ing environment, a protected polymorphism is virtually guar-anteed when the meanfitnesses are equal (Equation 8).
The capacity offluctuating selection to promote polymor-phism is huge. The time tofixation for either of two alleles, with initial frequencies of 0.5 in a population sizedN= 5000, isG= 5000 Loge2 = 34,657 generations if they are neutral, andG= 1021generations if theirfitnesses alternate between 1.4 and 1.421each generation (Figure 3), which is 2000 times the age of the universe, assuming one generation per second. While a cyclical environment with symmetricfitnesses repre-sents an extreme, it illustrates the huge potential offl uctuat-ing selection to maintain polymorphism.
Simulations (Figure 8) show that rapidly fluctuating se-lection has the capacity to elevate polymorphism, especially when selection is strong and mutation is weak. At least in moderately sized populations, this is achieved byflattening the Ewens sampling distribution rather than by increasing the number of alleles in the population. Indeed, rapidlyfl uc-tuating selection can purge neutral variants of selected alleles through repeated bottlenecks (Figure 11). This suggests that high frequency nonsynonymous substitutionsflanked by di-vergent regions depauperate in silent replacements might reflect the action offluctuating selection (Tiffenet al.2004). Fluctuating selection must be strong to maintain a bal-anced polymorphism. The symmetric fluctuating selec-tion model needs s.pffiffiffiffiffiffiffiffiffi2=N and the random selection model needssa
ffiffiffiffiffiffiffiffiffiffiffiffiffiffi 12ra
p
.pffiffiffiffiffiffiffiffiffi1=N. Although the intensity
of selection declines as the square root of the population size, we still needs.0:0014 orsa
ffiffiffiffiffiffiffiffiffiffiffiffiffiffi 12ra
p
.0:001 in a popula-tion sizedN= 106. Thefluctuations in selection must be even larger if the alleles differ in their mean growth rates.
To what extent doesfluctuating selection promote diver-sity in natural populations and communities? Classic work on Drosophila (Dobzhansky 1943), Panaxia dominula (Fisher and Ford 1947; Cook and Jones 1996), Cepaea nemoralis (Cainet al.1990),Daphnia(Lynch 1987), andBison betularia (Saccheri et al. 2008) suggests that selection can be suffi -ciently strong, sufficiently variable, and the fluctuations sufficiently rapid to promote polymorphisms. A recent genome-wide survey of a North American population of Dro-sophila melanogaster(Berglandet al.2015) illustrates the huge capacity of fluctuating selection to maintain polymorphisms for many generations. This study identified hundreds of sea-sonally oscillating single nucleotide polymorphisms, with esti-mated selection coefficients lying between 0.05 and 0.5 per generation. Some polymorphisms predate the5 million year old divergence with D. simulans. If these results are typical then many polymorphisms might be maintained byfluctuating selection.
What is the probability of establishing a balanced poly-morphism in a seasonal environment? The probability is simply the probability that a new allele escapes initial loss to drift;Ppolys2=2 for the symmetricfluctuating selection
model and Ppolys2að12raÞ for the random selection
model. Assuming genic selection, the probability that a new allele escapes drift to establish a balanced fluctuating poly-morphism lies between 0.052/2 = 0.00125 and 0.52= 0.25. With a mutation rate of 1029per site per generation, 1 out of 20 mutations being viable, an average gene with 103bases, and a genome with 23104genes, we might expect between 1.2531026Nand 2.531024Nbalancedfluctuating poly-morphisms to arise per generation. That hundreds of single nucleotide polymorphisms oscillate seasonally in a North American population of D. melanogaster (Bergland et al. 2015) is by no means excessive, given an effective size of Ne104.
Many mutations of small functional effect likely experience
fluctuating selection asfitness optima wobble with changes in the environment. For these alleles, the criterion to fix as if selectively neutral is less stringent than if selection were constant and directional (e.g., s,pffiffiffiffiffiffiffiffiffi4=N rather than s,1=N in the classic neutral model). A new allele subject to a selection coefficient ofs= 0.01 that changes direction each generation in a population sizedN= 103has the same probability offixing as a neutral allele. This result holds true even when switches in the direction of selection are as in-frequent as one in 102generations (Figure 6A). Now a selec-tion coefficient of 0.01 is readily measured in a competition experiment over a period far greater than 100 generations (Lunzer et al. 2002). An allele, demonstrated to have changed frequency by natural selection under current condi-tions, may neverthelessfix as if selectively neutral, were the selection to change direction from time to time. Conse-quently, conclusions drawn from ecological genetics might occasionally be in conflict with the conclusions drawn from molecular evolution.
Huerta-Sanchezet al.(2008) and Gossmannet al.(2014) explored the impact of fluctuating selection on molecular evolution using the Fisher–Wright model. They concluded that randomlyfluctuating selection increases the probability of ultimatefixation and raises thedn/dsratio for divergence
over polymorphism in a manner similar to that expected un-der positive directional selection. We confirmed their results with our Moran simulations (Figure 10). However, our model extends their results in several ways. We relaxed the assump-tion that selecassump-tion is strong and mutaassump-tion is weak to allow many alleles to simultaneously cosegregate in the population. Wefind that increasing the mutation rate (u) increases poly-morphism and thereby intensifies clonal interference, caus-ing the relative rates offixation and evolution [(dn+ds)/u]
to slow and thedn/dsratio for divergence to decline (Figure
10A). We assumed complete linkage so that thedn/dsratio
for polymorphism receives a boost when Nu. 1 from the large amplitudes experienced by selected alleles, which causes them to lose their neutral variants to drift whenever they become rare (Figure 11). Neither mechanism operates in the models of Huerta-Sanchezet al.(2008) and Gossmann et al.(2014) because: (1) clonal interference is not possible in a two-allele model, (2) fluctuating selection cannot purge
Figure 11 Strong fluctuating selection can either increase or decrease heterozygosity, depending on the number of new alleles (Nu) entering the population each generation. WhenNuis small,fluctuating selection inflates heterozygosity by evening the distribution of selected alleles com-pared to the neutral expectation. WhenNuis large, oscillations in the frequencies of selected alleles cause them to bottleneck each generation, purging them of their neutral variants. Selection varied fromsa= 0.1 to
neutral variation unlinked to selected sites, and (3)fl uctuat-ing selection reduces polymorphism in the Fisher–Wright model.
In their analyses offluctuating selection using the Fisher– Wright model, Karlin and Levikson (1974), Takahataet al. (1975), Gillespie (1991), and Cvijovicet al.(2015) showed that the frequency of temporal fluctuations infitness infl u-ences the outcome of selection. They found that a new allele would fix as if selectively neutral forts,1. For example, simulations show the probability offixing a new allele in a population sizedN= 104withs=60.1 andt= 1, isU
p0 0.0001 (i.e., a neutral outcome forts ,1). In the Moran model with rapidly fluctuating symmetric selection, these exact same parameters produce Up0 0.12/4 = 0.0025 (i.e., a nonneutral outcome forts,1, Figure 6A).
Why do the models differ? Allele frequencies are expected to return to their starting values at the end of each cycle in a Fisher–Wright model with symmetric fitnesses (selection is not biased in favor of either allele). Rapid fluctuations in
fitness produce such small displacements in allele frequen-cies that alleles drift as if selectively neutral. Fluctuating se-lection assumes a different architecture in our model. Rare alleles are favored because both competitors experience more generations when the leastfit is most common (which benefits thefitter rare allele) and fewer generations when the mostfit is most common (which mitigates selection against the same rare allele when it is less fit). Selection is not expected to return the allele frequencies to their starting values at the end of each cycle even when the changes in
fitness are exactly symmetric. Instead, the rare allele is expected to increase in frequency. Selection must be weak (s,pffiffiffiffiffiffiffiffiffi4=N) and environmental fluctuations rapid (ts,1) to overcome this intrinsic bias (Figure 5 and Figure 6).
In 1924, Haldane started his exploration of the genetic basis of evolution using a discrete time nonoverlapping gen-eration model (Haldane 1924). To accommodate sexual reproduction in diploids, he abandoned certain key demo-graphic and ecological processes (e.g., continuous reproduc-tion in bounded populareproduc-tions). His simplification was brilliant, and perfectly suited for his goal of studying genes in popula-tions (Haldane 1932). There can be no greater praise for this pioneering enzymologist (Haldane 1930) than to note that his is the approach we all use to study evolutionary genetics today. Yet, abandoning continuous reproduction in bounded populations came with a hidden cost. Haldane’s simplifi ca-tion, so ideal for studying directional selection in constant environments, forces the generations to march in lock step with seasonal changes. His model does not accommodate frequency-dependent changes in the number of allelic dou-blings (generations) per season. Both in our experiments (Yi and Dean 2013) and in our models, this frequency-dependent slippage in generations promotes diversity.
In our random selection model (equivalent to a diploid model with genic selection) evolutionary outcomes are the emergent properties of three inescapable processes: mutation, geometric growth, and resource depletion (to place a bound
on population size). The model brings selection and neu-trality under the same umbrella to reveal a middle ground, where weakly selected alleles contribute both to polymor-phism andfix as if selectively neutral. Unlike the classical population genetic models of fluctuating selection, our model has direct empirical support (Figure 1 shows selec-tion can protect a polymorphism in a haploid species) and predicts the higherdn/dsratios for divergence than for
poly-morphism commonly observed among closely related taxa (Hughes 2008; Wagner 2008). We suggest that our random selection model provides a realistic alternative to the Fisher–Wright model for describingfluctuating selection in
finite populations.
Acknowledgments
We thank Brian Golding for encouragement and Lindi Wahl, Nick Barton, and an anonymous reviewer for their thought-ful, constructive criticisms and suggestions. This work was carried out in part using computing resources at the University of Minnesota Supercomputing Institute. A.M.D. gratefully acknowledges financial support from the Recruitment Pro-gram of Global Experts (1000 Talents Plan) of the People’s Republic of China.
Literature Cited
Bell, G., 2008 Selection, Ed. 2. Oxford University Press, Oxford.
Bell, G., 2010 Fluctuating selection: the perpetual renewal of
ad-aptation in variable environments. Philos. Trans. R. Soc. Lond. B
Biol. Sci. 365: 87–97.
Bergland, A. O., E. L. Behrman, K. R. O’Brien, P. S. Schmidt, and D.
A. Petrov, 2015 Genomic evidence of rapid and stable adaptive
oscillations over seasonal time scales in Drosophila. PLoS Genet. 10: e1004775.
Cain, A. J., L. M. Cook, and J. D. Currey, 1990 Population size and
morph frequency in a long-term study ofCepaea nemoralis. Proc.
R. Soc. Lond. B Biol. Sci. 240: 231–250.
Chesson, P. L., and R. R. Warner, 1981 Environmental variability
promotes coexistence in lottery competitive systems. Am. Nat.
117: 923–943.
Cook, L. M., and D. A. Jones, 1996 The medionigra gene in the
mothPanaxia dominula: the case for selection. Philos. Trans. R.
Soc. Lond. B Biol. Sci. 351: 1623–1634.
Cvijovic, I., B. H. Good, E. R. Jerison, and M. M. Desai, 2015 Fate
of a mutation in afluctuating environment. Proc. Natl. Acad.
Sci. USA 112: E5021–E5028.
Dean, A. M., 2005 Protecting haploid polymorphisms in
tempo-rally variable environments. Genetics 169: 1147–1156.
Dempster, E. R., 1955 Maintenance of genetic heterogeneity. Cold
Spring Harb. Symp. Quant. Biol. 20: 25–31.
Dobzhansky, T., 1943 Genetics of natural populations. IX.
Tem-poral changes in the composition of populations ofDrosophila
pseudoobscura. Genetics 28: 162–186.
Ewens, W., 1972 The sampling theory of selectively neutral
al-leles. Theor. Popul. Biol. 3: 87–112.
Felsenstein, J., 1976 The theoretical population genetics of
vari-able selection and migration. Annu. Rev. Genet. 10: 253–280.
Fisher, R. A., and E. B. Ford, 1947 The spread of a new gene in
natural conditions in a colony of the mothPanaxia dominulaI.
Gillespie, J. H., 1972 The effects of stochastic environments on allele
frequencies in natural populations. Theor. Popul. Biol. 3: 241–248.
Gillespie, J. H., 1973 Natural selection with varying selection
co-efficients - a haploid model. Genet. Res. 21: 115–120.
Gillespie, J. H., 1991 The Causes of Molecular Evolution. Oxford
University Press, New York.
Gossmann, T. I., D. Waxman, and A. Eyre-Walker,
2014 Fluctuating selection models and McDonald-Kreitman
type analyses. PLoS One 9: e84540.
Haldane, J. B. S., 1924 A mathematical theory of natural and
arti-ficial selection. Part 1. Trans. Cambridge Phil. Soc. 23: 19–41.
Haldane, J. B. S., 1930 Enzymes. Longmans, Green and Co. Ltd,
London.
Haldane, J. B. S., 1932 The Causes of Evolution. Longmans, Green
and Co. Ltd, London.
Haldane, J. B. S., and S. Jayakar, 1963 Polymorphism due to
selection of varying direction. J. Genet. 58: 237–242.
Hoekstra, R. F., R. Bijlsma, and H. A. J. Dolman, 1985 Polymorphism
from environmental heterogeneity: models are only robust if the
heterozygote is close infitness to the favoured homozygote in each
environment. Genet. Res. 45: 299–314.
Huerta-Sanchez, E., R. Durrett, and C. D. Bustamante,
2008 Population genetics of polymorphism and divergence
underfluctuating selection. Genetics 178: 325–337.
Hughes, A. L., 2008 Near neutrality: the leading edge of the
neu-tral theory of molecular evolution. Ann. N. Y. Acad. Sci. 1133:
162–179.
Jensen, L., 1973 Random selective advantages of genes and their
probabilities offixation. Genet. Res. 21: 215–219.
Karlin, S., and B. Levikson, 1974 Temporalfluctuations in
selec-tion intensities: case of small populaselec-tion size. Theor. Popul. Biol.
6: 383–412.
Karlin, S., and U. Liberman, 1975 Random temporal variation in
selection intensities: one-locus two-allele model. J. Math. Biol. 2: 1–17.
Kendall, M., and A. Stuart, 1979 Advanced Theory of Statistics,
Vol. I. MacMillan, New York.
Kimura, M., 1954 Process leading to quasi-fixation of genes in
natural populations due to random fluctuation of selection
in-tensities. Genetics 39: 280–295.
Kirzhner, V. M., A. B. Korol, Y. I. Ronin, and E. Nevo,
1994 Cyclical behavior of genotype frequencies in a twp locus
population underfluctuating haploid selection. Proc. Natl. Acad.
Sci. USA 91: 11432–11436.
Levene, H., 1953 Genetic equilibrium when more than one
eco-logical niche is available. Am. Nat. 87: 331–333.
Lunzer, M., A. Natarajan, D. E. Dykhuizen, and A. M. Dean,
2002 Enzyme kinetics, substitutable resources and
competi-tion: From biochemistry to frequency-dependent selection in
lac. Genetics 162: 485–499.
Lynch, M., 1987 The consequences of fluctuating selection for
isozyme polymorphisms in Daphnia. Genetics 115: 657–669.
Maynard Smith, J., 1998 Evolutionary Genetics, Ed. 2. Oxford
Uni-versity Press, Oxford.
Moran, P. A. P., 1962 The Statistical Processes of Evolutionary
The-ory. Clarendon Press, Oxford.
Saccheri, I. J., F. Rousset, P. C. Watts, P. M. Brakefield, and L. M.
Cook, 2008 Selection and geneflow on a diminishing cline of
melanic peppered moths. Proc. Natl. Acad. Sci. USA 105:
16212–16217.
Takahata, N., K. Ishii, and H. Matsuda, 1975 Effect of temporal
fluctuation of selection coefficient on gene frequency in a
pop-ulation. Proc. Natl. Acad. Sci. USA 72: 4541–4545.
Tiffen, P., R. Hacker, and B. S. Gaut, 2004 Population genetic
evidence for rapid changes in intraspecific diversity and allelic
cycling of a specialist defense gene in Zea. Genetics 168: 425–
434.
Uecker, H., and J. Hermisson, 2011 On thefixation process of a
beneficial mutation in a variable environment. Genetics 188:
915–930.
Wagner, A., 2008 Neutralism and selectionism: a network-based
reconciliation. Nat. Rev. Genet. 9: 965–974.
Waxman, D., 2011 A unified treatment of the probability offi
xa-tion when populaxa-tion size and the strength of selecxa-tion change
over time. Genetics 188: 907–913.
Yi, X., and A. M. Dean, 2013 Bounded population sizes,fl
uctuat-ing selection and the tempo and mode of coexistence. Proc.
Natl. Acad. Sci. USA 110: 16945–16950.