| INVESTIGATION
Selection Signatures Underlying Dramatic Male
In
fl
orescence Transformation During Modern Hybrid
Maize Breeding
Joseph L. Gage,* Michael R. White,* Jode W. Edwards,†Shawn Kaeppler,*,‡and Natalia de Leon*,1 *Department of Agronomy, University of Wisconsin–Madison, Wisconsin 53706,†United States Department of Agriculture -Agricultural Research Service Corn Insects and Crop Genetics Research Unit, Iowa State University, Ames, Iowa 50011, and ‡Wisconsin Crop Innovation Center, University of Wisconsin–Madison, Middleton, Wisconsin 53562
ORCID IDs: 0000-0001-5946-4414 (J.L.G.); 0000-0001-7867-9058 (N.d.L.)
ABSTRACTInflorescence capacity plays a crucial role in reproductivefitness in plants, and in production of hybrid crops. Maize is a monoecious species bearing separate male and female flowers (tassel and ear, respectively). The switch from open-pollinated populations of maize to hybrid-based breeding schemes in the early 20th century was accompanied by a dramatic reduction in tassel size, and the trend has continued with modern breeding over the recent decades. The goal of this study was to identify selection signatures in genes that may underlie this dramatic transformation. Using a population of 942 diverse inbred maize accessions and a nested association mapping population comprising three 200-line biparental populations, we measured 15 tassel morphological characteristics by manual and image-based methods. Genome-wide association studies identified 242 single nucleotide polymor-phisms significantly associated with measured traits. We compared 41 unselected lines from the Iowa Stiff Stalk Synthetic (BSSS) population to 21 highly selected lines developed by modern commercial breeding programs, and found that tassel size and weight were reduced significantly. We assayed genetic differences between the two groups using three selection statistics: cross population extended haplotype homozogysity, cross-population composite likelihood ratio, andfixation index. All three statistics show evidence of selection at genomic regions associated with tassel morphology relative to genome-wide null distributions. These results support the tremendous effect, both phenotypic and genotypic, that selection has had on maize male inflorescence morphology.
KEYWORDSmaize; inflorescence; tassel; selection; GWAS
T
HE male inflorescence, or tassel, of maize (Zea maysL.) is a branched structure that displays remarkable morpho-logical diversity. Tassels vary in length, number of branches, compactness, and curvature, all of which are capable of af-fecting the quantity and dispersal of pollen. Inflorescence architecture is crucial to reproduction in wind pollinated plants (Friedman and Barrett 2009) such as maize. As such,tassel size and shape are likely to have been subject to both natural and artificial selection. Tassels on teosinte plants, the wild progenitor of maize, are characterized by a large number (.50) of branches (Xuet al.2017), implying a reproductive advantage of numerous branches in natural populations. In cultivated maize, however, tassel size and branch number have decreased over the course of modern breeding (Meghjiet al.1984; Duvick 1997, 2005). Tassel size is neg-atively correlated with grain yield, putneg-atively due to shading caused by large tassels (Duncan et al. 1967; Hunter et al. 1969). At high planting densities typical of modern agro-nomic practices, tassels can intercept enough sunlight to reduce photosynthesis lower in the canopy, which can negatively affect assimilation of photosynthate in the ear (Duncanet al.1967; Wardlaw 1990; Hammeret al.2009). A study in tropical maize indicated that direct selection on branch number can result in an indirect increase in grain yield (Fischer et al. 1987), showing that the relationship
Copyright © 2018 J. L. Gageet al.
doi:https://doi.org/10.1534/genetics.118.301487
Manuscript received August 8, 2018; accepted for publication September 14, 2018; published Early Online September 25, 2018.
Available freely online through the author-supported open access option.
This is an open-access article distributed under the terms of the Creative Commons Attribution 4.0 International License (http://creativecommons.org/licenses/by/4.0/), which permits unrestricted use, distribution, and reproduction in any medium, provided the original work is properly cited.
Supplemental material available at Figshare: https://doi.org/10.25386/genetics. 7097813.
1Corresponding author: University of Wisconsin–Madison, 1575 Linden Dr., Room
between tassel and ear may be causative and persists beyond temperate germplasm.
Previous studies have identified quantitative trait loci (QTL) and quantitative trait nucleotides associated with dif-ferent aspects of tassel morphology and development that colocalize with teosinte branched1(tb1) and teosinte glume architecture1 (tga1), which were targets of domestication that changed plant and inflorescence architecture between teosinte and modern maize (Doebleyet al.1995; Wanget al. 2005; Brownet al. 2011; Wuet al.2016). A study mapping tassel architecture in a population of recombinant inbred lines derived from a cross between maize and teosinte iden-tified a QTL and evidence of selection at thebarren infl or-esence2 (bif2) locus (Xu et al. 2017), which has been characterized previously as decreasing the number of tassel branches and spikelets (McSteen and Hake 2001). The same study identifiedfive additional QTL that colocalized with in-florescence development genes and were in the list of genes identified as putatively selected during maize domestication by Huffordet al.(2012). Thesefindings provide evidence for selection on tassel morphology during domestication; how-ever, tassel morphology has continued to change postdomes-tication, including significant differences observed within breeding germplasm developed between the early 20th cen-tury and modern day (Meghjiet al.1984; Duvick 2005).
Until 1935, most of the maize grown in the North American Corn Belt consisted of open-pollinated populations, in which plants are allowed to reproduce freely with each other. Within 4 years, however,.90% of maize grown in Iowa had transi-tioned to higher-yielding hybrids created by controlled crosses, and the rest of the Corn Belt soon followed (Reif et al.2005). The transition to single-cross hybrids was largely driven by key founder lines (B14, B37, and B73) derived from a pivotal maize population called Iowa Stiff Stalk Synthetic (BSSS), which was created in the 1930s by intermating 16 in-bred lines (Lamkeyet al.1991; Reifet al.2005). These foun-der lines and their combinations, referred to as Stiff Stalk lines, became preferentially used as females in hybrid breed-ing schemes, while other inbred lines that combined well with them were used as males (Reifet al.2005). These early choices laid the framework for what would eventually be-come the heterotic groups used in maize breeding today. De-scendants of the BSSS population have been used universally across proprietary breeding programs, resulting in a number of commercial Stiff Stalk lines protected by Plant Variety Pro-tection certificates (PVP lines) (Mikel and Dudley 2006).
The shift in breeding methods to single-cross hybrids placed an emphasis on developing inbred lines with charac-teristics that enhance their potential to serve as parents. These parents are subsequently crossed to each other to produce vigorous hybrid offspring. In open-pollinated populations, a competitive advantage was conferred by greater pollen pro-duction and dispersal (Friedman and Barrett 2009). Inbred line breeding greatly reduced that competitive advantage as breeders began making more controlled crosses; there is also evidence that inbreeding tends to shift resource allocation to
the female inflorescence (Burd and Allen 1988). Thus, we hypothesized that selection in the Stiff Stalks by breeders between the original BSSS population and modern PVP lines acted to reduce overall tassel size.
Among the germplasm used in this study are inbred lines derived from the original BSSS population, as well as a number of commercially developed inbred lines for which the Plant Variety Protection certificates have recently expired (ex-PVPs). These ex-PVP lines represent the most modern germplasm from private seed companies that is available to the public, and they can be traced back to founder lines from the BSSS population. These two sets of materials afford us an opportunity to evaluate changes in maize tassel architecture caused by the accelerated evolutionary process of modern breeding. We used single nucleotide polymorphisms (SNPs) identified as significant in association mapping asa priori se-lection candidates, and compared sese-lection statistics at those SNPs to their genome-wide distribution. If selection by breeders between the BSSS and modern ex-PVPs acted to reduce tassel size, we expect that loci associated with tassel morphology phenotypes would show enrichment for selection signatures relative to the rest of the genome. Indeed, we observe an en-richment of selection statistic scores in regions containing SNPs associated with tassel morphological traits, a finding that is consistent across three different selection statistics.
Materials and Methods
Populations
are light and more rigid. Together, the four parental lines comprise a diversity of tassel size and shape. Each biparental population consisted of 200 individuals derived by double-haploid generation from the F2of the original parents.
Phenotypic measurements
The WiDiv-942 was grown in the summers of 2013 and 2014 at the University of Wisconsin’s Arlington Agricultural Research Station and in the summer of 2015 at the West Madison Agricultural Research Station. The PHW65 NAM was grown in 2014 at the Arlington Agricultural Research Station and in 2014 and 2015 at the West Madison Agricul-tural Research Station. All experiments were planted as ran-domized complete block designs with two replications at each location in 4.57 m long single row plots with 0.76 m between rows at a density of 72,000 plants per hectare.
Both populations were measured for branch number (BN), tassel length (TL), and spike length (SL) on three represen-tative plants per plot during or after flowering. BN was quantified as the number of primary tassel branches, TL was measured as the distance in cm from the lowest tassel branch to the tip of the spike, and SL was measured as the distance in centimeter from the uppermost tassel branch to the tip of the spike. All traits were measured in all environments with the exception of SL, which was not measured in the PHW65 NAM at West Madison in 2014. Three derived tassel traits can be calculated from these measurements: branch zone length (BZ) as TL minus SL, branch density (BD) as BN divided by BZ, and spike proportion (SP) as SL divided by TL. In addition to manual measurements, tassels measured in 2015 were also imaged and measured automatically using TIPS (Gageet al.2017), which estimates TL and BN, as well as tortuosity (TR), compactness (CP), fractal dimension (FD), skeleton length (SK), perimeter length (PR), and tassel area (TA) from two-dimensional profile images of tassels. TR is a measure of tassel curvature expressed as a proportion, the length of a straight line from base to tip divided by the length of a splinefit along the tassel itself from base to tip; TA is the number of pixels in the tassel; CP is measured as TA divided by the area of the tassel’s convex hull; FD is a measure of overall tassel complexity; SK is a measure of overall linear length of the tassel, including the main spike and all branches; and PR measures the length of the tassel’s outline. Tassel weight (TW) was also measured as the mean dry weight of three tassels per plot.
Rather than directly use TA and the estimates of TL and BN produced by TIPS, we used partial least squares regression models to generate more accurate, image-based predictions of TL, BN, SL, and TW. Models were fit using theplspackage (Mevik and Wehrens 2007) in R (R Core Team 2016). Indi-vidual tassel measurements were used for modelfitting and prediction was done using all eight model components (TIPS produces eight tassel measurements). The TIPS output for the PHW65 NAM population were used as explanatory vari-ables and the model was trained on manually measured val-ues of TL, SL, BN, and TW in the PHW65 NAM. The resulting
partial least squares regression models were used to predict image-based values of TL, SL, BN, and TW from the TIPS output for images of the WiDiv-942 population. The opposite was done as well: TIPS outputs for the WiDiv-942 population were used as explanatory variables in conjunction with man-ual measurements of TL, SL, BN, and TW to train the models, which were then used to predict image-based values of TL, SL, BN, and TW for the PHW65 NAM individuals. Image-based predictions of TL, SL, BN, and TW are referred to as TLp, SLp, BNp, and TWp.
The WiDiv-942 inbred line best linear unbiased predictions (BLUPs) for all manually measured traits, except TW, were calculated as the random genotypic effect predictions from the linear modely¼mþgþeþg3eþbðeÞ þe, whereyis the phenotypic response,gis the genotypic effect of an inbred line,eis the environmental effect of a year–location com-bination, g3e is the genotype-by-environment interac-tion, bðeÞ is the effect of replicate within environment, andeis the independently and identically distributed er-ror term. The PHW65 NAM BLUPs for manually mea-sured traits, except TW, were calculated from the model y¼mþgþeþpþg3eþp3eþbðeÞ þe, wherepis an ef-fect attributed to each biparental population,p3eis a pop-ulation-by-environment effect, and all other terms are the same as in the WiDiv-942 model. BLUPs for image-based traits and TW for both populations were calculated from models identical to those above, but with all terms containing an environmental effect removed and a standalone replica-tion term included. All effects were considered random, and models werefit with the R packagelme4(Bateset al.2016). BN, BD, PR, SK, and TW were square root transformed to better meet the model assumption of normally distributed residuals, and TR was removed from further analysis due to violation of model assumptions. All BLUPs can be found in Supplemental Material, File S3.
Heritability was calculated on an entry-mean basis for all manually measured traits except for TW as h2¼s2
g
s2 gþ
s2 g3e
e þ
s2
e be
; where s2 g, s
2
g3e, and s 2
e were
estimated from the linear models described above and b andeare the number of replications and the number of en-vironments, respectively. Repeatability was calculated similarly for all image-based traits and TW asr¼ s2
g
s2 gþs
2
e b
, be-cause image-based traits and TW were measured only in a single environment.
Genotypic and phenotypic correlations between all traits were calculated for each population. Because of differing numbers of phenotyped lines and differing numbers of envi-ronments in which the traits were evaluated, the correlations were only calculated using data from the West Madison 2015 location, and only with lines that were phenotyped for all 15 traits in that environment (693 individuals from the WiDiv-942 and 569 from the PHW65 NAM).
Genotypic data
combined with RNA sequencing data from the original Hirschet al.(2014) publication and aligned to the B73 ver-sion 4 reference genome sequence (Jiaoet al.2017) for SNP calling at 899,784 SNPs. The WiDiv-942 SNP matrix con-tained 30% missing data, which was imputed using fast-PHASE v1.4.0 (Scheet and Stephens 2006) with the –H flag set to 23 to prevent haplotype phasing and default parameters otherwise.
Inbred lines in the PHW65 NAM population were geno-typed using genotyping-by-sequencing (GBS) as described in Elshireet al.(2011), using the GBSv2 pipeline implemented in TASSEL5 (Bradburyet al.2007), resulting in 9291 SNPs, which were imputed with FSFHap (Swartset al.2014) using the“cluster”algorithm with a minimum MAF of 0.3 within each biparental population, a window size/step size of 30/15 for chromosomes 1, 4, and 6, and 50/25 otherwise.
The four parents of the PHW65 NAM population were resequenced and genotyped at 23.3 million SNPs (Brohammeret al.2018). The 31% missing SNP data in the parents was imputed using fastPHASE v1.4.0 (Scheet and Stephens 2006) with the–Hflag set to23 to prevent haplo-type phasing, the–Kflag set to 7, and the–Tflag set to 10. The –Kflag sets the number of haplotype clusters at 7 and was chosen by evaluating imputation accuracy for K values between 1 and 31 and choosing the value above which min-imal gains in accuracy were observed, similar to Tian et al. (2011). The–Tflag sets the number of random starts of the algorithm. As opposed to the imputation of the WiDiv-942, setting the–K and–Tflags helped reduce the computational time of imputation for the larger number of resequencing SNPs. SNP calls from the four resequenced parents at 10.6 million polymorphic SNPs were projected onto their biparen-tal progeny in the PHW65 NAM using GBS markers as a scaf-fold, as described in Tianet al.(2011).
Classification of public and ex-PVP Stiff Stalk lines
We identified lines that represent early Stiff Stalk germplasm, recent ex-PVP Stiff Stalk germplasm, and publicly developed Stiff Stalk germplasm that represents a temporally interme-diate group between the two.
The WiDiv-942 contains 47 inbreds derived through self-pollination from the original BSSS population (referred to hereafter as BSSSC0), which represent maize Stiff Stalk germplasm from the early 20th century.
From all ex-PVP lines in the WiDiv-942, inbreds were chosen that showed genotypic evidence of being directly descended from the BSSS population (File S1). Although pedigree information was available for some ex-PVPs, the number of individuals that could be traced by pedigree back to BSSS-derived inbreds was low. Additionally, using geno-typic information to identify BSSS-derived ex-PVP lines allows exclusion of individuals showing evidence of contamination from other breeding material. Population substructure within all the ex-PVP lines was estimated using ADMIXTURE (Alexanderet al.2009). The genotypic matrix consisting of 899,784 SNPs for 328 ex-PVP inbreds wasfirst pruned for
linkage disequilibrium (LD) using PLINK (Changet al.2015). Using a sliding window of 50 SNPs and a step size of 10 SNPs, SNPs with a R2 value .0.1 within the window were dis-carded, leaving 109,605 SNPs. The pruned marker set was used in ADMIXTURE without seeding founding individuals. Ten-fold cross-validation of the errors was minimized at K groups equal to eight as an appropriate model for this marker set. These eight groups represent the resulting subpopu-lations; B14, B37, B73, Oh43, Lancaster, Iodent, Iodent-Lancaster, and Flint. To identify lines that both display evidence of descent from the BSSS as well as exclude lines with evidence of introgression from other germplasm pools, individuals were required to have a sum of.95% identity to the B14, B37, and B73 groups, as well as ,2% identity to each of the other groups. Of the lines that met this require-ment, 21 had been phenotyped and were kept for subsequent analysis. Those BSSS-descended ex-PVP lines are referred to hereafter simply as ex-PVPs. Hierarchical clustering of the ex-PVPs and BSSSC0 lines revealed six of the BSSSC0 lines did not cluster with the others. Those six were removed from further analysis, leaving 41 BSSSC0 lines.
The third group, referred to as “Public,”is comprised of 16 inbred lines from the WiDiv-942 that are known by ped-igree to have been developed from the original Stiff Stalk synthetic population.
Best linear unbiased estimators (BLUEs) for all lines in the WiDiv-942 were calculated by the same models used to calculate BLUPs, but with genotypefit as afixed rather than random effect. BLUEs for the BSSSC0, Public, and ex-PVP lines were compared for each of the 15 tassel morphological traits, and significant differences were evaluated by Tukey’s honest significant difference. (Tukey 1949).
Mapping
Genome-wide association studies (GWAS) for the WiDiv-942 were performed in R (R Core Team 2016) using the multiple locus linear mixed model implemented infarmCPU(Liuet al. 2016). Thefirstfive principal components were included to account for spurious associations due to population structure, and the threshold for initial inclusion of SNPs into the model was set to allow an empirical false entry rate of 1% based on 1000 permutations. SNPs with a minor allele frequency ,0.02 were excluded from analysis, leaving 529,018 SNPs for GWAS. SNPs with a Bonferroni-adjusted P-value,0.05 were considered significant. Because of missing phenotypic data, not all 942 individuals were included in mapping. For manual traits other than TW, 791 unique individuals were included in GWAS. For image-based traits and TW, 660 indi-viduals were included in the GWAS.
9.63 1025 to 1.531024) and allowed terms to exit the model based on a limit set at twice the entry threshold. Re-siduals from thefinal stepwise model were calculated sepa-rately for each chromosome, with any SNPs on that chromosome excluded from the model. The residuals for each chromosome were used as the dependent variable in a resampling-based mapping method similar to that described in Valdaret al.(2006) and Tianet al.(2011), implemented with the ResamplingGWASPlugin in TASSEL5 (Bradbury et al. 2007). Briefly, 80% of the PHW65 NAM individuals were randomly selected and forward regression was used tofit SNPs that were associated with the residuals at a sig-nificance level ,1 3 1024. This process was repeated 100 times for each combination of trait and chromosome, and each SNPfitted by the resampling GWAS method was assigned a resampling model inclusion probability (RMIP) between 0 and 1, reflecting the proportion of models in which that SNP was included. A permutation-based thresh-old for RMIP was calculated in a manner similar to that described in Tianet al.(2011) andfive permutations were performed for each chromosome, for each trait. An RMIP threshold of $0.05 kept the number of false positives to #5 per trait, or on average, #1 false positive genome-wide per permutation.
Selection statistics
We used the 41 BSSSC0 and 21 ex-PVP lines to perform genome-wide scans for selection. The BSSSC0 lines represent maize Stiff Stalk germplasm from the early 20th century, while the ex-PVP lines represent the product of60 years of com-mercial maize breeding. We calculated cross population ex-tended haplotype homozogysity (XP-EHH; Sabetiet al.2007) between the two groups using the WiDiv-942 SNPs with hap-bin (Macleanet al.2015), with the–minmaf argument set to 0 and the–scale argument set to 20,000 bp. Only the 877,627 SNPs with no missing data in either subpopulation were used. Scores were binned by taking most extreme XP-EHH score from each nonoverlapping 10 kb window.
Cross population composite likelihood ratio (XP-CLR; Chen et al.2010) was calculated with a modified version of XPCLR v1.0 (Huffordet al. 2012;https://figshare.com/articles/new_
fileset/757736) on the same set of SNPs as XP-EHH, with a grid size of 100 bp, a genetic window size of 0.1 cM, a maximum of 50 SNPs per window, and correlation level of 0.7. The genetic positions of the WiDiv SNPs were estimated by linear interpo-lation of the NAM genetic map (McMullenet al.2009), down-loaded fromhttps://maizegdb.org/data_center/map. As with XP-EHH, the resulting XP-CLR values were also binned by using the maximum score in each nonoverlapping 10 kb window to represent that window.
Fixation index (FST) between the two groups was calcu-lated on the same set of SNPs as XP-EHH and XP-CLR, using http://beissingerlab.github.io/docs/vectorFst.R (Beissinger et al.2014), with a correction for small number of populations and uneven sample sizes according to Weir and Cockerham (1984). As with XP-EHH and XP-CLR scores, FSTvalues were
binned into 10 kb windows represented by the maximum score in that window.
XP-EHH, XP-CLR, and FST scores were assigned to each SNP significantly associated with each of the 15 traits by using the score for the 10 kb window to which each SNP belonged. The distribution of those scores were tested against null distributions generated by two different methods: circular permutation and window-matching permutation.
Because the distributions of selection statistics for tassel-associated SNPs could be affected by having certain SNPs physically near each other or represented more than once (associated with more than one trait), we used 10,000 iter-ations of a circular permutation method (Wallaceet al.2014) to create a null distribution for each selection statistic. Circu-lar permutation is done by keeping the order and relative position of all the hits intact, while randomizing their start-ing position along the chromosome. The relationships be-tween the tassel-associated SNPs are maintained, but their relationship to selection statistics along the chromosome is randomized.
Because the distribution of selection statistics in tassel-associated windows could also be an artifact of other window characteristics, we created a second null distribution for each selection statistic by randomly selecting windows from the rest of the genome that had similar characteristics to the tassel-associated windows. For each tassel-associated window, 50 windows with a similar number of genes (61 gene), re-combination rate (620%), frequency of alleles in the BSSSC0 lines (615%), and frequency of alleles in the ex-PVP lines (615%) were randomly sampled without replacement. For tassel-associated windows with,50 matching windows ge-nome-wide, the allele frequency criteria were omitted.
The distributions of selection statistics for the tassel-asso-ciated SNPs were compared to both null distributions both visually and using the Kolmogorov–Smirnov test with a two-sidedP-value (Koлмoгopoв1933; Smirnov 1948).
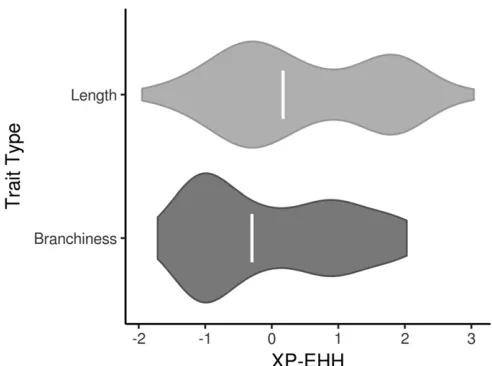
We also investigated whether the distribution of selection statistics for tassel-associated SNPs was being driven by traits characteristic of the ex-PVPs or the BSSSC0 inbreds. TL, TLp, SL, SLp, BZ, and SP are all related to the length of the tassel and, with the exception of BZ, have higher values in the ex-PVPs. BN, BNp, BD, CP, FD, SK, PR, TW, and TWp are more related to the quantity and density of branches, and have higher values in the BSSSC0 lines. The distributions of XP-EHH scores for these “length” and “branchiness” traits were examined separately to see if one or the other type of trait had undue influence on the overall distribution.
Data availability
N. de Leon, and S. Kaeppler, unpublished data). Code is avail-able on GitHub atgithub.com/joegage/tassel_selection. Sup-plemental material available at Figshare: https://doi.org/ 10.25386/genetics.7097813.
Results
Tassels exhibit morphological diversity for traits measured manually and by image-based methods
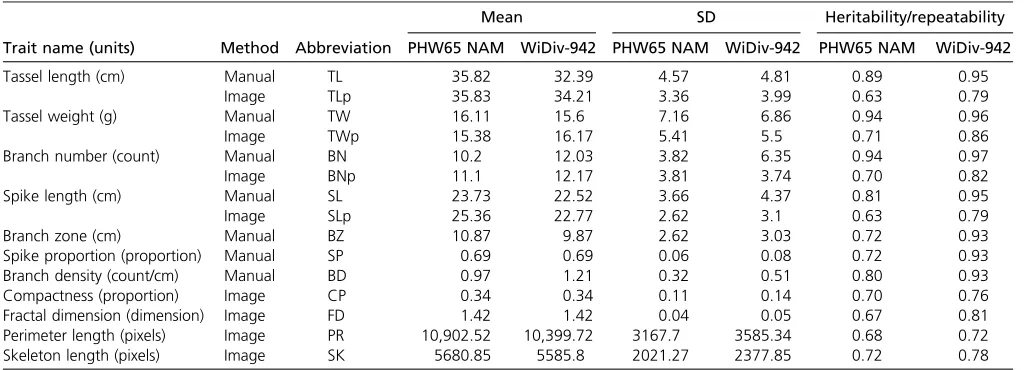
Manual measurements of TL, SL, BN, BD, BZ, SP, and TW for.22,000 individual tassels were recorded for two popu-lations, an association panel (WiDiv-942; M. Mazaheri, M. Heckwolf, B. Vaillancourt, J. Gage, B. Burdo, S. Heckwolf, K. Barry, A. Lipzen, C. Bastos Riviero, T. Kono, H. Kaeppler, E. Spalding, C. Hirsch, C. R. Buell, N. de Leon, and S. Kaeppler, unpublished data) and an NAM population (PHW65 NAM) with PHW65 as the common parent and PHN11, MoG, and Mo44 as founder parents. These materials were grown in three environments between 2013 and 2015 in south central Wisconsin. The WiDiv-942 association panel used in this study is comprised of 942 diverse inbred lines, while the PHW65 NAM consists of three nested biparental populations of 200 individuals each. The WiDiv-942 was cho-sen to capture broad phenotypic and genetic diversity, whereas the PHW65 NAM leverages controlled biparental crosses between individuals with contrasting tassel morphol-ogies. All tassels manually measured in 2015 were also pho-tographed and measured using the image-based tassel phenotyping system TIPS (Gage et al. 2017), resulting in image-based measurements of TL, SL, BN, and TW (referred to as TLp, SLp, BNp, and TWp, respectively), along with four other traits: CP, FD (a measure of overall complexity), SK (a measure of total linear length), and PR (the length of a tas-sel’s two-dimensional outline). Accuracy (Pearson’s correla-tion) of image-based measures for the four traits measured by both manual and image-based methods ranged from 0.71 (BN/BNp) to 0.92 (TW/TWp) in the PHW65 NAM popula-tion and from 0.81 (BN/BNp) to 0.89 (TL/TLp and TW/TWp) in the WiDiv-942 population.
All 15 tassel morphological traits measured manually or by image-based phenotyping showed variability for raw mea-surements within both the WiDiv-942 and PHW65 NAM populations (Figure S1 and Table 1). Excluding FD, which ranged from 1.1 to 1.6, the other 14 traits exhibited between twofold (SLp) and 36-fold (BNp) variability within the PHW65 NAM population and between twofold (SP) and 22-fold (SK) variability within the WiDiv-942 population.
The 15 traits can be broadly classified into two groups: those that contribute to tassel size by contributing to length (TL, TLp, SL, SLp, SP, and BZ) and those that contribute to tassel size by contributing to branchiness (BN, BNp, BD, CP, FD, SK, PR, TW, and TWp). Although TW and TWp are measures of mass rather than branching, both traits are affected more by changes in branchiness than changes in TL and therefore are included in the former group.
For most traits, the PHW65 NAM population has a higher or equivalent mean to the WiDiv-942 population, with the exception of TWp (0.79 g lighter), BN (1.83 fewer branches), BNp (1.07 fewer branches), and BD (0.24 fewer branches/ cm). As expected, given the allelic representation contained in each of the populations, phenotypic variability within the PHW65 NAM is lower than in the WiDiv-942, with the excep-tion of TW (SD 0.3 g greater) and BNp (SD 0.07 branches greater).
Heritabilities for manually measured traits ranged from 0.93 (BZ, BD, and SP) to 0.97 (BN) in the WiDiv-942 pop-ulation and from 0.72 (BZ and SP) to 0.94 (BN and TW) in the PHW65 NAM population. Because images and TW were taken only at one location, repeatability was calculated for image-based traits and TW in place of heritability. Repeatabilities ranged from 0.72 (PR) to 0.86 (TWp) in the WiDiv-942 population and 0.63 (SLp and TLp) to 0.72 (SK) in the PHW65 NAM population (Table 1). The high heritabilities for measurements taken in multiple environments indicate large genotypic variance relative to genotype-by-environment variance and error. Similarly, high repeatabilities for traits that were measured in a single environment indicate large genotypic variance relative to error. It is unsurprising that the image-based repeatabilities were lower than the manually measured heritabilities, as manual measurements were taken in three separate environments while image-based traits were measured in one environment.
Genotypic and phenotypic correlations were calculated within the single environment in which all traits were mea-sured (Figures S2 and S3). With the exception of CP, branchi-ness traits were generally positively correlated with each other in both populations. Similarly, length-related traits were all positively correlated with each other in both populations. Phenotypic and genotypic correlations were similar to each other in both populations, partly due to relatively high her-itability of all traits and partly due to having been calculated within a single location.
Tassel morphology has changed over the course of 20th century maize breeding
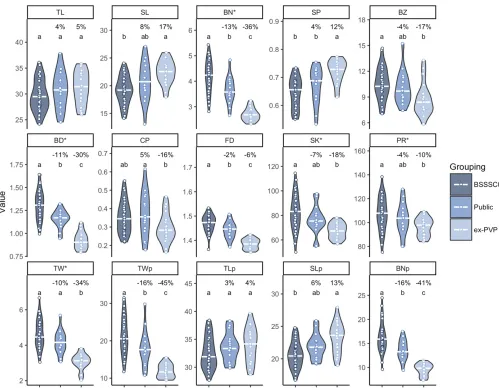
The WiDiv-942 association panel contains 41 inbred lines developed by selfing without selection from cycle 0 of the BSSS population (BSSSC0), 16 public inbred lines with ped-igrees that trace entirely back to lines derived from the BSSS, and 21 ex-PVPs with genotypic evidence for descent from the BSSS (File S1). These three groups of lines allow comparison of tassel morphology over the course of modern maize breed-ing. The BSSSC0 lines represent the earliest material, the ex-PVPs represent the most recent and heavily selected ma-terial, while the public lines form an intermediate group.
inbred lines displayed intermediate phenotypes between the medians of the BSSSC0 and ex-PVP lines. Public inbred lines were significantly different from BSSSC0 lines for BN, BD, FD, TWp, and BNp, while ex-PVP lines were significantly different from BSSSC0 lines for all traits except TL, TLp, and CP. Public lines and ex-PVP lines differed significantly for BN, SP, BD, CP, FD, TW, TWp, and BNp (all comparisons: Tukey’s honest significant difference,a= 0.05). Generally, tassel length (TL and TLp), spike length (SL and SLp), and SP increased over time, while all other traits decreased over time. The observed phenotypic trends suggest selection on tassel morphology between the open-pollinated BSSS and public inbreds, as well as continued selection between the public lines and the ex-PVP lines.
GWAS identifies SNPs associated with tassel morphological traits
All 15 traits were mapped in the WiDiv-942 association panel using the multiple locus linear mixed model implemented in FarmCPU (Liuet al. 2016), with 529,018 SNPs discovered from RNA sequencing with minor allele frequency .0.02. Traits were mapped in the PHW65 NAM population using a resampling-based GWAS approach (Tianet al.2011), with 10.6 million resequencing SNPs projected from parental lines onto the progeny, which were genotyped at 9291 GBS SNPs. In the WiDiv-942 population, 87 SNPs were identified as significantly associated with 12 of the 15 traits. In the PHW65 NAM population, 155 SNPs were identified as signif-icantly associated across all traits (File S2).
The manually measured traits returned a greater number of significant associations in total than the image-based traits, as expected based on the relative measures of heritability and repeatability. In 10 instances, manual and image-based mea-sures of the same phenotype were associated with the same SNP: one SNP for TL and TLp, four for BN and BNp, one for SL
and SLp, andfive for TW and TWp. One pair of SNPs each for BN and weight were identified in the WiDiv-942 population, and the rest of the colocalized SNPs were discovered in the PHW65 NAM population. The single SNP associated with TL was the same as the single SNP associated with SL; a SNP associated with weight and a SNP associated with BN were within 2.5 kb of each other. In two other instances, the manually measured and image-based traits were associated with SNPs within 5 kb of each other, and in an additional two instances they were associated with SNPs that were located within 150 kb of each other (Figure S4). Generally, there is more concordance between SNPs associated with manual and image-based measurements for traits with higher heritabilities/ repeatabilities (BN and TW) than lower heritabilities/ repeatabilities (SL and TL). This is to be expected, as genetic signal is stronger when heritability is high, but the pattern seen in this study may be due only to chance as BN and TW are only marginally more heritable than SL and TL.
Selection statistics show evidence for selection at SNPs associated with tassel morphology
To test for genomic signatures of selection on tassel morphol-ogy, SNPs associated with tassel characteristics in the WiDiv-942 and PHW65 NAM lines were used asa prioricandidates for regions having undergone selection between the BSSSC0 lines and the ex-PVP lines. Scans for selection were con-ducted using LD-focused methods XP-EHH (Sabeti et al. 2007) and XP-CLR (Chen et al. 2010), and the allelic fre-quency change based method FST (Weir and Cockerham 1984). Genome-wide results from selection scans were binned into 10 kb windows, and windows containing SNPs associated with tassel morphology were compared to the ge-nome-wide distribution of each statistic. Of the 242 total SNP-trait associations identified, 170 were in windows that had XP-EHH scores, 231 had XP-CLR scores, and 169 had FST
Table 1 Summary of traits and heritabilities
Trait name (units) Method Abbreviation
Mean SD Heritability/repeatability
PHW65 NAM WiDiv-942 PHW65 NAM WiDiv-942 PHW65 NAM WiDiv-942
Tassel length (cm) Manual TL 35.82 32.39 4.57 4.81 0.89 0.95
Image TLp 35.83 34.21 3.36 3.99 0.63 0.79
Tassel weight (g) Manual TW 16.11 15.6 7.16 6.86 0.94 0.96
Image TWp 15.38 16.17 5.41 5.5 0.71 0.86
Branch number (count) Manual BN 10.2 12.03 3.82 6.35 0.94 0.97
Image BNp 11.1 12.17 3.81 3.74 0.70 0.82
Spike length (cm) Manual SL 23.73 22.52 3.66 4.37 0.81 0.95
Image SLp 25.36 22.77 2.62 3.1 0.63 0.79
Branch zone (cm) Manual BZ 10.87 9.87 2.62 3.03 0.72 0.93
Spike proportion (proportion) Manual SP 0.69 0.69 0.06 0.08 0.72 0.93
Branch density (count/cm) Manual BD 0.97 1.21 0.32 0.51 0.80 0.93
Compactness (proportion) Image CP 0.34 0.34 0.11 0.14 0.70 0.76
Fractal dimension (dimension) Image FD 1.42 1.42 0.04 0.05 0.67 0.81
Perimeter length (pixels) Image PR 10,902.52 10,399.72 3167.7 3585.34 0.68 0.72 Skeleton length (pixels) Image SK 5680.85 5585.8 2021.27 2377.85 0.72 0.78
scores. Not all SNP-trait associations had scores for each se-lection statistic because the associations were discovered in the full PHW65 NAM and WiDiv-942 populations, but may lie in regions that are monomorphic between the BSSSC0 lines and ex-PVP individuals or contain missing SNP calls. The distributions of tassel-associated XP-EHH, XP-CLR, and FST scores were significantly different from genome-wide null distributions generated from circular permutations (Kolmo-gorov–Smirnov test,P= 1.831023, 7.831023, and 1.93 1023, respectively), as well as genome-wide null distribu-tions generated by randomly sampling windows with similar characteristics (P= 3.931022, 1.231023, and 2.9231023, respectively), suggesting enrichment for selection signals in regions associated with tassel morphology.
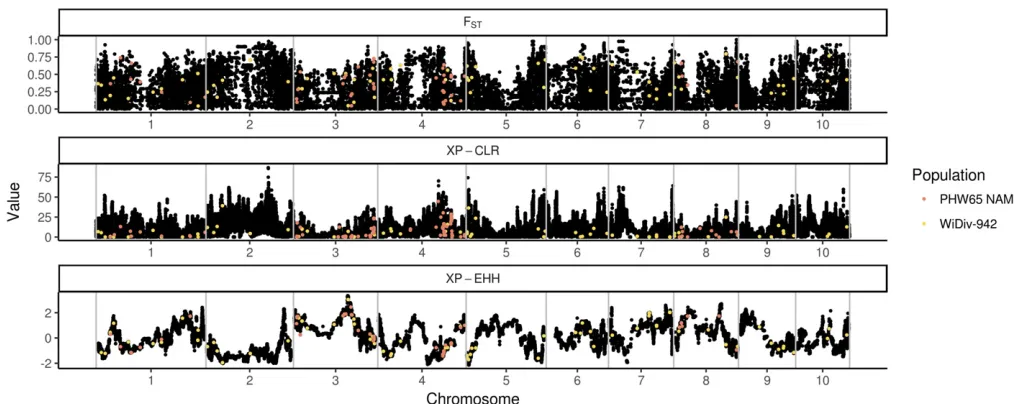
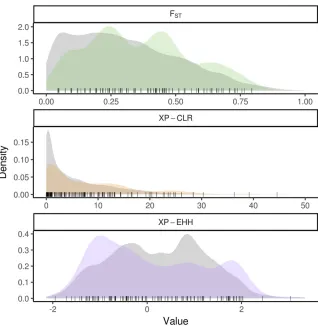
XP-EHH scores for tassel-associated windows (Figure 2) were enriched for values approximately.1 and, 21, with
the majority of the enrichment coming from negative scores (Figure 3 and Figure S5). Positive XP-EHH scores indicate longer, more prevalent haplotypes in the collection of lines from the BSSSC0 population, while negative XP-EHH scores indicate longer, more prevalent haplotypes in the ex-PVP set. The greater surplus of negative scores among the tassel-associated SNPs indicates extended haplotypes at those loci in the newer ex-PVP population, relative to the ancestral BSSS. The extended haplotypes in the ex-PVP population are con-sistent with what would be expected if beneficial alleles were recently selected, resulting in a concurrent increase in linked haplotypes due to genetic hitchhiking (Voight et al. 2006). Further, the excess of negative XP-EHH scores was driven largely by associations with phenotypes related to branchi-ness rather than length (Figure 4; one-sided Wilcoxon rank sum test, P = 2.9 3 1023). Branchiness traits have more
influence on tassel size and biomass than tassel and spike length. With the exception of BZ, all the length traits in-creased from the BSSSC0 to the ex-PVPs, whereas all the branchiness traits decreased. As such, most of the SNPs show-ing evidence of selection in the ex-PVPs are associated with traits that control overall tassel size and biomass and have decreased significantly since the 1930s.
Similar to XP-EHH, XP-CLR is a haplotype-based method for identifying selective sweeps. Rather than identify alleles that have recently arisen to substantial frequency, as XP-EHH does, XP-CLR identifies alleles that have changed in frequency more quickly than expected under neutrality (Chen et al. 2010). Both methods use LD around the tested allele as a measure of the allele’s age. Tassel-associated XP-CLR scores (Figure 2) show enrichment for values in the tail of the dis-tribution (Figure 3 and Figure S5), indicating an excess of regions that may have been subject to selective sweeps.
FST, a measure of population differentiation based on allele frequencies, differs from the previous two selection statistics in that it is not haplotype based. FSTvalues for tassel-associated windows (Figure 2) are generally higher than expected under the null distribution, with a depletion of val-ues less than0.3 and enrichment for values greater than
0.3 (Figure 3 and Figure S5).
None of these three selection statistics show strong, sys-tematic relationships with each other on a genome-wide basis (Figure S6) or among the tassel-associated windows (Figure S7). For the 101 significant associations that were genotyped in the WiDiv-942 (and hence, in the ex-PVP and BSSSC0 lines), we hypothesized that alleles with higher frequency in the ex-PVPs would generally have allelic effects conferring more ex-PVP-like phenotypes, that is, positive values for TL,
SL, TLp, SLp, and SP, and negative values for all other traits. However, we found no difference between the effect sizes of alleles with higher frequency in the ex-PVPs and alleles with higher frequency in the BSSSC0s (Welch’s two-sampledt-test, P= 0.87). The lack of any difference could be due to the low number of SNPs we were able to directly test, or perhaps due to noise introduced by identifying SNPs that are not causative themselves but in LD with variants that directly affect tassel morphology.
Discussion
Tassel morphology of modern commercial inbred lines, which are used as parents of single cross hybrids grown in the United States Corn Belt, is dramatically different from tassel mor-phology seen in the open-pollinated varieties of the pre-hybrid era. We demonstrate that tassel morphology has been con-tinually modified, with length-related traits increasing and branchiness traits decreasing. This trend is consistent between BSSSC0 inbreds and public BSSS-derived inbreds, as well as between public inbreds and BSSS-derived ex-PVPs. Through mapping of both image-based and manually measured phe-notypes, we identify SNPs associated with tassel morpholog-ical traits, which collectively show enrichment for three selection statistics.
Mickelsonet al.2002; Upadyayulaet al.2006; Brownet al. 2011; Wuet al.2016). The novel, image-based traits used in this study display considerable variability, have high enough repeatabilities to be useful in mapping studies, and resulted in significant phenotype-genotype associations that contrib-uted to our analysis of selection signals. The ability to add information to manual phenotyping is especially influential when manual phenotyping is laborious or inefficient. For phenotyping tassels, manual measurements are relatively easy and fast to obtain. However, image-based phenotyping measures the same traits but also contributes, with no addi-tional time investment, supplementary measurements such as CP and FD, which would be difficult, subjective, or impos-sible to measure otherwise. Although tassels for this study were removed from the plants before imaging (a laborious task), such methods are a step toward higher-throughput methodologies, such as image acquisition by unmanned aerial vehicles.
By comparing tassel morphology in the BSSSC0 and ex-PVP sets considered in this study, we are able to compare two groups that bookend modern breeding of one of the most important heterotic groups in North American maize germ-plasm. The BSSSC0 and ex-PVP groups are characterized by unique and differing tassel morphology: relative to the BSSSC0, ex-PVP tassels are longer, less branched, and weigh less. These changes in morphology reflect an overall trend toward a tassel ideotype that has few lateral branches and
produces pollen primarily by means of an extended central spike. The Stiff Stalks, traditionally used as females in breed-ing programs, need only produce enough pollen for self-fertilization during inbred line development and seed increases; this is reflected by the reduction of their size and weight since the inception of inbred-driven breeding schemes in the 1930s. Reduction in tassel size may have caused a decrease in the duration of pollen shed, contributing to the shortening of anthesis-silking interval between the 1930s and 1970s (Meghjiet al.1984). Previous experiments that recur-rently selected the BSSS population for grain yield also ob-served a decrease in BN (Edwards 2011), further reinforcing the relationship between agronomic performance and re-duced tassel size. Although the changes in tassel morphology caused by recent selection are well characterized, the genetic effects of selection by breeders are less studied.
overlap between inflorescence morphology QTL and regions showing evidence of selection in the last 50 years of breeding, but the genetic relationship between recent selection and inflorescence morphology in maize is relatively unexplored.
XP-EHH, XP-CLR, and FSTscores for SNPs associated with tassel morphology traits showed deviations from permuted genome-wide null distributions, with enrichment for values that are indicative of selection. Inde novoscans for selected sites, often the threshold for determining selection candi-dates by XP-CLR or FSTis set as a quantile of the empirical distribution that limits candidates to loci in the top 0.1% or 0.01% of results (e.g., Beissinger et al.2014; Jeong et al. 2015). XP-EHH has the agreeable property of being approx-imately normally distributed under a model of no selection, which allows identification of selection candidates based on P-values from the normal distribution (Sabeti et al.2007). While not all tassel-associated SNPs have high enough XP-EHH, XP-CLR, and FSTscores to be identified as selection candidates in ade novosearch for selected sites, the strong enrichment for elevated scores suggests identification of re-gions that might be experiencing weak or ongoing selection. Genome-wide scans for selection are complicated by popula-tion dynamics and demographics that differ from expecta-tions, and often result in identification of large genomic regions containing many features that require further inves-tigation. Instead of approaching such an analysis with no expectations, it has been suggested (Haasl and Payseur 2016) that creating ana priori list of candidate genes can help narrow down significant results. In this study, we used associations from two comprehensive genetic mapping re-sources asa prioricandidates to identify signatures of selec-tion associated with a specific suite of phenotypic traits.
XP-EHH identifies putatively selected sites by identifying regions where one population contains longer haplotypes around a target SNP, which have arisen due to hitchhiking with a selected locus. We observe enrichment for both positive and negative XP-EHH scores; positive scores indicate greater haplotype homozygosity in the BSSSC0 lines, whereas nega-tive scores indicate greater haplotype homozygosity in the ex-PVP lines. There is a substantially larger enrichment for negative XP-EHH scores than positive, consistent with the hypothesis that favorable alleles from the BSSSC0 lines were selected in the ex-PVPs, resulting in increased LD in the surrounding areas. The majority of enrichment for negative XP-EHH scores appears to be driven by branchiness traits, which may have been easier to select on (intentionally or not) by breeders aiming to reduce overall tassel size. The enrich-ment for positive XP-EHH scores, although not as extreme as for negative scores, indicates a number of tassel-associated loci with slower LD decay in the BSSSC0 lines than in the ex-PVP set. One possible explanation for this observation is that prior to the creation of the BSSS, during a period char-acterized by open-pollinated populations, heavier tassels with more branches had a reproductive advantage due to higher pollen production. During the last century of maize breeding the selective pressure on high pollen production has been removed by a hybrid breeding scheme in which inbred com-bining ability and hybrid grain yield are prioritized. It is possible that the BSSSC0 lines show extended haplotypes due to selection favoring alleles that confer large tassel size, whereas modern breeding schemes have removed that selec-tive pressure and allowed or encouraged recombination in previously selected regions.
The results presented here provide evidence for selection by 20th century maize breeders on regions associated with maize tassel morphology. Whether these changes are the result of direct or indirect selection on tassel size and shape is unclear. Modern, commercially developed maize inbreds display a suite of characteristics that have systematically changed since the open-pollinated varieties of the 1930s, and it is difficult to disentangle selection for changes in tassel morphology from selection for traits that are regulated by loci pleiotropically involved in tassel morphology. Because the tassel and the ear follow a shared developmental path early in development, genes affecting morphology of one may very well have effects on the other. QTL have been discovered that exhibit pleiotropic behavior, conferring a positive relationship between tassel and ear length (Brownet al.2011). Mutants of the inflorescence genesunbranched2andunbranched3have been shown to simultaneously decrease branch number and increase kernel row number, a trait that directly affects grain yield (Chuck et al.2014), while mutants of zeafloricaula/ leafy 2decrease both branch number and kernel row number (Bomblies and Doebley 2006). There is also evidence for shared genetic control of tassel traits and other plant archi-tecture traits such as leaf length (Brownet al.2011) and leaf angle (Mickelson et al.2002), the latter of which has also changed significantly over the course of modern maize Figure 4 Signals of selection for tassel traits are driven by traits related to
breeding (Duvick 2005). Although more work is needed to clarify the genetic relationships between selection and maize tassel morphology, particularly with respect to disentangling pleiotropic effects, this study is a starting point for discover-ing the effects artificial selection has on genetic control of inflorescences in agricultural crops.
Change in tassel size and shape between the early 20th century and modern day is a well-characterized phenome-non but the causes of that phenomephenome-non and its potential causal effects on other agronomic traits and productivity are not fully known. Our results present evidence for enriched signals of selection in genomic regions associated with tassel morphological traits. Further, this selection took place in
60 years between the creation of the BSSS in the 1930s and the release of ex-PVP lines in the 1980s and 1990s, a tremendous example of the efficiency of modern crop breeding in imposing drastic genetic and phenotypic changes.
Acknowledgments
We thank Dustin Eilert and Marina Borsecnik for their immense contribution in organizing and conducting field trials at the University of Wisconsin, Madison; as well as Scott Stelpflug, Jonathan Renk, Brett Burdo, Katie Csizma-dia, and Mike Ziehr for their help with tassel image acquisition. We also thank Peter Bradbury for help with stepwise regression, and the Ross-Ibarra group for insightful comments on the manuscript. Image analysis was performed using the compute resources and assistance of the University of Wisconsin– Madison Center for High Throughput Com-puting (CHTC) in the Department of Computer Sciences. The CHTC is supported by the University of Wisconsin – Madison, the Advanced Computing Initiative, the Wisconsin Alumni Research Foundation, the Wisconsin Institutes for Discovery, and the National Science Foundation, and is an active member of the Open Science Grid, which is supported by the National Science Foundation and the US Department of Energy’s Office of Science. This work was supported by the National Research Initiative for Agriculture and Food Research Initiative Competitive Grants Program grant no. 2012-67013-19460 from the US Department of Agriculture National Institute of Food and Agriculture, and by US De-partment of Agriculture National Institute of Food and Ag-riculture Hatch projects WIS01923 and WIS02020. This research was funded in part by the DOE Great Lakes Bioen-ergy Research Center (DOE BER Office of Science DE-FC02-07ER64494). Work conducted by the U.S. Department of Energy Joint Genome Institute, a DOE Office of Science User Facility, is supported by the Office of Science of the U.S. Department of Energy under Contract No. DE-AC02-05CH11231.
Author contributions: data analysis: J.L.G. and M.R.W.; materials development and curation: J.W.E., S.K., and N.d.L.; manuscript preparation: J.L.G., M.R.W., J.W.E., S.K., and N.d.L.
Literature Cited
Alexander, D. H., J. Novembre, and K. Lange, 2009 Fast model-based estimation of ancestry in unrelated individuals. Genome Res. 19: 1655–1664.https://doi.org/10.1101/gr.094052.109
Bates, D., M. Maechler, B. Bolker, and S. Walker, 2015 Fitting linear mixed-effects models using lme4. J. Stat. Softw. 67: 1–48.https://doi.org/10.18637/jss.v067.i01.
Beissinger, T. M., C. N. Hirsch, B. Vaillancourt, S. Deshpande, K. Barryet al., 2014 A genome-wide scan for evidence of selec-tion in a maize populaselec-tion under long-term artificial selection for ear number. Genetics 196: 829–840.https://doi.org/10.1534/ genetics.113.160655
Berke, T. G., and T. R. Rocheford, 1999 Quantitative trait loci for tassel traits in maize. Crop Sci. 39: 1439–1443.https://doi.org/ 10.2135/cropsci1999.3951439x
Bomblies, K., and J. F. Doebley, 2006 Pleiotropic effects of the duplicate maize FLORICAULA/LEAFY genes zfl1 and zfl2 on traits under selection during maize domestication. Genetics 172: 519–531.https://doi.org/10.1534/genetics.105.048595
Bradbury, P. J., Z. Zhang, D. E. Kroon, T. M. Casstevens, Y. Ramdoss
et al., 2007 TASSEL: software for association mapping of com-plex traits in diverse samples. Bioinformatics 23: 2633–2635.
https://doi.org/10.1093/bioinformatics/btm308
Brohammer, A. B., T. J. Y. Kono, N. M. Springer, S. E. McGaugh, and C. N. Hirsch, 2018 The limited role of differential fractionation in genome content variation and function in maize (Zea mays L.) inbred lines. Plant J. 93: 131–141.https://doi.org/10.1111/ tpj.13765
Brown, P. J., N. Upadyayula, G. S. Mahone, F. Tian, P. J. Bradbury
et al., 2011 Distinct genetic architectures for male and female inflorescence traits of maize. PLoS Genet. 7: e1002383.https:// doi.org/10.1371/journal.pgen.1002383
Buckler, E. S., J. B. Holland, P. J. Bradbury, C. B. Acharya, P. J. Brownet al., 2009 The genetic architecture of maizeflowering time. Science 325: 714–718. https://doi.org/10.1126/science. 1174276
Burd, M., and T. F. H. Allen, 1988 Sexual allocation strategy in wind-pollinated plants. Evolution (N. Y.) 42: 403–407.https:// doi.org/10.1111/j.1558–5646.1988.tb04145.x
Chang, C. C., C. C. Chow, L. C. Tellier, S. Vattikuti, S. M. Purcell
et al., 2015 Second-generation PLINK: rising to the challenge of larger and richer datasets. Gigascience 4: 7.https://doi.org/ 10.1186/s13742-015-0047-8
Chen, H., N. Patterson, and D. Reich, 2010 Population differenti-ation as a test for selective sweeps. Genome Res. 20: 393–402.
https://doi.org/10.1101/gr.100545.109
Chuck, G. S., P. J. Brown, R. Meeley, and S. Hake, 2014 Maize
SBP-boxtranscription factorsunbranched2andunbranched3 af-fect yield traits by regulating the rate of lateral primordia initi-ation. Proc. Natl. Acad. Sci. USA 111: 18775–18780.https:// doi.org/10.1073/pnas.1407401112
Doebley, J., A. Stec, and C. Gustus, 1995 Teosinte branched1 and the origin of maize: evidence for epistasis and the evolution of dominance. Genetics 141: 333–346.
Duncan, W. G., W. A. Williams, and R. S. Loomis, 1967 Tassels and the productivity of maize. Crop Sci. 7: 37–39.https://doi. org/10.2135/cropsci1967.0011183X000700010013x
Duvick, D. N. “What is yield?” Developing drought and low N-tolerant maize. CIMMYT, El Batan, Mexico. 1997: 332–335. Duvick, D. N., 2005 The contribution of breeding to yield
ad-vances in maize (Zea mays L.). Adv. Agron. 86: 83–145.
https://doi.org/10.1016/S0065-2113(05)86002-X
Elshire, R. J., J. C. Glaubitz, Q. Sun, J. A. Poland, K. Kawamoto
et al., 2011 A robust, simple genotyping-by-sequencing (GBS) approach for high diversity species. PLoS One 6: e19379.
https://doi.org/10.1371/journal.pone.0019379
Fischer, K. S., G. O. Edmeades, and E. C. Johnson, 1987 Recurrent selection for reduced tassel branch number and reduced leaf area density above the ear in tropical maize populations. Crop Sci. 27: 1150–1156.https://doi.org/10.2135/cropsci1987. 0011183X002700060013x
Flint-Garcia, S. A., A.-C. C. Thuillet, J. Yu, G. Pressoir, S. M. Romero
et al., 2005 Maize association population: a high-resolution platform for quantitative trait locus dissection. Plant J. 44: 1054–1064.https://doi.org/10.1111/j.1365-313X.2005. 02591.x
Friedman, J., and S. C. H. Barrett, 2009 Wind of change: new insights on the ecology and evolution of pollination and mating in wind-pollinated plants. Ann. Bot. 103: 1515–1527.https:// doi.org/10.1093/aob/mcp035
Gage, J. L., N. D. Miller, E. P. Spalding, S. M. Kaeppler, and N. de Leon, 2017 TIPS: a system for automated image-based pheno-typing of maize tassels. Plant Methods 13: 21.https://doi.org/ 10.1186/s13007-017-0172-8
Haasl, R. J., and B. A. Payseur, 2016 Fifteen years of genomewide scans for selection: trends, lessons and unaddressed genetic sources of complication. Mol. Ecol. 25: 5–23.https://doi.org/ 10.1111/mec.13339
Hammer, G. L., Z. Dong, G. McLean, A. Doherty, C. Messinaet al., 2009 Can changes in canopy and/or root system architecture explain historical maize yield trends in the U.S. corn belt? Crop Sci. 49: 299–312.https://doi.org/10.2135/cropsci2008.03.0152
Hirsch, C. N., J. M. Foerster, J. M. Johnson, R. S. Sekhon, G. Mut-toniet al., 2014 Insights into the maize genome and pan-transcriptome. Plant Cell 26: 121–135. https://doi.org/ 10.1105/tpc.113.119982
Hufford, M. B., X. Xu, J. van Heerwaarden, T. Pyhäjärvi, J.-M. Chia
et al., 2012 Comparative population genomics of maize domesti-cation and improvement. Nat. Genet. 44: 808–811.https://doi. org/10.1038/ng.2309
Hunter, R. B. B., T. B. Daynard, D. J. J. Hume, J. W. W. Tanner, J. D. D. Curtiset al., 1969 Effect of tassel removal on grain yield of corn (Zea mays L.). Crop Sci. 9: 405–406.https://doi.org/10. 2135/cropsci1969.0011183X000900040003x
Jeong, H., K. D. Song, M. Seo, K. Caetano-Anollés, J. Kimet al., 2015 Exploring evidence of positive selection reveals genetic basis of meat quality traits in Berkshire pigs through whole genome sequencing. BMC Genet. 16: 104. https://doi.org/ 10.1186/s12863-015-0265-1
Jiao, Y., P. Peluso, J. Shi, T. Liang, M. C. Stitzer et al., 2017 Improved maize reference genome with single-molecule technologies. Nature 546: 524–527. https://doi.org/10.1038/ nature22971
Koлмoгopoв, A. H., 1933 Sulla determinazione empirica di una leggi di distribuzione. Giorn. 1st it lit o Ital. Attuari 4: 83–91. Lamkey, K. R., P. A. Peterson, and A. R. Hallauer, 1991 Frequency
of the transposable element Uq in Iowa Stiff Stalk synthetic maize populations. Genet. Res. 57: 1–9. https://doi.org/10. 1017/S0016672300028962
Liu, X., M. Huang, B. Fan, E. S. Buckler, and Z. Zhang, 2016 Iterative usage of fixed and random effect models for powerful and efficient genome-wide association studies. PLoS Genet. 12: e1005767 (erratum: PLoS Genet. 12: e1005957).
https://doi.org/10.1371/journal.pgen.1005767
Maclean, C. A., N. P. Chue Hong, and J. G. D. Prendergast, 2015 Hapbin: an efficient program for performing haplotype-based scans for positive selection in large genomic datasets. Mol. Biol. Evol. 32: 3027–3029. https://doi.org/10.1093/molbev/ msv172
McMullen, M. D., S. Kresovich, H. S. Villeda, P. Bradbury, H. Li
et al., 2009 Genetic properties of the maize nested association mapping population. Science 325: 737–740. https://doi.org/ 10.1126/science.1174320
McSteen, P., and S. Hake, 2001 Barren Inflorescence2 regulates axillary meristem development in the maize inflorescence. De-velopment 128: 2881–2891.
Meghji, M. R. R., J. W. W. Dudley, R. J. J. Lambert, and G. F. F. Sprague, 1984 Inbreeding depression, inbred and hybrid grain yields, and other traits of maize genotypes representing three eras. Crop Sci. 24: 545–549. https://doi.org/10.2135/cropsci1984. 0011183X002400030028x
Mevik, B.-H., and R. Wehrens, 2007 The pls package: principle component and partial least squares regression in R. J. Stat. Softw. 18: 1–24.https://doi.org/10.18637/jss.v018.i02
Mickelson, S. M., C. S. Stuber, L. Senior, and S. M. Kaeppler, 2002 Quantitative trait loci controlling leaf and tassel traits in a B73 x Mo17 population of maize. Crop Sci. 42: 1902– 1909.https://doi.org/10.2135/cropsci2002.1902
Mikel, M. A., and J. W. Dudley, 2006 Evolution of North American dent corn from public to proprietary germplasm. Crop Sci. 46: 1193.https://doi.org/10.2135/cropsci2005.10-0371
R Core Team, 2016 R: A Language and Environment for Statistical Computing. R Foundation for Statistical Computing, Vienna. Reif, J. C., A. R. Hailauer, and A. E. Melchinger, 2005 Heterosis
and heterotic patterns in maize. Maydica 50: 215–223. Rothammer, S., D. Seichter, M. Förster, and I. Medugorac, 2013 A
genome-wide scan for signatures of differential artificial selec-tion in ten cattle breeds. BMC Genomics 14: 908. https://doi. org/10.1186/1471-2164-14-908
Rubin, C. J., M. C. Zody, J. Eriksson, J. R. S. Meadows, E. Sherwood
et al., 2010 Whole-genome resequencing reveals loci under selection during chicken domestication. Nature 464: 587–591.
https://doi.org/10.1038/nature08832
Sabeti, P. C., P. Varilly, B. Fry, J. Lohmueller, E. Hostetter et al., 2007 Genome-wide detection and characterization of positive selection in human populations. Nature 449: 913–918.https:// doi.org/10.1038/nature06250
Scheet, P., and M. Stephens, 2006 A fast and flexible statistical model for large-scale population genotype data: applications to inferring missing genotypes and haplotypic phase. Am. J. Hum. Genet. 78: 629–644.https://doi.org/10.1086/502802
Smirnov, N., 1948 Table for estimating the goodness of fit of empirical distributions. Ann. Math. Stat. 19: 279–281.https:// doi.org/10.1214/aoms/1177730256
Swarts, K., H. Li, J. A. Romero Navarro, D. An, M. C. Romayet al., 2014 Novel methods to optimize genotypic imputation for low-coverage, next-generation sequence data in crop plants. Plant Genome 7(3).https://doi.org/10.3835/plantgenome2014. 05.0023
Tian, F., P. J. Bradbury, P. J. Brown, H. Hung, Q. Sun et al., 2011 Genome-wide association study of leaf architecture in the maize nested association mapping population. Nat. Genet. 43: 159–162.https://doi.org/10.1038/ng.746
Tukey, J. W., 1949 Comparing individual means in the analysis of variance. Biometrics 5: 99.https://doi.org/10.2307/3001913
Upadyayula, N., H. S. Da Silva, M. O. Bohn, and T. R. Rocheford, 2006 Genetic and QTL analysis of maize tassel and ear infl o-rescence architecture. Theor. Appl. Genet. 112: 592–606.
https://doi.org/10.1007/s00122-005-0133-x
Valdar, W., L. C. Solberg, D. Gauguier, S. Burnett, P. Klenerman
et al., 2006 Genome-wide genetic association of complex traits in heterogeneous stock mice. Nat. Genet. 38: 879–887.https:// doi.org/10.1038/ng1840
Biol. 5: e147 (2007)].https://doi.org/10.1371/journal.pbio. 0040072
Wallace, J. G., P. J. Bradbury, N. Zhang, Y. Gibon, M. Stittet al., 2014 Association mapping across numerous traits reveals pat-terns of functional variation in maize. PLoS Genet. 10: e1004845.
https://doi.org/10.1371/journal.pgen.1004845
Wang, H., T. Nussbaum-Wagler, B. Li, Q. Zhao, Y. Vigourouxet al., 2005 The origin of the naked grains of maize. Nature 436: 714–719.https://doi.org/10.1038/nature03863
Wardlaw, I. F., 1990 Tansley review No. 27. The control of carbon partitioning in plants. New Phytol. 116: 341–381. https://doi. org/10.1111/j.1469-8137.1990.tb00524.x
Weir, B., and C. C. Cockerham, 1984 Estimating F-statistics for the analysis of population structure. Evolution (N. Y.) 38: 1358– 1370.https://doi.org/10.1111/j.1558-5646.1984.tb05657.x
Wu, X., Y. Y. Li, Y. Shi, Y. Song, D. Zhang et al., 2016 Joint-linkage mapping and GWAS reveal extensive genetic loci that regulate male inflorescence size in maize. Plant Biotechnol. J. 14: 1551–1562.https://doi.org/10.1111/pbi.12519
Xie, W., G. Wang, M. Yuan, W. Yao, K. Lyuet al., 2015 Breeding signatures of rice improvement revealed by a genomic variation map from a large germplasm collection. Proc. Natl. Acad. Sci. USA 112: E5411–E5419.https://doi.org/10.1073/pnas.1515919112
Xu, G., X. Wang, C. Huang, D. Xu, D. Li et al., 2017 Complex genetic architecture underlies maize tassel domestication. New Phytol. 214: 852–864.https://doi.org/10.1111/nph.14400
Yang, S., X. Li, K. Li, B. Fan, and Z. Tang, 2014 A genome-wide scan for signatures of selection in Chinese indigenous and com-mercial pig breeds. BMC Genet. 15: 7.https://doi.org/10.1186/ 1471-2156-15-7
Zhou, Z., Y. Jiang, Z. Wang, Z. Gou, J. Lyu et al., 2015 Resequencing 302 wild and cultivated accessions identifies genes related to domestication and improvement in soybean. Nat. Biotechnol. 33: 408–414 [corrigenda: Nat. Biotechnol. 34: 441 (2016)]. https://doi.org/10.1038/nbt. 3096