INVESTIGATION
On the Statistical Interpretation of Site-Speci
fi
c
Variables in Phylogeny-Based Substitution Models
Nicolas Rodrigue1
Eastern Cereal and Oilseed Research Centre, Agriculture and Agri-Food Canada, Ottawa, Ontario, Canada K1A 0C6 and Department of Biology, University of Ottawa, Ontario, Canada K1N 6N5
ABSTRACT Phylogeny-based modeling of heterogeneity across the positions of multiple-sequence alignments has generally been approached from two main perspectives. Thefirst treats site specificities as random variables drawn from a statistical law, and the likelihood function takes the form of an integral over this law. The second assigns distinct variables to each position, and, in a maximum-likelihood context, adjusts these variables, along with global parameters, to optimize a joint likelihood function. Here, it is emphasized that while thefirst approach directly enjoys the statistical guaranties of traditional likelihood theory, the latter does not, and should be approached with particular caution when the site-specific variables are high dimensional. Using a phylogeny-based mutation-selection framework, it is shown that the difference in interpretation of site-specific variables explains the incongruities in recent studies regarding distributions of selection coefficients.
M
ODELING the heterogeneity of evolutionary regimes across the different positions of genes is of great in-terest in evolutionary genetics. Among the phylogeny-based approaches taken are two main formulations. The first ap-proach is generalized as follows: considering theith alignment column, written asDi, one defines a (potentially multivariate)random variable, denoted here as xi. Then, given a set of
global parameters u, the likelihood for siteitakes the form of an integral over a chosen statistical lawV(xi) and is written
aspðDijuÞ ¼RpðDiju;xiÞVðxiÞdxi. The random variable is said
to be integrated away. Moreover, the global (multidimen-sional) parameter u may include elements controlling the form of the statistical law V. Assuming independence be-tween the sites of the alignment, the overall likelihood is a product across all site likelihoods, written explicitly as
pðDjuÞ ¼RpðDju;xÞVðxÞdx¼Qi R
pðDiju;xiÞVðxiÞdxi.
The most well-known instance of the random-variable approach is the gamma-distributed rates across sites model proposed by Yang (1993). In this model, the random vari-able is the rate at a given position—which acts as a branch-length multiplier—and the statistical law governing it is a gamma distribution of mean 1, and of variance 1/a. In a maximum-likelihood framework, the shape parameterais
included as an element of u, and this overall hypothesis vector is adjusted to ^u, which maximizes the likelihood. It should be noted that in practice, integrating over the statis-tical law governing a random variable can be difficult, and in the case of the gamma-distributed rates model most imple-mentations rely on either a discretization method [which reduces the integral to a weighted sum (Yang 1994, 1996)] or on MCMC sampling in a Bayesian framework (e.g., Mateiu and Rannala 2006). In the latter context, the sampling system straightforwardly enables the evaluation of posterior distributions of random variables, but analogous calculations are also possible in a maximum-likelihood context, through empirical Bayes methods (see,e.g., Anisimova 2012). Other examples of phylogeny-based random variable approaches are plentiful and include models for heterogeneous nonsynonymous rates (Yang et al. 2000), for heterogeneous nonsynonymous and synonymous rates (Kosakovsky Pond and Muse 2005), and for heterogeneous amino acid profiles (Lartillot and Philippe 2004).
A second line of work has taken what might be called an
extensive parameterizationapproach, within which each site-specific variablexiis itself treated as part of the parameters
of the model, with the likelihood function optimized being
p(D|u,x) so as to obtain estimates^uand^x(e.g., Bruno 1996; Halpern and Bruno 1998; Kosakovsky Pond and Frost 2005; Massingham and Goldman 2005; Delport et al. 2008; dos Reis et al. 2009; Holder et al. 2008; Tamuri et al. 2009, 2012; Murrell et al.2012). These articles continue to drive
Copyright © 2013 Her Majesty the Queen in the Right of Canada doi: 10.1534/genetics.112.145722
Manuscript received September 7, 2012; accepted for publication November 24, 2012 1Address for correspondence: Agriculture and Agri-Food Canada, 960 Carling Ave.,
several lines of research. For instance, the seminal article by Halpern and Bruno (1998) has greatly stimulated develop-ments in population-genetics-based substitution modeling (see Thorne et al.2012, for more details) and more recent studies, such as those of Tamuri et al. (2009, 2012), have demonstrated promising applications of these modeling ideas. The extensive parameterization approach, however, faces serious statistical challenges. In contrast to the construction of the random variable approach, where an observation consists of an alignment site (Di), and where the form of the
statistical law will be inferred more reliably as more obser-vations are provided (i.e., as the global-likelihood function becomes a product across a greater number of site likeli-hoods), in the extensive parameterization approach, addi-tional sites also introduce their own new set ofxivariables
and thus provide no information for the overall inference of across-site heterogeneity. Tamuriet al.(2012) suggest that in such modeling contexts it is the addition of sequences that is of relevance. However, this view is problematic. The likeli-hood function depends on the underlying tree topology (in-voking the pruning algorithm specific to that tree for computing site likelihoods, as described by Felsenstein 1981); in adding a new sequence, one is not computing the likelihood based on one more observation. Rather, one is changing the definition of the likelihood function itself, since a new sequence implies a new underlying tree, typi-cally adding a pair of branch length parameters. For this reason, and as argued by Yang (see, e.g., Yang 2006, p. 190, and references therein), the tree structure is perhaps best considered as constituting an inherent part of the over-all model construction. A new sequence implies a new un-derlying likelihood model, and thus the behavior of such a system as the number of sequences increases does not correspond to the usual large-sample conditions of likeli-hood analysis. Altogether, there is no way to increase the richness of the data (through further data collection of ei-ther positions or taxa) in the extensive parameterization approach without, in so doing, changing the precise para-metric form of the model, and one is thus left without any asymptotic conditions to envisage.
These difficulties of extensive parameterization do not mean that all applications of the approach will necessarily be statistically misbehaved. Instead, they point to the fact that the usual theoretical guaranties of likelihood estimation (e.g., consistency and efficiency) do not directly apply in such contexts (Felsenstein 2001; Yang 2006), since there is no way of presenting more data to a given parametric form—the assumption of asymptotic theory. Also note that there may be conditions for which subsets of parameters could be shown to be well estimated, even without proper asymptotic conditions for the entire set of parameters. These conditions may be difficult to foresee, however, and in appli-cations the extensive parameterization approach should probably be subjected to careful analytical examination and/or simulation studies. When site-specific variables are of low dimensionality, previous works have found that
extensive parameterization approaches can provide reliable inference systems, particularly when these inferences are not directly based on the values of site-specific variables themselves (e.g., Kosakovsky Pond and Frost 2005; Massing-ham and Goldman 2005). However, relatively little work has been done to examine cases in which site-specific variables are of high dimensionality. Moreover, a recent application of the extensive parameterization approach in a high-dimen-sional case has produced results that conflict with previous studies employing similar models under random variable approaches (Tamuriet al.2012).
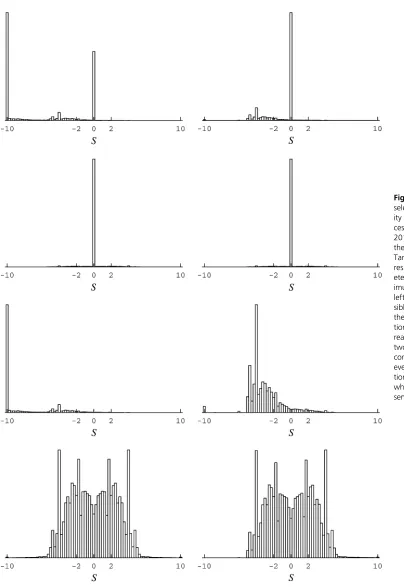
To explore the differences between random variable and extensive parameterization approaches in a high-dimensional instance, what follows uses a mutation-selection framework inspired by Halpern and Bruno (1998) in both modeling contexts. The form of the substitution model is described elsewhere (e.g., Rodrigue and Aris-Brosou 2011). Briefly, the motivation behind the form of model of focus here is to define a substitution process fromfirst principles of population genetics, based on a global set of mutational parameters and a set of site-specific variables controlling amino acidfitness. Such models allow one to calculate the distribution of scaled selection coefficients from phylogenetic data (see,e.g., Yang and Nielsen 2008; Tamuriet al.2012), and the emphasis here is on contrasting the distributions obtained from real data under the maximum-likelihood extensive parameterization approach (Figure 1) and some Bayesian random variable ap-proaches (Figure 2), while inspecting site-specific inferences (Figure 3). Simple simulation experiments are also performed to further evaluate the approaches (Figure 4). Results from the analysis of the real data set highlight the very different con-clusions of the approaches in a high-dimensional context and suggest that the extensive parameterization approach is prone to overfitting. Results from the analysis of simulated data sets confirm this and show how the extensive parameterization approach can lead to markedly erroneous inferences.
Materials and Methods
Data
The PB2 influenza data set (with the tree topology) analyzed by Tamuriet al.(2012), composed of 401 sequen-ces, 759 codons, is reanalyzed here for the sake of compar-ison between the extensive parameterization and random variable approaches.
Codon substitution
The basic form of the codon substitution process is based on global mutational parameters and site-specific amino acid variables. The mutational parameters, consisting of a set of (reversible) nucleotide exchangeabilities, @¼ ð@abÞ1#a;b#4, with the constraintP1#a,b#4@ab¼1, and a set of nucleotide
propensity parameters, u¼ ðuaÞ1#a#4, with P4
a¼1ua¼1,
stateatob; the synonymous substitution rates are thus pro-portional to @abub. This factor also applies to
nonsynony-mous rates, but the site-specific amino acid variables further modulate nonsynonymous events; for site i, the amino acid variables are denoted fðiÞ¼ ðfðiÞ
l Þ1#l#20, with P
1#l#20fðliÞ¼1 and define the scaled selection coefficient
SlmðiÞ¼ln fmðiÞ2ln fð iÞ
l associated with replacing amino acid
lwithm(the scale is the effective chromosomal population size). The scaled selection coefficient in turn defines the
fixation factor—the ratio of the fixation probability of the amino-acid-replacing mutation to thefixation probability of a neutral mutation—given asSðlmiÞ=ð12e2SðlmiÞÞ, which is
mul-tiplied to the mutational factor to give the nonsynonymous codon substitution rate (also see Yang and Nielsen 2008, for
more details). The model closely resembles the one recently studied by Tamuriet al.(2012), in the extensive parameter-ization context.
Markov chain Monte Carlo sampling
A simulated annealing algorithm was used to perform maximum-likelihood estimation for the extensive
parame-terization approach. The algorithm is described in Rodrigue
et al. (2007), and works as follows. Update operators are applied onuandx(see,e.g., Rodrigue and Lartillot 2012, for explanations on Markov chain Monte Carlo (MCMC) update operators), but when these operators propose changes tou9 andx9that result in a decrease in the likelihood score, the proposed change is accepted with a probability proportional
to½pðDju9;x9Þ=pðDju;xÞt, wheret is theinverse temperature
parameter of the simulated annealing procedure. As t increases, the MCMC sampler freezes, meaning that pro-posals that decrease the likelihood have a progressively lower probability of acceptance. A linear cooling schedule is applied, starting att= 1, increasing in steps of 500 every 5 cycles; each cycle includes 10 multiplicative updates to each branch length, 10 profile updates to mutational param-eters (uand@), and 15 profile updates to each of the site-specific amino acid variables (f). The algorithm’s cooling is terminated att= 10, 001, and the chain is allowed to pro-ceed for another 1000 cycles. Each simulated annealing run requires about 4 weeks on one hyper-threaded core of an Intel i7 processor.
For Bayesian posterior sampling, a data-augmentation MCMC sampling system (see, e.g., Rodrigue et al.2008b) was applied. Such a system, which is not compatible with the simulated annealing algorithm, is much more efficient than a full pruning-based MCMC sampler and, critically for sampling from the posterior, allows for many more updates per cycle. The basic reason for this is that, conditional on a particular data augmentation, MCMC updates can be per-formed without invoking costly matrix exponentiation or
pruning algorithms. These costly operations need only be done once per cycle, before drawing a new data augmenta-tion. Altogether, each cycle includes 200 multiplicative updates to branch lengths, 100 profile updates to mutational parameters, 100 profile updates on site-specific amino acid variables, 100 updates on hyperparameters, and a (Gibbs-based) data-augmentation update. Draws were saved every
five cycles until reaching a sample size of 1100, and thefirst 100 draws were discarded asburn-in. Bayesian MCMC runs require about 5 weeks of CPU time. Priors (under the approaches in the Bayesian alternatives subsection below) not discussed herein are as in Rodrigueet al.(2008a).
Results and Discussion
Extensive parameterization
First, adopting the extensive parameterization approach for the moment, branch lengths, mutational parameters, and site-specific amino acid variables were jointly adjusted to near-maximum-likelihood values. Nearis used in the sense that although the simulated annealing runs converged quickly for the mutational parameters, and did so to values closely matching those reported by Tamuriet al.(2012) (at
Figure 3 Amino acid logo checks, for thefirst 50 positions of the PB2 data set. First row: the site-specific frequencies of amino acids observed in the translated alignment. Second row: the site-specific variables inferred under the maximum-likelihood extensive parameterization approach (closely corresponding to the approach used in Tamuriet al.2012). Third and fourth rows: the posterior mean site-specific random variables (under a model with aflat Dirichlet prior, in the third row, and under a model with a free set of hyperparameters controlling site-specific random vari-ables, in the fourth row).
Figure 4 Distribution of scaled selection coefficients for all mutations at stationarity of the codon substitution process. The distributions are for simulated data. (Top) The data analyzed are simulated from random draws from the posterior under theflexible Bayesian model (the distribu-tion ofSbased on the parameters inferred from the real data are shown as a black histogram, whereas the distributions obtained from the infer-ence applied to the simulated data, for 50 replicates, are shown as a red lines for the extensive parameterization approach and green lines for the
^
@AC¼0:069, @^AG¼0:358, ^@AT¼0:037, @^CG¼0:016,
^
@CT¼0:438, and @^GT¼0:081 for the exchangeability
parameters, andu^A¼0:392, u^C¼0:177,u^G¼0:216, and
^
uT¼0:214 for the propensity parameters), branch lengths,
and especially site-specific amino acid variables, were diffi -cult to optimize. Using a dozen simulated annealing runs, it was found that, although having a sharply defined area of high likelihood, the likelihood surface has a weak gradient, particularly so with respect to amino acid variables, within this high-likelihood area. For the amino acid variables, this area has low values for those variables corresponding to amino acids unobserved in the alignment (see Figure 3,first and second rows). This property is another indication of a potential statistical problem: the guaranties of likelihood theory break down when the optimum is approached by having parameters tend to the boundary of the permissible space of values (e.g., to 0, in the present formulation) or having them grow unbounded (e.g., to2Nin the formula-tion of Tamuriet al. 2012), since this is assumed not to be the case in traditional asymptotic derivations (e.g., Wald 1949). Proceeding regardless, small differences obtained across the simulated annealing runs did not substantially affect the distribution of selection coefficients inferred at stationarity, and the results from one run are displayed on the left side of Figure 1.
These distributions match well with those reported in Tamuri et al. (2012) and have the feature of a large pro-portion of highly deleterious mutations (scaled selection co-efficient S # 210, for instance, in Figure 1, top left). However, as argued herein, this feature is a result of the extensive parameterization approach leading to exaggerated conclusions in a high-dimensional case.
Within the extensive parameterization approach, each codon site i has its own substitution model, distinguished from other codon sites by its amino acid variables; in this way the model at siteiis tailored to observationDi. Atfirst
sight it may appear that the use of 401 rows (codons) for eachDirepresents a large amount of information. However,
one of the most important points of phylogenetic analysis is that sequences are not considered independent realizations of a substitution process. Instead, they are considered as related realizations of that process, and these relations are accounted for in the use of a tree structure. In practice, for typical alignments, many sites are observed to be in the same state for a large proportion of the sequences at hand. For the data set studied here, 679 of the 759 sites have more than half the 401 codons in an identical state. Averaging across all sites, the mean number of codon states required to cover 95% of a site’s empirical codon frequency profile is
3.2. Presented with this limited signal from which to infer the 19 degrees of freedom modulating the rates of all pos-sible nonsynonymous point mutations at a given site, the model will tend to consider unobserved amino acids as highly deleterious or lethal (although there can be excep-tions for cases in which unobserved amino acids facilitate substitution trajectories between certain amino acids; see
Holder et al. 2008). As a result, events from observed to unobserved amino acids will tend to have large negative scaled selection coefficients. Indeed, evaluating the distribu-tions while discounting events to unobserved amino acids (Figure 1, right) does not produce a large peak atS#210. Previous works have referred to the extensive parame-terization approach’s inherent high potential for overfitting as the infinitely many parameters trap (Felsenstein 2001; Yang 2006, p. 272). Several aspects of the present applica-tion suggest the condiapplica-tions of such a trap: the values of sites’ amino acid variables appear highly data specific (comparing the first and second rows of Figure 3); the distribution of selection coefficients of substitutions is of very high com-plexity (Figure 1, bottom); and finally, the approach is of very high dimensionality (the amino acid variables alone introduce 14,421 degrees of freedom to the model) relative to the data set’s size. A careful comparison with other approaches seems warranted.
Bayesian alternatives
Strategies based on penalized likelihood or smoothing might be applicable and pertinent in extensive parameterization applications, but perhaps the simplest alternative is to adopt a random variable interpretation instead (Felsenstein 2001; Yang 2006), within which one can define the parametric form of a model without requiring a count of the number of data columns. However, the discretization approaches to handling the integration of site-specific variables over a sta-tistical law—as called for under the random variable ap-proach—do not easily extend to multivariate cases, such as that studied by Tamuriet al.(2012) and reprised above, making it more challenging to adopt a random variable in-terpretation in a maximum-likelihood context. One could rely on MCMC sampling to estimate the gradient of the likelihood surface with respect to the parameter governing the statistical law on site variables and follow that gradient to a maximum (e.g., Rodrigue et al. 2007). On the other hand, the MCMC approach lends itself naturally to a Bayes-ian context, where the random variable interpretation is in-trinsic. Briefly, in the Bayesian MCMC context, the sampling methodology for the random variable interpretation falls into a class of methods known as parameter expansion
(Liu et al. 1998), which simply exploits the fact that any inferences relying on u, and based on the posterior prob-abilityp(u|D), can equivalently be based on the joint posterior of u and the random variables x, written as p(u, x|D); the marginal and joint distributions relate as pðujDÞ ¼
R
pðu;xjDÞdx}RpðDju;xÞVðxÞdx, and u follows the same distribution in both cases. With parameter expansion, x is considered an auxiliary variable, with MCMC updates ap-plied to it to effectively integrate over V, and the posterior distribution of x is thus available as a by-product of the sampling system used for integration.
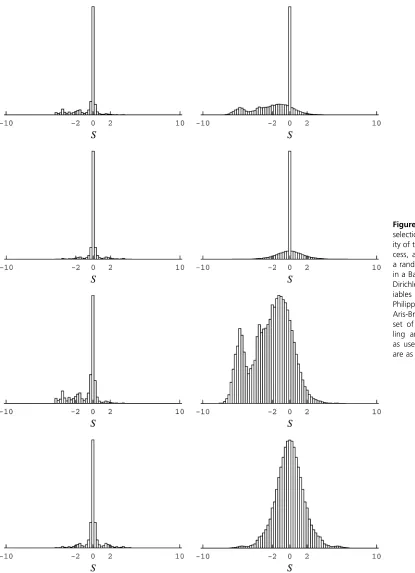
amino acid variables (Lartillot and Philippe 2004; Rodrigue and Aris-Brosou 2011); this model is referred to as therigid model. In a second model, the parameters governing the prior statistical law are treated as free parameters (often referred to ashyperparametersin such cases, and here con-sisting of aconcentrationparameter and acenterprofile, as in Lartillot 2006); this model is referred to as the flexible model. The distributions of scaled selection coefficients obtained using the posterior mean parameter and random variable values of the post-burn-in MCMC runs under these models are displayed in Figure 2.
Under the random variable interpretation of a Bayesian framework, no peak of highly deleterious mutations atS#
210 is inferred (e.g., Figure 2, top rows). In this framework, the posterior means of site-specific random variables are far less committal with regard to unobserved amino acids (Fig-ure 3, third and fourth rows), resulting in few mutations with large, negative, scaled selection coefficients. The dis-tributions obtained under the rigid model (Figure 2, left columns) are much less contrasted than those obtained un-der theflexible model (Figure 2, right columns). This is not surprising. Assuming a uniform base distribution is analo-gous to arbitrarily setting, say,a= 10 in gamma-distributed rates across sites model; in most cases where such a model is warranted, treatingaas a free parameter, part of the overall inference, will better capture the underlying rate heteroge-neity. Here, the flexible model infers a more biologically plausible proportion of deleterious mutations, although not to the point of the extensive parameterization approach; posterior means of amino acid variables are correspondingly more focused under this model (Figure 3, fourth row).
Simulations
Analyses of the PB2 data set under extensive parameteriza-tion and random variable approaches lead to different conclusions: whereas the extensive parameterization ap-proach considers unobserved amino acids as highly delete-rious, the Bayesian random variable approaches are less conclusive in this regard. Theoretical arguments aside, it remains unclear which aspects of the results are features of the inference system and which are features of the data. As a simple experiment to emphasize the differences between the two approaches, 50 random draws from the posterior sample obtained under the flexible Bayesian model were used to simulate artificial data sets. Each artificial data set was then analyzed, using the extensive parameterization approach and the flexible Bayesian model, and the distri-butions of scaled selection coefficients for all mutations are displayed for all replicates in Figure 4, top. The distribution obtained under the original inference on the true data set is displayed to serve as a reference (Figure 4, top black histogram)
The flexible Bayesian random variable model (Figure 4, top, green lines) provides relatively good performance, but the results show the difficulty in estimating very low values for amino acid variables; although a small secondary mode
is inferred aroundS27 (although graphically barely vis-ible), reflecting the secondary mode of the distribution obtained based on the real data, its lesser prominence is indicative of too weakly peaked amino acid variables. None-theless, in terms of overall shape and location of the distri-butions, the results of the random variable approach appear more sensible than those obtained under extensive param-eterization. With the latter, the distribution (Figure 4, top, red lines) indicates a large proportion of mutations withS#
210, qualitatively matching that obtained on the real data when using this same approach, but far from matching the simulation conditions. Such a distribution further indicates that the results of the extensive parameterization approach on the real data may not be reliable.
Repeating this experiment using a pure mutational model (i.e., a version of the mutation-selection model that treats all amino acids as equivalent at all sites) to simulate the artifi -cial data sets also yields a disappointing result for the exten-sive parameterization approach (Figure 4, bottom, red lines), again, with a large peak at S#210. This result again
con-firms the inappropriate statistical properties of the extensive parameterization approach in high-dimensional contexts. The
flexible Bayesian model, in contrast, appropriately leads to a tight distribution around S= 0 (Figure 4, bottom, green lines), essentially recovering the simulation conditions.
Hierarchical modeling directions
Although the extensive parameterization utilized in Tamuri
et al.(2012) leads to the inference of a biologically plausible large proportion of highly deleterious mutations, which, as discussed by these authors, better matches results from pre-vious experimental and population-level studies, such infer-ences rest on what appear to be conditions of overfitting and lead to overly contrasted inferences. As discussed previously, if one wishes to present the model with a larger amount of data, one finds that the model itself becomes a “moving target,” changing parametric forms as the data set grows in size. Because of this asymptotic deficiency, the approach should be treated with great caution.
When a random variable approach is adopted, large proportions of highly deleterious mutations are not inferred, at least not to the level of the extensive parameterization approach. That the distributions of scaled selection
fact that model with free hyperparameters (the flexible model) produces somewhat more sensible results suggests that further work aimed at suitably capturing heterogeneity in the mutation-selection framework could be worthwhile.
The range of models worthy of inclusion in future investigations could be broad. Combining mixture modeling ideas with the parametric framework adopted herein, one could envisage a model with a mixture of base distributions governing site-specific amino acid random variables; in line with thefirst example mentioned in the opening section, an analogous idea was used by Mayrose et al. (2005), in a model with the rates across sites governed by a mixture of gamma distributions. The nonparametric system based on the Dirichlet process (Rodrigueet al.2010) also constitutes a promising and generalizing direction along these lines. A site-heterogeneous modeling project thus becomes an explo-ration of alternative hierarchical formulations governing a random-variable interpretation.
Acknowledgments
I thank Nicolas Lartillot, Stéphane Aris-Brosou, Mario dos Reis, Claus Wilke, and an anonymous reviewer for their suggestions and critical comments on the manuscript. I also thank Chris Lewis for his help in configuring computing clusters. This work was supported by Agriculture and Agri-Food Canada.
Literature Cited
Anisimova, M., 2012 Parametric models of codon substitution, pp. 12–33 inCodon Evolution, edited by G. M. Cannarozzi and A. Schneider. Oxford University Press, Oxford.
Bruno, W. J., 1996 Modeling residue usage in aligned protein se-quences via maximum likelihood. Mol. Biol. Evol. 13: 1368–1374. Delport, W., K. Scheffler, and C. Seoighe, 2008 Frequent toggling between alternative amino acids is driven by selection in hiv-1. PLoS Pathog. 4: e1000242.
dos Reis, M., A. U. Tamuri, A. J. Hay, and R. A. Goldstein, 2009 Charting the host adaptation of influenza viruses. Mol. Biol. Evol. 28: 1755–1767.
Felsenstein, J., 1981 Evolutionary trees from DNA sequences: a maximum likelihood approach. J. Mol. Evol. 17: 368–376. Felsenstein, J., 2001 Taking variation in evolutionary rates
be-tween sites into account in inferring phylogenies. J. Mol. Evol. 53: 447–455.
Halpern, A. L., and W. J. Bruno, 1998 Evolutionary distances for protein-coding sequences: modeling site-specific residue fre-quencies. Mol. Biol. Evol. 15: 910–917.
Holder, M. T., D. J. Zwickl, and C. Dessimoz, 2008 Evaluating the robustness of phylogenetic methods to among-site variability in substitution processes. Phil. Tran. R. Soc. B 363: 4013–4021. Kosakovsky Pond, S. L., and S. D. Frost, 2005 Not so different
after all: a comparison of methods for detecting amino acid sites under selection. Mol. Biol. Evol. 22: 1208–1222.
Kosakovsky Pond, S. L., and S. V. Muse, 2005 Site-to-site varia-tion of synonymous substituvaria-tion rates. Mol. Biol. Evol. 22: 2375–2385.
Lartillot, N., 2006 Conjugate Gibbs sampling for Bayesian phylo-genetic models. J. Comput. Biol. 13: 1701–1722.
Lartillot, N., and H. Philippe, 2004 A Bayesian mixture model for across-site heterogeneities in the amino-acid replacement pro-cess. Mol. Biol. Evol. 21: 1095–1109.
Liu, C., D. B. Rubin, and Y. N. Wu, 1998 Parameter expansion to accelerate EM: the PX-EM algorithm. Biometrika 85: 755–770. Massingham, T., and N. Goldman, 2005 Detecting amino acid sites under positive selection and purifying selection. Genetics 169: 1753–1762.
Mateiu, L., and B. Rannala, 2006 Inferring complex DNA substi-tution processes on phylogenies using uniformization and data augmentation. Syst. Biol. 55: 259–269.
Mayrose, I., N. Friedman, and T. Pupko, 2005 A gamma mixture model better accounts for among site rate heterogeneity. Bioin-formatics 21(S2): ii151–ii158.
Murrell, B., T. de Oliveria, C. Seebregt, and S. L. Kosakovsky Pond 2012 Modeling hiv-1 drug resistance as episodic directional selection. PLOS Comput. Biol. 8: e1002507.
Rodrigue, N., and S. Aris-Brosou, 2011 Fast Baysian choice of phylogenetic models: prospecting data augmentation-based thermodynamic integration. Syst. Biol. 60: 881–887.
Rodrigue, N., and N. Lartillot, 2012 Monte Carlo computational approaches in Bayesian codon substitution modeling, pp. 45–59 in Codon Evolution, edited by G. M. Cannarozzi and A. Schneider. Oxford University Press, Oxford.
Rodrigue, N., H. Philippe, and N. Lartillot, 2007 Exploring fast computational strategies for probabilistic phylogenetic analysis. Syst. Biol. 56: 711–726.
Rodrigue, N., H. Philippe, and N. Lartillot, 2008a Bayesian compar-isons of codon substitution models. Genetics 180: 1579–1591. Rodrigue, N., H. Philippe, and N. Lartillot, 2008b Uniformization
for sampling realizations of Markov processes: applications to Bayesian implementations of codon substitution models. Bioin-formatics 24: 56–62.
Rodrigue, N., H. Philippe, and N. Lartillot, 2010 Mutation-selection models of coding sequence evolution with site-heterogeneous amino acid fitness profiles. Proc. Natl. Acad. Sci. USA 107: 4629–4634.
Tamuri, A. U., M. dos Reis, A. J. Hay, and R. A. Goldstein, 2009 Identifying changes in selection constraints: host shifts in influenza. Plos Comp. Biol. 5: e1000564.
Tamuri, A. U., M. dos Reis, and R. A. Goldstein, 2012 Estimating the distribution of selection coefficients from phylogenetic data using sitewise mutation-selection models. Genetics 190: 1101– 1115.
Thorne, J. L., N. Lartillot, N. Rodrigue, and S. C. Choi, 2012 Codon models as a vehicle for reconciling population genetics with inter-specific sequence data, pp. 97–110 inCodon Evolution, edited by G. M. Cannarozzi and A. Schneider. Oxford University Press, Oxford.
Wald, A., 1949 Note on the consistency of maximumm likelihood. Ann. Math. Stat. 20: 595–601.
Yang, Z., 1993 Maximum-likelihood estimation of phylogeny from DNA sequences when substitution rates differ over sites. Mol. Biol. Evol. 10: 1396–1401.
Yang, Z., 1994 Maximum likelihood phylogenetic estimation from DNA sequences with variable rates over sites: approximate methods. J. Mol. Evol. 39: 306–314.
Yang, Z., 1996 Among site variation and its impact on phyloge-netic analyses. Trends Ecol. Evol. 11: 367–370.
Yang, Z., 2006 Computational Molecular Evolution, Oxford Series in Ecology and Evolution. Oxford University Press, Oxford, New York.
Yang, Z., and R. Nielsen, 2008 Mutation-selection models of co-don substitution and their use to estimate selective strengths on codon usage. Mol. Biol. Evol. 25: 568–579.
Yang, Z., R. Nielsen, N. Goldman, and A.-M. K. Pedersen, 2000 Codon-substitution models for heterogeneous selection pressure at amino acid sites. Genetics 155: 431–449.