| INVESTIGATION
Replication Errors Made During Oogenesis Lead to
Detectable
De Novo
mtDNA Mutations in Zebra
fi
sh
Oocytes with a Low mtDNA Copy Number
Auke B. C. Otten,* Alphons P. M. Stassen,* Michiel Adriaens,†Mike Gerards,†Richard G. J. Dohmen,* Adriana J. Timmer,* Sabina J. V. Vanherle,* Rick Kamps,* Iris B. W. Boesten,* Jo M. Vanoevelen,* Marc Muller,‡and Hubert J. M. Smeets*,†,1 *Department of Genetics and Cell Biology, Clinical Genomics Unit, School for Oncology and Developmental Biology and †Maastricht Centre for Systems Biology, Maastricht University, 6200 MD, The Netherlands, and‡Laboratory of Organogenesis and Regeneration, Interdisciplinary Cluster for Applied Genoproteomics Research, Univérsité de Liège, 4000, Belgium ORCID IDs: 0000-0001-5034-9743 (A.B.O.); 0000-0002-4472-7119 (M.A.)
ABSTRACT Of all pathogenic mitochondrial DNA (mtDNA) mutations in humans, 25% is de novo, although the occurrence in oocytes has never been directly assessed. We used next-generation sequencing to detect point mutations directly in the mtDNA of 3–15 individual mature oocytes and three somatic tissues from eight zebrafish females. Various statistical and biologicalfilters allowed reliable detection ofde novovariants with heteroplasmy$1.5%. In total, we detected 38de novobase substitutions, but no insertions or deletions. These 38de novomutations were present in 19 of 103 mature oocytes, indicating that20% of the mature oocytes carry at least onede novomutation with heteroplasmy$1.5%. This frequency ofde novomutations is close to that deducted from the reported error rate of polymerase gamma, the mitochondrial replication enzyme, implying that mtDNA replication errors made during oogenesis are a likely explanation. Substantial variation in the mutation prevalence among mature oocytes can be explained by the highly variable mtDNA copy number, since we previously reported that20% of the primordial germ cells have a mtDNA copy number of#73 and would lead to detectable mutation loads. In conclusion, replication errors made during oogenesis are an important source ofde novomtDNA base substitutions and their location and heteroplasmy level determine their significance.
KEYWORDSmitochondrial DNA;de novomutations; next-generation sequencing; zebrafish; oogenesis
C
omparative sequence analysis of the mtDNA) has revealed a high degree of variability, much higher than its nuclear counterpart (Lynch et al. 2006). This is generally explained by limited recombination and recombination-me-diated mtDNA repair events to counteract errors made during mtDNA replication (Barret al.2005), and the close proximity of the unprotected mtDNA to the oxidative phosphorylation (OXPHOS) machinery, which produces (potentially) muta-genic reactive oxygen species (ROS) (Brand 2010). As a re-sult, mtDNA mutations are an important cause of a group of devastating inherited diseases (Taylor and Turnbull 2005). To date, over 150 pathogenic mtDNA mutations have beenidentified, as well as many more polymorphisms of un-known significance (Hellebrekerset al.2012). As human and animal cells have a high mtDNA copy number, wild-type and variant mtDNA genotypes can coexist, a state referred to as heteroplasmy. The high mtDNA copy number compensates low-level pathogenic mtDNA mutations and avoids disease manifestation. A pathogenic mtDNA mutation will only man-ifest if its heteroplasmy value exceeds a certain threshold (Hellebrekerset al.2012). The mtDNA inherits maternally, and a female carrying an mtDNA mutation can transmit this mutation to her offspring through the mtDNA of her oocytes. Maternal inheritance of a preexisting mtDNA mutation does not explain all patients suffering from mtDNA mutations. In 25% of these patients, the disease-causing mutation cannot be detected in the maternal mtDNA (Sallevelt et al.2016). Although we cannot exclude the possibility that some of these mutations were present at undetectably low heteroplasmy levels in the maternal mtDNA, this suggests that most of these
Copyright © 2016 by the Genetics Society of America doi: 10.1534/genetics.116.194035
Manuscript received July 21, 2016; accepted for publication October 13, 2016; published Early Online October 20, 2016.
1Corresponding author: Maastricht University, Postbus 616 (Box 16), 6200 MD
mutations have occurred de novo during germline develop-ment. The inheritance of the mtDNA occurs through a segrega-tional bottleneck; only a limited number of the mtDNA molecules, the so-called bottleneck size, from the oocyte are transmitted to the (primordial) germline cells (PGCs) of the next generation (Creeet al. 2008). We hypothesize that, in cases of constant mutation rate, a low mtDNA copy number at the bottom of the bottleneck could lead tode novomutations reaching detectable heteroplasmy levels that, dependent on the nature of the mutations, can be of functional and/or path-ogenic significance. Experimental evidence for this hypothesis has long been difficult to obtain, because of the low hetero-plasmy levels at which these mutations occur, which were generally below the detection level of conventional sequencing techniques. Over the past decade, next-generation sequencing (NGS) technologies have been developed, allowing in-depth, direct determination of the mutations and heteroplasmy levels in the mtDNA of individual oocytes.
An estimation of the prevalence ofde novomtDNA mutation requires a significant number of oocytes to be sequenced. For both biological and ethical reasons, this is difficult to achieve in humans and most animals. In contrast, oocyte collection from zebrafish is relatively easy and efficient; therefore, we used zebrafish mature oocytes to assess thede novomtDNA mutation risk. We characterized de novomutations, their location, and their heteroplasmy levels in 103 oocytes and three somatic (ma-ternal) tissues from eight different female zebrafish using NGS with a minimal coverage of 1700. Furthermore, for all oocytes with one or morede novomutation(s), we estimated the mtDNA copy number at which these mutations arose, based on their heteroplasmy levels. Given the high mtDNA sequence similarity between humans and zebrafish (Broughtonet al.2001) and the conservation of the mtDNA bottleneck within the animal king-dom (Howellet al.1992; Creeet al.2008; Wolffet al.2011; Lee et al.2012), ourfindings have insinuations for the occurrence of de novomtDNA disease in humans.
Materials and Methods
Zebrafish maintenance and sample collection
Wild-type female zebrafish from the AB strain were used. Raising and housing was conducted according to standard procedures at 28°(Kimmelet al.1995) in the zebrafish facil-ity of Liège Universfacil-ity, where local ethical approval by the committee of Animal Research was obtained. Mature unfer-tilized oocytes were collected by squeezing the abdomen of anesthetized females. The oocytes used were normal in mor-phological appearance. After oocyte collection, the female
fish were killed in ice-cold water, after which biopsies of brain, liver, and muscle were obtained. An overview of the 127 samples is given in Table 1.
Isolation procedure of mtDNA
Oocytes were collected in sterile tubes and lysed for 4 hr at 50° in 500ml DNA lysis buffer containing 75 mM NaCl, 50 mM EDTA, 20 mM HEPES, 0.4% SDS, and 200mg proteinase K
[Sigma (Sigma Chemical), St. Louis, MO]. Subsequently, isopropanol was added and samples were precipitated over-night at–20°. After thorough centrifugation, the DNA pellet was washed with 70% ethanol and dissolved in TE buffer. The biopsies of brain, liver, and muscle from the adult female
fish were collected in sterile tubes containing Nuclei Lysis solution from the Wizard Genomic Purification Kit (Promega, Madison, WI). Subsequently, mtDNA was extracted accord-ing to the manufacturer’s instructions and dissolved in FG3-buffer.
mtDNA amplification and sequencing
The mtDNA (reference NCBI: NC002333.2) was amplified in three5.6-kb amplicons (A–C). Fragment A (forward: 59-CAC ACCCCTGACTCCCAAAG-39 and reverse: 59-GGTCGTTTGTA CCCGTCAGT-39) amplified a target spanning nt 16,594 (gene: trna-pro) to 5952 (nd2); fragment B (forward: 59-AAATTAAC ACCCTAACAACGACCTG-39 and reverse: 59-GGGGATCAGTA CTTTTAGCATTGTAGT-39) an amplicon from nt 5669 (nd2) to 11,319 (nd4); and fragment C amplified the mtDNA from nt 11,170 (nd4l) to 295 (D-loop). Primers (designed with Primer3) were specific for the mtDNA to avoid the amplification of nuclear-encoded mitochondrial pseudogenes. PCR amplifi ca-tion was performed using Phusion Hot Start II DNA polymerase in GC-buffer (ThermoScientific, Waltham, MA): 30 sec at 98°, followed by 40 cycles of 10 sec at 98°(denaturation), 20 sec at 58°(annealing), and 8 min at 72°(extension), with afinal step for 10 min at 72°. The PCR product was checked using electro-phoresis on a 1% agarose gel containing ethidium bromide, allowing also the detection of large deletions. Amplicons were purified using the Agencourt AMPure XP system (Beckman, Fullerton, CA), according to the manufacturer’s protocol. Sub-sequently, the three purified amplicons were (equimolar) mixed and processed using the customized Nextera XT protocol (McElhoeet al.2014). The library of a random subset of the samples was analyzed using a Bioanalyzer 2100 High Sensitivity DNA chip (Agilent Technologies, Santa Clara, CA) to confirm quantity and size of the library. Libraries were indexed and 18 libraries were pooled per lane and analyzed on the HiSequa-tion 2000 system (Illumina, San Diego, CA), using a read length of 1000 bp. PhiX (1%) was spiked in every lane as an internal control.
Preprocessing of NGS data
coverage, which was defined as the total count of any nt at a certain position.
Identification of heteroplasmic de novo point mutations
A statistical algorithm was developed to distinguish variant calls from the noise signal, as well as to determine whether point mutations, either a single base substitution or a small insertion or deletion (indel), reported in an oocyte was absent in the corresponding femalefish, and thus arosede novo. A call from a sample is included in the analysis if its coverage is above the threshold, which is determined by calculating the median coverage for every position of the mtDNA genome, based on the coverage data of all 127 samples (Figure 1). Assuming sequencing quality is independent of the nt position, the median value is the most robust estimate of the coverage across the entire mtDNA genome. This implies that the lowest median cov-erage value is a robust estimate of the minimal reliable coverage and of the maximum background (noise) signal. As the lowest median coverage value was1700 (Figure 1A), this was chosen as a cut-off value for a position to be included in the analysis, preventing variants with lower coverage from influencing the statistical calculations we applied to exclude false positives.
For base substitutions, we discriminated false positives in the higher coverage group from true variants by comparing the percentage heteroplasmy of the variant nt of a particular sample with the average percentage heteroplasmy of all other samples (female tissues and oocytes, but without littermate oocytes and tissues from the mother). To this end, for each substitution, a probability distribution of the heteroplasmy values was generated (using all samples) and transformed to a Gaussian distribution using“a rank-transformation.”We as-sumed this distribution to be a representation of the noise signal for this variant, which is inherent to the NGS procedure (Guoet al.2013). Hence, we calculated az-score andP-value (one-tailed) and considered substitutions with a P-value # 0.01 as true variants, being statistically different from the noise signal. The check forde novosubstitutions was only performed for variants for which the coverage of the oocyte and of $2 tissues of its mother was $1700. Finally, a sub-stitution was assumedde novoif theP-value of this variant in the oocyte was #0.01, while in the tissues from the corre-sponding female theP-value was.0.01 (= absent or in noise signal) and if the heteroplasmy percentage was$1.0%.
As the sensitivity to identify small indels is at least twofold lower as for single nt substitutions (Krawitz et al. 2010; Neumanet al.2013; Senecaet al.2015), we only considered de novoindels with a coverage $3400 3. All suspectedde
novo indels were inspected manually, as the software tools used are known be less reliable than for the substitutions, using the Integrative Genomics Viewer (IGV) (Thorvaldsdottir et al.2013).
Estimation of mtDNA copy number and mutation rate
From the average heteroplasmy value (het-%) of allde novo variants within one mature oocyte, we estimated the mtDNA copy number at the time the mutation occurred. Under the assumption that heteroplasmy levels remain sta-ble during oogenesis, as observed in mice (Jenuth et al. 1996) and during stem cell culturing (Yamada et al. 2016), and that only one copy is mutated, the mtDNA copy number (z) at the time the mutation occurred can be cal-culated using:z= 100/het-%. Subsequently, we aimed to estimate the mutation rate. To do this, wefirst calculated for every oocyte the total number of detectable nt (y) that were present at the time the mutation arose. Therefore, we multiplied the estimated mtDNA copy number (z) with the number of nt that had coverage .1700: y = z * [#nt . 1700 coverage]. The mutation rate (x) was then calculated by dividing the number of de novomutations in an oocyte by the total number of analyzable nt:x= [#mu-tations detected]/y.
Data availability
The authors state that all detectedde novomutations resulting from their statistical analysis are presented within the article.
Results
We studied the occurrence of detectablede novomutations in 103 mature oocytes derived from eight different female zebrafish. No large deletions were observed, but we did de-tect significant numbers of point mutations. Of the 1,592,714 different nt positions that had a sequence coverage.1700, we identified 2624 different base substitutions, which were statistically different from the sequencing noise signal and absent in all three maternal tissues, and therefore considered as potentialde novomutations. To increase the reliability of our de novo base substitution detection, we applied three additional biological filter steps (Figure 1). (1) All oocyte variants for which the heteroplasmy level in one of the cor-responding maternal tissues was$1.0% were considered to be preexisting and were therefore excluded. (2) The hetero-plasmy level of the variants was corrected for the noise signal by subtracting the maternal (M) heteroplasmy level (= the average of the heteroplasmy level in the three maternal tis-sues) from the oocyte (O) heteroplasmy level (O-M), and variants with small O-M values (,1.5%) were excluded (205 variants had an O-M value of 1.0–1.5% and 929 variants of,1.0%). Thisfilter restricted our analysis tode novopoint mutations with a mutation load$1.5%. (3) Ade novovariant was rejected if, within the same oocyte, another variant was detected in the two nt adjacent (upstream or downstream) to this variant, as variants located in close proximity to each Table 1 Overview of samples collected
Zebrafish # 1 2 3 4 5 6 7 8
Biopsies 3 3 3 3 3 3 3 3
other are most likely the result of alignment artifacts (Li and Durbin 2009). By applying thesefilters, 38 single base sub-stitutions were considered to bede novo(Table 2), of which 36 were unique, as two mutations (m.7247T .G and m.10578C.A) were found in two oocytes isolated from the same zebrafish.
We also checked for the presence of smallde novoindels. We did identify three indels with a coverage.3400: one in oocyte 2.1 (m.7352insC, O-M het: 1.63%, coverage 5868), one in oocyte 5.10 (m.12323del, O-M het: 1.58%, coverage 3848), and one in oocyte 7.15 (m.11305del, O-M het: 2.41%, coverage 4689). Using IGV, we found that the insertion was only detected in ambiguous reads, while both deletions were only detected in duplicate reads. Therefore, these indels were most likely alignment artifacts and excluded from further analysis.
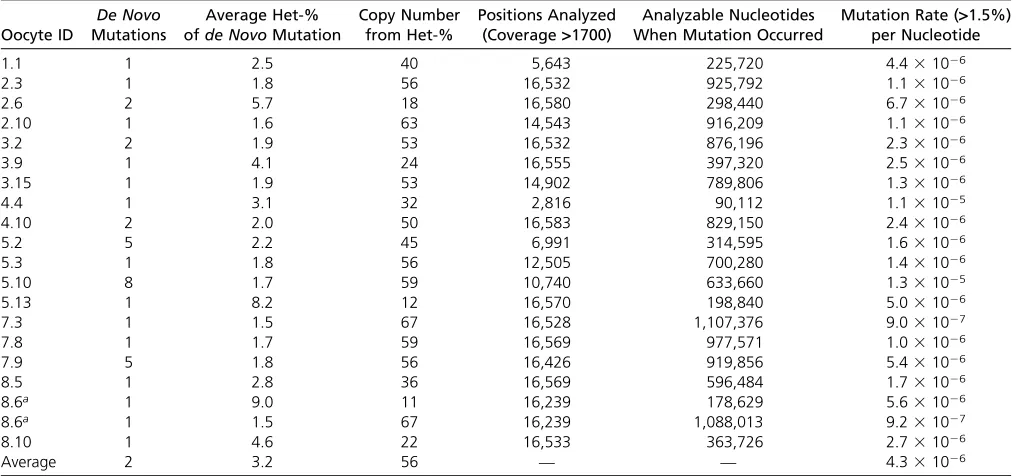
The 38de novomutations were detected in only 19 differ-ent oocytes (Table 2), indicating that the majority (82%) did not have a detectablede novomutation. In three oocytes (5.2, 5.10, and 7.9), more than three de novo mutations were found. Node novomutations were detected in any oocyte from zebrafish 6. The heteroplasmy level of all thede novo point mutations ranged from 1.5 to 9.0% with an average of 2.7%. For every mature oocyte with at least onede novomutation, we estimated the mtDNA copy number present at the time the mutation occurred. This number ranged from 18 to 67 (Table 3). Based on this, we calculated the mutation rate for these oocytes (Table 3). For most oocytes, this mutation rate was in the range of 1026mutations per nt, while oocytes
4.4, 5.10, and 7.3 had a higher mutation rate. On average, the mutation rate in these 19 oocytes was 4.331026
muta-tions per nt. Strikingly, for oocyte 8.6, the heteroplasmy val-ues of the two reported de novomutations greatly differed from each other, resulting in two different estimations of the mutation rate.
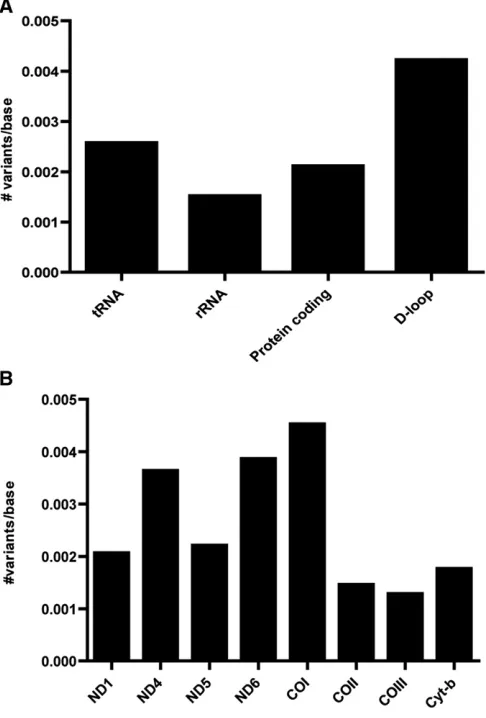
The number of unique de novo mutations per base was assessed for every gene (Figure 2). In case thede novo muta-tions were classified per gene function (tRNA genes, rRNA genes, protein coding, or D-loop separately), the prevalence of de novomutations appeared to be slightly higher in the D-loop (four variants per 1000 bases). 26 variants were in protein-coding genes (ND1, ND4, ND5, ND6, COI, COIII, and cyt-b), with little difference in the prevalence among the different protein-coding genes. Four of these mutations were synonymous and 22 nonsynonymous, including four mutations leading to a premature stop codon (Table 2).
Discussion
Robustness of identification of de novo mutations with heteroplasmy levels‡1.5%
statistics, this allowed the identification of those variants for which the heteroplasmy level was significantly different from the background (or noise) signal (P-value #0.01), thereby excluding variants with a high occurrence in all samples, something which was not expected. In a previous report, power calculations were used to estimate the reliability of the reads (Rebolledo-Jaramilloet al.2014). However, power calculations are theoretical and the use of such post hoc calculations for the interpretation of available experimental results is debatable (Hoenig and Heisey 2001). Another step in our analysis involves correction for the noise signal by subtracting the maternal heteroplasmy value from the detected heteroplasmy value. This correction is essential to determine the heteroplasmy value at which thede novo var-iant arose. A last step involved the exclusion of varvar-iants that most likely occurred as a result of alignment artifacts. Based on our and others’(McElhoeet al.2014; Rebolledo-Jaramillo
et al. 2014) experience with NGS, we excluded variants if they arose in close proximity to each other. Altogether, our data-driven statistical approach allows detection of de novo variants (heteroplasmy levels $1.5%) with high reliability, which is corrected for potential differences in quality be-tween sequence runs.
De novo mutations are detected in oocytes with a low mtDNA copy number
After applying statistical and biologicalfilters, we character-ized 38 de novobase substitutions with an average hetero-plasmy level of 2.7% in 19% of the oocytes. No large or small indels were detected in our analysis. Our analysis pipe-line allowed the detection of variants with a heteroplasmy value $1.5%, which equals detection of a single mutated mtDNA molecule in a population of 65 or less. The estimated mtDNA copy number at which ade novomutation occurred, Table 2 Heteroplasmic mtDNA base substitution mutations in all oocytes
Oocyte ID Corr. Het-% (O-M) Gene Location Nucleotide Change Amino Acid Change
1.1 2.5 ND1 m.4164C.A Ser.Stop
2.3 1.8 COI m.6489T.C Phe.Ser
2.6 5.4 D-loop m.250C.T —
2.6 5.9 COII m.8700G.A Val.Lys
2.10 1.6 COI m.6510T.A Val.Glu
3.2 3.3 D-loop m.283G.T —
3.2 1.9 ND5 m14296T.A Ile.Asn
3.9 4.1 tRNA-Trp m.6089G.A —
3.15 1.9 ND4L/ ND4 m.11303T.A Stop.Lys
Leu.Gln
4.4 3.1 D-loop m.1818A.T —
4.10 1.9 D-loop m.532G.A —
4.10 2.1 ND4 m.11708G.A Trp.Stop
5.2 2.7 ND1 m.4077G.A Trp.Stop
5.2 2.2 COI m.7112C.T Leu.Phe
5.2 1.6 COI m.7247T.G Trp.Gly
5.2 2.2 COI m.7574G.T Gly.Trp
5.2 2.2 COI m.7580G.A Val.Met
5.3 1.8 ND6 m.14894T.A Leu.Phe
5.10 1.6 12s rRNA m.1220A.G —
5.10 2.4 COI m.7112C.T Leu.Phe
5.10 2.1 COI m.7247T.G Trp.Gly
5.10 1.9 COI m.7253A.G Met.Val
5.10 1.8 COIII m.9909C.A Arg.Stop
5.10 1.6 ND4 m.11500G.C Val.Leu
5.10 1.5 tRNA-Leu m.12838T.G —
5.10 1.6 ND5 m.13472C.T Tyr.Tyr
5.13 8.2 ND6 m.14761G.A Leu.Leu
7.3 1.5 16s rRNA m.2632A.G —
7.8 1.7 16s rRNA m.2537A.G —
7.9 2.5 12s rRNA m.1550G.C —
7.9 1.8 ND4 m.12263T.G Leu.Arg
7.9 1.6 ND5 m.13205T.G Phe.Leu
7.9 1.6 CytB m.16232A.C Thr.Pro
7.9 1.5 CytB m.16324A.T Gly.Gly
8.5 2.8 ND5 m.14400C.T Leu.Leu
8.6 9.0 tRNA-Gly m.10578C.A —
8.6 1.5 ND4 m.12464G.T Trp.Leu
8.10 4.6 tRNA-Gly m.10578C.A —
ranged, based on the detected heteroplasmy levels of the mutations in the oocytes, from 11 to 67 (Table 2). In our analysis, we only detected an mtDNA mutation in 18.9% of the mature oocytes. The inheritance of the mtDNA through a bottleneck leads to low mtDNA levels in PGCs at the bottom of the bottleneck (Creeet al.2008), and a mutation originat-ing at this point may lead to higher heteroplasmy levels. In a previous study (Otten et al. 2016), we determined the mtDNA copy number in zebrafish PGCs isolated from several embryonic stages and found, on average, 171 mtDNA mole-cules at the bottom of the bottleneck, but with high variation in this number (SD = 111). Based on these parameters, we constructed a Gaussian distribution with mean 171 6 111 (SD). As 18.9% of the mature oocytes harbored ade novo mutation, this distribution allowed us to estimate that the lower 18.9% (left tail of the distribution, z-score –0.88) of the PGCs possess#72.8 mtDNA molecules. An mtDNA copy number of 72.8 corresponds to a heteroplasmy level at mu-tation manifesmu-tation of 1.4%, which is close to our detection limit of 1.5%. This means that our pipeline allows detection of de novo mutations in oocytes that were generated from germ cells with the lowest mtDNA content, which includes those germ cells most prone for acquiring ade novomutation reaching a detectable heteroplasmy of$1.5%, after mtDNA replication. Together, this implies that20% of the oocytes had a bottleneck size at whichde novomutations could reach detectable heteroplasmy levels ($1.5%). This also indicates that the oocytes (the other80%) with a higher mtDNA copy number will equally carry de novo point mutations with a
heteroplasmy level #1.5%, but the sensitivity at this level was too low for accurate mtDNA heteroplasmy analysis, which was in line with a recent study (Hammond et al. 2016). As the current noise level of sequencing is around 1% (Guo et al. 2013; Rebolledo-Jaramillo et al. 2014; Ma et al. 2015), further improvements of sequencing technolo-gies are needed to detect mtDNA point mutations in all oo-cytes, including those with a higher mtDNA copy number.
During oogenesis in zebrafish, the mtDNA of the PGC is replicated extensively. mtDNA replication is expected to occur almost exclusively by POLG (Copeland and Longley 2003; Kaguni 2004), which is a two-subunit holoenzyme with high
fidelity in nt selection and incorporation, alongside 39–59 exo-nuclease proofreading functionality (Kaguni 2004). For all ma-ture oocytes in which we detected a de novomutation, the calculated average mutation rate was 4.331026per nt. This
is in the same order of the reported POLG error frequencies, which range from 231026to 1031026per nt in different
animals (Kunkel and Mosbaugh 1989; Longleyet al. 2001). Although POLG has a high accuracy, this suggests that errors made by POLG during the extensive replication during oogen-esis are the main cause ofde novomutations detected in mature oocytes. The absence ofde novoindels is in line with a study in human germline mtDNA (Rebolledo-Jaramilloet al.2014) and suggests that the error rate of POLG for insertions and deletions is lower than for substitutions, which has been reported pre-viously (Longleyet al.2001).
Although replication errors are made continuously in all oocytes, only replication errors made when mtDNA copy Table 3 mtDNA copy number andde novomutation rate‡1.5% at a given nt for all oocytes in which at least onede novomutation was detected
Oocyte ID
De Novo Mutations
Average Het-% ofde NovoMutation
Copy Number from Het-%
Positions Analyzed (Coverage>1700)
Analyzable Nucleotides When Mutation Occurred
Mutation Rate (>1.5%) per Nucleotide
1.1 1 2.5 40 5,643 225,720 4.431026
2.3 1 1.8 56 16,532 925,792 1.131026
2.6 2 5.7 18 16,580 298,440 6.731026
2.10 1 1.6 63 14,543 916,209 1.131026
3.2 2 1.9 53 16,532 876,196 2.331026
3.9 1 4.1 24 16,555 397,320 2.531026
3.15 1 1.9 53 14,902 789,806 1.331026
4.4 1 3.1 32 2,816 90,112 1.131025
4.10 2 2.0 50 16,583 829,150 2.431026
5.2 5 2.2 45 6,991 314,595 1.631026
5.3 1 1.8 56 12,505 700,280 1.431026
5.10 8 1.7 59 10,740 633,660 1.331025
5.13 1 8.2 12 16,570 198,840 5.031026
7.3 1 1.5 67 16,528 1,107,376 9.031027
7.8 1 1.7 59 16,569 977,571 1.031026
7.9 5 1.8 56 16,426 919,856 5.431026
8.5 1 2.8 36 16,569 596,484 1.731026
8.6a 1 9.0 11 16,239 178,629 5.631026
8.6a 1 1.5 67 16,239 1,088,013 9.231027
8.10 1 4.6 22 16,533 363,726 2.731026
Average 2 3.2 56 — — 4.331026
ID, identifier;de novomutations, number ofde novomutations detected in the oocyte; average Het-% ofde novomutation, the average heteroplasmy value for allde novo
mutations found in the oocyte; copy number from Het-%, the copy number the oocytes had when the mutation occurred.
aThe heteroplasmy values of the variants in oocyte 8.6 differed markedly from each other, therefore the calculations were performed for both heteroplasmy values
numbers are low (e.g.,#65) lead to detectable (heteroplasmy levels of$1.5%)de novomutations in mature oocytes, which was likely the case in 19 of the oocytes. Four of these oocytes had a higher mutation rate (range of 1025). Although this
can be a chance event, this could also be a reflection of indi-vidual differences in error rates of the mtDNA replicative machinery, or due to another mutagenic source being active in these oocytes. During OXPHOS, which is highly active during oogenesis (Van Blerkom et al. 1995; Dumollard et al. 2007), mutagenic ROS are being produced and this could be a factor contributing to differences in the mutation rate between oocytes. However, based on the mutation rates in most oocytes, errors made by POLG are most likely the dominant source of de novo mtDNA mutations during oogenesis.
Our calculations on the mtDNA copy number and mutation rate are only applicable if random processes prevail and every mtDNA molecule is equally amplified. Studies in mice have suggested that heteroplasmy remains stable during oogenesis
(Jenuthet al.1996). However, due to genetic drift leading to loss orfixation of mutations, especially in small sample sizes, and preferential selection, mutation loads can shift. This could explain the high mtDNA mutation load for one of the twode novomutations detected in oocyte 8.6, although these mutations could also have manifested during separate repli-cation cycles, as an extremely low mtDNA bottleneck size creates multiple cycles at which the mutation can manifest at heteroplasmy levels $1.5%. Negative and positive selec-tion has been demonstrated for some specific mutations (Steffann et al.2015), further corroborating the possibility that nonrandom processes also influence the heteroplasmy levels ofde novomtDNA mutations. In the case of selection, the physical and effective bottleneck sizes are different. The mtDNA molecules that actively replicate determine the effec-tive bottleneck size, which can be lower than the physical bottleneck size when selective events result in only a sub-population of mtDNA molecules being more actively repli-cated. The mtDNA copy number that we have estimated here based on the heteroplasmy levels (11–67) correspond to effective mtDNA copy numbers, and might therefore be an underestimation of the physical bottleneck size.
De novo mutations in oocytes are potentially pathogenic
The 38de novomutations with a frequency of.1.5% were randomly distributed over the mtDNA genome. After correc-tion for the size of the gene, the tRNA-Leu, tRNA-Trp, and tRNA-Glygenes had a high number of mutations per nt. How-ever, the numbers were too low to estimate this correctly (only one mutation in the tRNA-Leu and tRNA-Trp genes were observed, and two mutations in the tRNA-Gly gene) and mutations occurred in two oocytes from the same
zebra-fish. Furthermore, the tRNA genes as a group do not support a higher prevalence of mutations in the tRNA genes. The ob-served higher prevalence in the three tRNA genes is most likely due to the relatively small group ofde novomutations. On the contrary, a higher prevalence for mutations in the D-loop exists (Figure 2A). This is corroborated by the many variants observed in this mitochondrial control region (Chinneryet al.1999). Although preferences for the D-loop might exist from an evolutionary perspective, mutations in the mtDNA can arise anywhere in the mtDNA genome. In total, eight protein-coding genes were affected with little differences in the prevalence. Twenty-two mutations were nonsynonymous, including four mutations leading to a pre-mature stop codon. No differences in prevalence in one of the three codon positions were found. This indicates that the effect of a de novomutation can be of any kind. The non-synonymous mutations, especially those causing a premature stop codon, are likely pathogenic, implying that these severe mutations, which are rarely found in human patients, can also occurde novo. Most likely in humans, these pathogenic mutations arefiltered out by mitophagy (Songet al.2014) or are at high levels not compatible with embryonic survival and remain unnoticed at low levels.
Given the high sequence homology (72%; NCBI blast performed) between the mtDNA genome of zebrafish and humans and the high evolutionary conservation of the mtDNA bottleneck in animal species (Wolff et al. 2011; Guoet al. 2013; Otten and Smeets 2015; Ottenet al.2016), our results indicate that thede novorisk might be similar among
zebra-fish and humans. Indeed, a study in 26 human oocytes (Jacobs et al.2007), seven oocytes (26.9%) were found to harbor de novo variants. This is close to the frequency of 18.9% we report here for zebrafish. This is further corrobo-rated by a similar degree of variation in mtDNA copy number in human oocytes (Otten and Smeets 2015), which suggests variation in the mtDNA bottleneck size and subsequent dif-ferences in thede novorisk. In humans, it has been estimated that about 5% of the mutations in the mtDNA alter a con-served nt and are thus potentially pathogenic (Jacobset al. 2007). As we found de novo mutations in 20% of the oocytes, this implies that1% of oocytes will carry a patho-genicde novomutation (with a heteroplasmy level$1.5%). The presence of low-level mtDNA mutations in the oocyte could, after fertilization, lead to mtDNA disease later in life due to genetic drift, which could lead to fixation of the mutation (Greaves et al. 2014; Yin et al. 2015), or in the offspring of the following generation, as inheritance through the mtDNA bottleneck can cause shifts in the heteroplasmy level between mother and child, also leading tofixation of the mutant mtDNA (Bloket al.1997).
Despite the described similarities between zebrafish and humans, important reproductive and mtDNA differences should be taken into account. Zebrafish oocytes (Otten et al.2016) possess a much higher absolute mtDNA content compared to human oocytes (Duranet al.2011; Murakoshi et al.2013) (factor 100), mostly due to different implantation patterns. In humans, implantation occurs rapidly (Wimsatt 1975), allowing a fast shift to the uterus for energy supply, while in zebrafish implantation is absent and energy must be supplied by the embryo itself. This lower mtDNA copy num-ber in human oocytes might result in lower mtDNA numnum-bers at the bottom of the bottleneck, and the mtDNA genome might even be at higher risk for ade novomutation to reach detectable heteroplasmy levels. This is supported by the high mutation frequency reported for the mammalian mtDNA compared to other animals, includingfish (Lynch 2006). In conclusion, our study in zebrafish has revealed that replica-tion errors made during oogenesis are an important source of de novomtDNA mutations, and that their location and hetero-plasmy determine the eventual significance.
Acknowledgments
We thank Marie Winandy and Hélène Pendeville from the Zebrafish facility of Liège University for their assistance in collecting the zebrafish material. This work was supported by the Interreg IV program of the European Council (the Alma in Silico project to M.M. and H.J.M.S.) and the Euro-pean Research Area Network for Research Programmes on
Rare Diseases 2 project GENOMIT (grant R 50.02.12F to M.M.). Part of this work has been made possible with the support of the Dutch Province of Limburg (M.A., M.G., and H.J.M.S.).
Literature Cited
Barr, C. M., M. Neiman, and D. R. Taylor, 2005 Inheritance and recombination of mitochondrial genomes in plants, fungi and animals. New Phytol. 168: 39–50.
Blok, R. B., D. A. Gook, D. R. Thorburn, and H. H. Dahl, 1997 Skewed segregation of the mtDNA nt 8993 (T/G) mu-tation in human oocytes. Am. J. Hum. Genet. 60: 1495–1501. Brand, M. D., 2010 The sites and topology of mitochondrial
super-oxide production. Exp. Gerontol. 45: 466–472.
Broughton, R. E., J. E. Milam, and B. A. Roe, 2001 The complete sequence of the zebrafish (Danio rerio) mitochondrial genome and evolutionary patterns in vertebrate mitochondrial DNA. Genome Res. 11: 1958–1967.
Chinnery, P. F., N. Howell, R. M. Andrews, and D. M. Turnbull, 1999 Mitochondrial DNA analysis: polymorphisms and patho-genicity. J. Med. Genet. 36: 505–510.
Copeland, W. C., and M. J. Longley, 2003 DNA polymerase gamma in mitochondrial DNA replication and repair. Scientifi c-WorldJournal 3: 34–44.
Cree, L. M., D. C. Samuels, S. C. de Sousa Lopes, H. K. Rajasimha, P. Wonnapinij et al., 2008 A reduction of mitochondrial DNA molecules during embryogenesis explains the rapid segregation of genotypes. Nat. Genet. 40: 249–254.
Dumollard, R., M. Duchen, and J. Carroll, 2007 The role of mito-chondrial function in the oocyte and embryo. Curr. Top. Dev. Biol. 77: 21–49.
Duran, H. E., F. Simsek-Duran, S. C. Oehninger, H. W. Jones, Jr., and F. J. Castora, 2011 The association of reproductive senes-cence with mitochondrial quantity, function, and DNA integrity in human oocytes at different stages of maturation. Fertil. Steril. 96: 384–388.
Greaves, L. C., M. Nooteboom, J. L. Elson, H. A. Tuppen, G. A. Tayloret al., 2014 Clonal expansion of early to mid-life mito-chondrial DNA point mutations drives mitomito-chondrial dysfunction during human ageing. PLoS Genet. 10: e1004620.
Guo, Y., C. I. Li, Q. Sheng, J. F. Winther, Q. Caiet al., 2013 Very low-level heteroplasmy mtDNA variations are inherited in humans. J. Genet. Genomics 40: 607–615.
Hammond, E. R., M. P. Green, A. N. Shelling, M. C. Berg, J. C. Peek et al., 2016 Oocyte mitochondrial deletions and heteroplasmy in a bovine model of ageing and ovarian stimulation. Mol. Hum. Reprod. 22: 261–271.
Hellebrekers, D. M., R. Wolfe, A. T. Hendrickx, I. F. de Coo, C. E. de Die et al., 2012 PGD and heteroplasmic mitochondrial DNA point mutations: a systematic review estimating the chance of healthy offspring. Hum. Reprod. Update 18: 341–349. Hoenig, J. M., and D. M. Heisey, 2001 The abuse of power the
pervasive fallacy of power calculations for data analysis. Am. Stat 55: 19–24.
Kaguni, L. S., 2004 DNA polymerase gamma, the mitochondrial replicase. Annu. Rev. Biochem. 73: 293–320.
Kimmel, C. B., W. W. Ballard, S. R. Kimmel, B. Ullmann, and T. F. Schilling, 1995 Stages of embryonic development of the zebra-fish. Dev. Dyn. 203: 253–310.
Krawitz, P., C. Rodelsperger, M. Jager, L. Jostins, S. Baueret al., 2010 Microindel detection in short-read sequence data. Bio-informatics 26: 722–729.
Kunkel, T. A., and D. W. Mosbaugh, 1989 Exonucleolytic proof-reading by a mammalian DNA polymerase. Biochemistry 28: 988–995.
Lee, H. S., H. Ma, R. C. Juanes, M. Tachibana, M. Sparmanet al., 2012 Rapid mitochondrial DNA segregation in primate preim-plantation embryos precedes somatic and germline bottleneck. Cell Reports 1: 506–515.
Li, H., and R. Durbin, 2009 Fast and accurate short read alignment with Burrows-Wheeler transform. Bioinformatics 25: 1754–1760. Li, H., and R. Durbin, 2010 Fast and accurate long-read alignment with Burrows-Wheeler transform. Bioinformatics 26: 589–595. Longley, M. J., D. Nguyen, T. A. Kunkel, and W. C. Copeland,
2001 The fidelity of human DNA polymerase gamma with and without exonucleolytic proofreading and the p55 accessory subunit. J. Biol. Chem. 276: 38555–38562.
Lynch, M., 2006 The origins of eukaryotic gene structure. Mol. Biol. Evol. 23: 450–468.
Lynch, M., B. Koskella, and S. Schaack, 2006 Mutation pressure and the evolution of organelle genomic architecture. Science 311: 1727–1730.
Ma, J., H. Purcell, L. Showalter, and K. M. Aagaard, 2015 Mitochondrial DNA sequence variation is largely conserved at birth with rare de novo mutations in neonates. Am. J. Obstet. Gynecol. 212: 530.e1–8.
McElhoe, J. A., M. M. Holland, K. D. Makova, M. S. Su, I. M. Paul et al., 2014 Development and assessment of an optimized next-generation DNA sequencing approach for the mtgenome using the Illumina MiSeq. Forensic Sci. Int. Genet. 13: 20–29. Murakoshi, Y., K. Sueoka, K. Takahashi, S. Sato, T. Sakuraiet al.,
2013 Embryo developmental capability and pregnancy outcome are related to the mitochondrial DNA copy number and ooplasmic volume. J. Assist. Reprod. Genet. 30: 1367–1375.
Neuman, J. A., O. Isakov, and N. Shomron, 2013 Analysis of in-sertion-deletion from deep-sequencing data: software evalua-tion for optimal detecevalua-tion. Brief. Bioinform. 14: 46–55. Otten, A. B., and H. J. Smeets, 2015 Evolutionary defined role of
the mitochondrial DNA in fertility, disease and ageing. Hum. Reprod. Update 21: 671–689.
Otten, A. B., T. E. Theunissen, J. G. Derhaag, E. H. Lambrichs, I. B. Boestenet al., 2016 Differences in strength and timing of the
mtDNA bottleneck between zebrafish germline and non-germ-line cells. Cell Reports 16: 622–630.
Rebolledo-Jaramillo, B., M. S. Su, N. Stoler, J. A. McElhoe, B. Dickins et al., 2014 Maternal age effect and severe germ-line bottleneck in the inheritance of human mitochondrial DNA. Proc. Natl. Acad. Sci. USA 111: 15474–15479.
Sallevelt, S. C., C. E. de Die-Smulders, A. T. Hendrickx, D. M. Hellebrekers, I. F. de Cooet al., 2016 De novo mtDNA point mutations are common and have a low recurrence risk. J. Med. Genet.DOI: 10.1136/jmedgenet-2016-103876.
Seneca, S., K. Vancampenhout, R. Van Coster, J. Smet, W. Lissens et al., 2015 Analysis of the whole mitochondrial genome: translation of the Ion Torrent Personal Genome machine system to the diagnostic bench? Eur. J. Hum. Genet. 23: 41–48.
Song, W. H., J. W. Ballard, Y. J. Yi, and P. Sutovsky, 2014 Regulation of mitochondrial genome inheritance by autophagy and ubiquitin-proteasome system: implications for health, fitness, and fertility. BioMed Res. Int. 2014: 981867.
Steffann, J., S. Monnot, and J. P. Bonnefont, 2015 mtDNA mutations variously impact mtDNA maintenance throughout the human em-bryofetal development. Clin. Genet. 88: 416–424.
Taylor, R. W., and D. M. Turnbull, 2005 Mitochondrial DNA mu-tations in human disease. Nat. Rev. Genet. 6: 389–402. Thorvaldsdottir, H., J. T. Robinson, and J. P. Mesirov, 2013 Integrative
Genomics Viewer (IGV): high-performance genomics data visualization and exploration. Brief. Bioinform. 14: 178– 192.
Van Blerkom, J., P. W. Davis, and J. Lee, 1995 ATP content of human oocytes and developmental potential and outcome after in-vitro fertilization and embryo transfer. Hum. Reprod. 10: 415–424.
Wimsatt, W. A., 1975 Some comparative aspects of implantation. Biol. Reprod. 12: 1–40.
Wolff, J. N., D. J. White, M. Woodhams, H. E. White, and N. J. Gemmell, 2011 The strength and timing of the mitochondrial bottleneck in salmon suggests a conserved mechanism in verte-brates. PLoS One 6: e20522.
Yamada, M., V. Emmanuele, M. J. Sanchez-Quintero, B. Sun, G. Lalloset al., 2016 Genetic drift can compromise mitochondrial replacement by nuclear transfer in human oocytes. Cell Stem Cell 18: 749–754.
Yin, A. H., C. F. Peng, X. Zhao, B. A. Caughey, J. X. Yang et al., 2015 Noninvasive detection of fetal subchromosomal abnor-malities by semiconductor sequencing of maternal plasma DNA. Proc. Natl. Acad. Sci. USA 112: 14670–14675.