ABSTRACT
PAN, QIN. Interface Engineering of Graphene/Polymer Conductive Composites and Their Application in Energy Storage. (Under the direction of Dr. Wei Gao).
Conductive polymer composites (CPCs) with high electrical/ionic conductivity and polymeric flexibility have received tremendous attention in recent years due to their widespread applications in flexible electronics. A variety of conductive fillers such as metal particles and carbonaceous materials have been studied. Among them, graphene as a monolayer of sp2-hybridized carbon atoms arranged in a honeycomb structure has been demonstrated as an ideal filler due to its excellent electrical conductivity (~106 S cm-1), mechanical strength, and flexibility. Moreover, owing to its high surface area (theoretically 2630 m2 g-1) and active electrochemical properties, graphene-based CPCs have shown promising applications in flexible energy-storage devices. The underlying polymer matrices, especially textiles or nonwovens based on fibrous building blocks can further benefit wearable energy-storage applications. Graphene can be integrated into textiles via two general routes: 1) direct coating graphene onto fiber/textile surfaces, 2) mixing graphene flakes in polymer solutions/melt followed by fiber extrusion and spinning. Many researchers have demonstrated relevant treatments to deliver conductivity and energy-storage performance on fabric-like structures, but few of them have provided detailed discussions on the structural role of textile framework in relation to the resulted properties.
chemical reduction. Water-based GO dispersion was used to coat the hydrophilic nylon nonwovens. The process, structure and conductivity of G/nylon have been carefully studied. The nonwoven with smaller fiber diameter (𝜙) showed higher conductivity due to more conductive contacts within unit area. The G/nylon (𝜙 = 3.2 𝜇m) showed an ultra-low percolation threshold of 0.005 wt%, because the nonwoven acting as the pre-constructed network provided a more efficient way to utilize graphene. Theoretical modeling was conducted by Geodict, showing good consistency with experimental results. Similar with G/nylon, G/PP was prepared in the similar processes, except for replacing GO/water dispersion with GO/DMF dispersion based on its wetting behavior. A comprehensive study of the wetting, surface treatment, and the resulted properties of PP nonwoven has been conducted. PP nonwoven can overcome the surface tension of GO/DMF dispersions, leading to direct coating without pre-treatment such as plasma and ozone. The G/PP nonwoven also offers high conductivity of 35.6 S m-1 at the graphene loading of 5.2 wt%, highest among the existing conductive PP systems reported in literature.
Interface Engineering of Graphene/Polymer Conductive Composites and Their Application in Energy Storage
by Qin Pan
A dissertation submitted to the Graduate Faculty of North Carolina State University
in partial fulfillment of the requirements for the degree of
Doctor of Philosophy
Fiber and Polymer Science
Raleigh, North Carolina 2018
APPROVED BY:
_______________________________ _______________________________
Wei Gao Eunkyoung Shim
Committee Chair
_______________________________ _______________________________
BIOGRAPHY
ACKNOWLEDGMENTS
Here I would like to express my deepest gratitude to my advisor, Dr. Wei Gao, for her guidance through my Ph.D. study. She not only gave me insightful advice on research, but also shared precious life and career experience with me. I’m also great thankful to Dr. Eunkyoung
Shim, for all her efforts to keep our first NWI project focused and moving forward. Many thanks to the rest of my committee members, Dr. Behnam Pourdeyhimi and Dr. Gregory Parsons, for their inspiring comments that incent me to widen and deepen my research.
My sincere thanks go to the Nonwoven Institute, for the funding support and providing me invaluable opportunities to gain leadership experience. Additionally, thanks to all faculty and staff in College of Textiles, for their wonderful lectures and detailed experiment training. I also appreciate the help from Mr. Charles Mooney and Dr. Ching-Chang Chung at AIF, for their support in materials analysis and characterization.
I’m immensely grateful to all my labmates, Nanfei He, Yixin Liu, and Ningjun Tong,
for their generous help in countless ways. Thanks to all my friends, near and far, for always standing by my side.
Finally, infinite thanks to my whole family. My mother Ying Huang and my father Yadong Pan, who always understand my decisions, tolerate me for everything, and selflessly support me throughout my life. Forever love to my husband Yufei Chen, who encourages me
TABLE OF CONTENTS
LIST OF TABLES ... viii
LIST OF FIGURES ... x
CHAPTER 1: AN OVERVIEW OF CONDUCTIVE GRAPHENE/POLYMER COMPOSITES ... 1
1.1 Graphene Oxide and Graphene ... 2
1.1.1 Synthesis of Graphene Oxide ... 2
1.1.2 Chemical Structure of GO ... 5
1.1.3 Reduction of GO to Graphene ... 7
1.2 Graphene/Polymer Composites via Coating and Their Applications ... 9
1.2.1 Coating GO onto Hydrophilic Polymer Surfaces ... 9
1.2.2 Coating GO onto Hydrophobic Polymer Surfaces ... 15
1.2.3 Applications of Graphene-Coated Polymer Composites ... 19
1.3 Electrospun Graphene/Polymer Mats and Their Applications ... 22
1.3.1 Preparation and Properties of Graphene/Polyvinyl Alcohol Electrospun Mats ... 23
1.3.2 Applications of GO/PVA Electrospun Composite Mats ... 30
1.3.3 Other GO/Polymer Electrospun Mats and Their Application in Energy Storage .. 33
1.4 Compounding of Graphene/Polymer Composites ... 38
1.4.1 Melt Compounding ... 38
1.4.2 Solution Compounding ... 45
1.5 Summary ... 52
CHAPTER 2: RESEARCH OBJECTIVES AND DISSERTATION OUTLINE ... 53
2.2 Conductive Graphene/Polymer Composites via Coating and Compounding ... 54
2.3 Graphene-coated Nonwovens as Energy-storage Textiles ... 55
2.4 Electrospun Mat of Polyvinyl Alcohol/Graphene Oxide as Solid-State Electrolyte with Superior Performance ... 55
CHAPTER 3: THERMAL DECOMPOSITION OF GRAPHENE OXIDE IN AIR VIA IN-SITU X-RAY DIFFRACTION ANALYSIS ... 57
3.1 Introduction ... 57
3.2 Experimental Methods ... 59
3.2.1 Preparation of GO Powder and Film ... 59
3.2.2 Analytical Instrumentation ... 60
3.3. Results and Discussion ... 60
3.3.1 In-situ X-ray Analysis of Thermal Decomposition Kinetics ... 60
3.3.2 Effect of Atmosphere ... 65
3.3.3 Effect of Morphology ... 67
3.4 Conclusion ... 71
CHAPTER 4: CONDUCTIVE GRAPHENE/POLYMER COMPOSITES VIA COATING AND COMPOUNDING ... 73
4.1 Introduction ... 73
4.2 Experiments ... 76
4.2.1 Preparation of Nylon and Polypropylene Nonwovens ... 76
4.2.2 Preparation of Graphene Coated Nylon and Polypropylene Nonwoven ... 76
4.2.3 Preparation of Graphite/PP Composites by Compounding ... 77
4.3 Results and Discussion ... 81
4.3.1 Graphene/Nylon Nonwoven Composites as Highly Conductive Fabrics ... 81
4.3.2 Modeling of Graphene/Nylon Conductive Nonwoven ... 88
4.3.3 Interface Engineering of Graphene/PP Nonwoven for High Conductivity ... 94
4.3.4 Compounding of Graphite/PP Composites ... 103
4.4 Conclusion ... 109
CHAPTER 5: GRAPHENE COATED NONWOVENS AS ENERGY STORAGE TEXTILES ... 111
5.1 Introduction ... 111
5.2 Experiments ... 114
5.2.1 Preparation of Monolithic Supercapacitors on GO-coated Nonwovens... 114
5.2.2 Materials Characterization ... 115
5.3 Results and Discussion ... 117
5.3.1 Fabrication and The Electrochemical Performance of GO/nylon Monolithic Supercapacitors ... 117
5.3.2 Laser-writing of Monolithic Supercapacitors on GO/PP Nonwoven ... 126
5.4 Conclusion ... 128
CHAPTER 6: ELECTROSPUN MAT OF POLYVINYL ALCOHOL/GRAPHENE OXIDE AS SOLID-STATE ELECTROLYTE ... 130
6.1 Introduction ... 130
6.2 Experiments ... 133
6.2.1 Preparation of GO/PVA Solution and Electrospinning ... 133
6.2.3 Materials Characterization ... 134
6.2.4 Electrochemical Characterization ... 135
6.3 Results and Discussion ... 136
6.3.1 Fabrication of GO/PVA Electrospun Mat for Monolithic Supercapacitors ... 136
6.3.2 Chemical Structure ... 139
6.3.3 Evolution of Electrolyte Performance of GO/PVA Mat ... 140
6.3.4 Advantages of Electrospun Mat Structure ... 146
6.4 Conclusion ... 149
CHAPTER 7: RECOMMENDED FUTURE WORK ... 150
LIST OF TABLES
Table 1 Comparison in reduction protocols of GO. . ... 8 Table 2 Surface free energies (SFE) for common polymers (adapted from [51]). ... 17 Table 3 Ionic conductivities of PAN and PMMA electrospun mats as a function of
graphene concentration (adapt from ref [71]). ... 34 Table 4 Physical and electrochemical parameters of PP membrane, electrospun mats
of PAN, and PAN/GO as the separator in Li-S battery (adapted from ref [72]). . 35 Table 5 Spinning parameters and properties of produced bicomponent yarns (adapted
from ref [79]). ... 43 Table 6 Properties of graphene/PP nanocomposites with various graphene loadings
(adapted from ref [83]). ... 51 Table 7 Specifications for PP and graphite. ... 78 Table 8 Basic information of the three nylon melt-blown nonwovens. . ... 90 Table 9 The conductivity of G/nylon with different fiber diameters based on the
ElectroDict module of the Geodict software. ... 93
Table 10 Crystallization temperature and crystallinity of PP and graphite/PP
composites. ... 106 Table 11 Avrami exponent and crystallization rate constant of PP and graphite/PP
composites. . ... 107 Table 12 Interlayer distance and crystal size of PP and graphite/PP composites. ... 108 Table 13 Fitting results for the Nyquist plots in Figure 54 (b) with the equivalent
LIST OF FIGURES
Figure 1 Schematic illustration of the modified Hummers method. Inset picture: the photographic image of the obtained GO dispersion in deionized (DI) water (left) and after reduced by hydrazine with ammonia (right) (adapted from ref [18]). ... 3 Figure 2 A comparison of procedures and yields among different preparation methods
of GO, including Hummers, modified Hummers and Tour method (referred as improved in this figure) (adapted from ref [19]). ... 4 Figure 3 Proposed structure models for GO (adapted from ref [12]). ... 7 Figure 4 Schematic for the fabrication of reduced GO (rGO)-coated PET nonwoven
fabrics (a). Change in the surface conductivity of the composite fabrics with the increase in the weight fraction of rGO (b). The insets display SEM images of the composite fabrics prepared at rGO fractions of 0.001 (I), 0.030 (II) and 0.080 wt% (III) (adapt from ref [38]). ... 11 Figure 5 Coating graphene nanosheets onto porous textiles. a) Photograph of
graphene-coated conductive PET textile. (b) AFM image of graphene nanosheets deposited on a SiO2/Si substrate and the corresponding line scan profiles. (c) Typical TEM image of graphene nanosheets. (d) Sheet resistances Rs versus the number of dipping cycle for graphene-coated fabric sheets (G-textile) with and without nitric acid treatment. (e) SEM image of a sheet of graphene-coated textile. (f) High-magnification SEM image on the region
Figure 6 Graphite mass as a percentage of initial fabric mass for PET staple fiber nonwovens coated with EGF and GO dispersions (a). Mass loading also shown for GO coated samples after reduction to rGO. (b) IPR of PET
nonwovens coated with GO and after reduction to rGO. IPR (c) and TPR (d) of PET nonwovens coated with rGO and EGF (adapted from ref [42]). ... 14 Figure 7 Schematic illustration of coating graphene onto PP separator used in Li-S
battery (adapted from ref [47]). ... 16 Figure 8 Engineering of 3D interdigitated micro-supercapacitors with high energy
density. (A-C) Illustration of the fabrication process for an asymmetric micro-supercapacitor based on laser scribed graphene (LSG)/MnO2 composites as the positive electrode and LSG as the negative electrode (adapt from ref [54]). ... 20 Figure 9 Fabrication of compressible polymer/PU composite foams for adjustable ... 21 Figure 10 Strain sensors used to monitor health. (a) Photographs of a strain sensor
attached onto forearm like a tattoo. The insets are SEM images for top view and cross view of the sensor. (b) Real-time monitoring of human motion by detecting resistance change on finger movement (adapted from ref [59]). ... 22 Figure 11 Electrospinning diagram. Diagram by Joanna Gatford at The New Zealand
Institute for Plant and Food Research Ltd (adapted from [63]). ... 23 Figure 12 The variation of voltages with time during the electrospinning (a). (b)
Figure 13 SEM images of electrospun 0.5 wt% graphene/PVA mat (a). The fibers were bead-free and the observed fiber diameters ranged from 0.7 to 1 μm. (b) HRTEM images of a single graphene/PVA/PVP fiber. Since the lateral dimension of graphene is comparable to the fiber diameter, the graphene
occasionally protrudes out of the PVA fiber (adapted from ref [65]). ... 26 Figure 14 Effects of graphene concentration on (a) solution viscosity and (b) solution
conductivity at 25°C. (c) fiber diameter versus graphene content of
graphene/PVA nanofiber. (d) TEM images of electrospun PVA nanofibers filled with 1 wt% of graphene (adapted from ref [66]). ... 28 Figure 15 TEM images of composite nanofibers: TiO2/PVA (a and b) and
TiO2/GO/PVA (c and d) (adapted from ref [67]). ... 29 Figure 16 Morphology and electrochemical performance of the PEDOT coated
GO/PVA electrospun mat (adapted from ref [68]). ... 31 Figure 17 SEM image of GO/PVA/Si as-spun nanofibers (a); (b) and (d)HRTEM
images of Si/CNF/graphene. (c) Cyclic performance of electrodes made from neat Si, CNF, Si/CNF, Si/CNF and Si/CNF/graphene at a current
density of 100 mA g-1 (adapted from ref [69]).. ... 32 Figure 18 Formazan absorption (at 490 nm) in MTT assay was expressed as a measure
of cell viability of MT3T3-E1cells seeded on the electrospun PVA and PVA/GO composite scaffolds with different GO contents for 24, 48, and 96 h (adapted from ref [70]). ... 33 Figure 19 SEM (a) and TEM (b) image of G/CNF electropsun mats. (c) Variation of the
performance of the G/CNF and CNF electrodes at a constant current density of 2.5 A g-1 (adapted from ref [73]). ... 36 Figure 20 TEM image (a), AC impedance measurements (b), rate capability(c) and
cycling performance (d) of graphene-embedded LTO nanofiber composites (adapted from ref [74]). ... 37 Figure 21 SEM images of fracture surface of 10 vol.% xGnP-15/PP composites made
by (a) melt mixing and (b) coating and melt mixing. (c) Effect of xGnP’s
loading on the electrical conductivity of xGnP/PP. (d) Comparison of the conductivity of xGnP-1/PP nanocomposites made with/without coating
(adapted from ref [77]). ... 39 Figure 22 Effect of the cooling rate on the electrical conductivity of xGnP/PP. FC
stands for fast cooling, and SC stands for slow cooling. xGnP-1 and xGnP-15 means the diameter for nanoplatelets is 1 μm and 15 μm,
respectively. Schematic of the microstructure of (b) slow cooled and (c) fast cooled xGnP/PP. The arrows indicate the formation of conductive network which can span across the whole sample in case of slow cooling (adapt from ref [78]). ... 41 Figure 23 Electrical conductivity as the function of the weight fraction filler for CB,
GNP + CB (ratio 1:1), and GNP in PP (a). (b) Storage modulus of different PP composites (adapted from ref [79]). ... 42 Figure 24 TGA and DTG thermograms (a), typical stress-strain curves (crosshead
graphene contents of 0.2, 0.5, 1.0, 1.5, 2.0, and 3.0 wt% (adapted from ref [80]). ... 44 Figure 25 Experimental setup and the procedure for preparing GnP/PP composites (a).
(b) SEM image of GnP/PP with graphene nanoplatelets loading of 5.0 wt%, with enlarged region shown in (d). (c) Resistivity of the GnP/PP as a
function of graphene loading (adapted from ref [81]). ... 47 Figure 26 2D WAXD patterns of neat PP (PPG0) and its graphene composites with
5 wt% and 10 wt% of graphene loading (PPG05 and PPG10 respectively) isothermally crystallized at 145 ℃ under quiescent conditions (adapted from ref [82]). ... 48 Figure 27 TEM (a) and SEM (c) images of the rGO/PP latex composite (0.2 vol% of
rGO). (b) Conductivity of the rGO/PP composites with different volume fraction of graphene as a function of frequency at room temperature. (d) Dielectric permittivity (ε') of the rGO/PP composites as a function of
graphene volume fraction, measured at 103 Hz and room temperature
(adapted from ref [51]). ... 50 Figure 28 Evolution of the (002) XRD peak of a free-standing GO film, during the
105 °C for 1 hour to remove all the intercalated water molecules, and finally increased to 350 °C at the ramping rate of 3 °C/min. ... 62 Figure 29 Structural changes during the thermal evolution from GO to graphene a)
schematics showing the interlayer-distance decrease in GO due to the removal of water and oxygenated groups upon heating from 25 °C to 350 °C; b) kinetics of the in-situ XRD data indicating the significant influences of atmosphere and sample morphology on the reaction rates and mechanisms of thermal decomposition at 150 °C. ... 65 Figure 30 Time-dependent evolution of the intensity of (002) diffraction peak in a
free-standing GO film at 150 °C in air and nitrogen atmosphere. All peak intensity was normalized with an external standard (the intensity of the same GO film measured at 25 °C as the standard)(a). Kinetic analysis of thermal evolution of GO film at 150 °C in air and nitrogen atmosphere (b). A good linear fit was achieved in the logarithm plot of the rate of intensity decrease vs. the intensity itself (𝑙𝑛(−𝑑𝑖𝑑𝑡)𝑣𝑠. 𝑙𝑛 𝑖) for both decomposition processes. 𝑛’ and 𝑘’ were obtained through the slopes and y-axis intercepts. ... 67 Figure 31 Kinetic analysis of thermal decomposition of GO powder and free-standing
GO film at 150 °C in air. (a) time-dependent evolution of the intensity of (002) diffraction peak throughout the entire process. Insets are photographic images of the as-made free-standing GO film and GO powders at 25°C for testing; (b) 𝑙𝑛 (−𝑑𝑖/𝑑𝑡) 𝑣𝑠. 𝑙𝑛 (𝑖) plots and the linear fittings of the data points in (a). The tested film and powder samples were from the same
Figure 32 Comparison of (a) Raman spectra, showing a bit lower D-to-G ratio of free-standing GO film (0.860) than that of GO powders (0.874); (b) FT-IR spectra, presenting bands around 1060 cm-1(
C-O), 1220 cm-1( phenolic), 1620 cm-1 ( HOH bending in water) and 1720 cm-1 ( C=O) for both GO free-standing film and powder. ... 71 Figure 33 Scheme of the four-probe set-up. ... 79 Figure 34 Geometrical component of a pendant drop. ... 80 Figure 35 SEM images of the nylon-6 nonwoven fabrics prepared via the melt blown
method at different air-flow rates of (a) 500, (b) 1000 and (c) 1500 m3 h-1,
respectively. ... 82 Figure 36 The correlation between the weight percentage of loaded GO and the cycle
number during the dip-coating process of the nylon-6 nonwoven fabrics with different fiber diameters of 3.2 μm (blue), 6.3 μm (yellow), and 10.5 μm
(pink). The concentration of GO in DI water dispersion was 0.5 wt%. ... 82 Figure 37 SEM images of G/nylon with different graphene mass loading of 0.1 wt.%
(a), 1.3 wt.% (b), 2.8 wt.% (c) and 6.5 wt.% (d). ... 84 Figure 38 Electrical conductivity of G/nylon composites as a function of weight
Figure 39 The effects of fiber diameter on the conductivity of G/nylon in machine
direction (MD) and transverse direction (TD). ... 89 Figure 40 Fiber orientation distribution of nylon nonwovens with different fiber
diameters, indicating fibers orientation was almost randomly but slightly
machine direction oriented. ... 90 Figure 41 The simulated structure of the nylon nonwoven with average fiber diameter
of (a) 3.2 μm, (b) 6.3 μm and (c) 10.5 μm. ... 91 Figure 42 SEM images of (a) region uncovered with graphene along the fiber. (d) large
graphene sheets formed at fiber-fiber contacts that bridge individual fibers. A morphology comparison between finer fiber and thick fiber at comparable graphene loading. (b) fiber diameter of 6.3 μm at 2.1 wt% loading, and (c) fiber diameter of 10.5 μm at 2.6 wt%. (e) fiber diameter of 6.3 μm at 5.3 wt% loading, and (f) fiber diameter of 10.5 μm at 5.6 wt%. ... 94 Figure 43 Correlation between the surface tension of GO/H2O dispersion and GO/DMF
dispersion with concentration (C, mg/mL) of GO (a). Photograph of (b) PP nonwoven before and after ozonation and (c) PP and ozonated PP (o-PP)
nonwoven coated with GO/H2O dispersion. ... 96 Figure 44 A photographic image of PP nonwoven coated with the GO/DMF dispersion
(a). SEM images of PP nonwoven with average fiber diameter of 3.3μm (b), G/PP with loading of 1.2 wt.% (c) and G/PP with loading of 5.2 wt.% (d). ... 98 Figure 45 Electrical conductivity of G/PP composites as a function of weight
electrical conductivity of G/PP before and after the wash in DI water with stirring for 10 minutes at 25 ℃. Data of G/PP with different loadings of 1.2
wt.%, 2.6 wt.%, 3 wt.% and 5.2 wt.% were presented (b). ... 100 Figure 46 FT-IR spectra of PP, GO/PP and G/PP (a). The inset showed the wider-range
spectra from 1000 cm-1 to 3800 cm-1. Load-strain curve for PP nonwoven, G/PP, G/PP, and o-PP in the tensile test (b). ... 102 Figure 47 Electrical conductivity of graphite/PP at different loading, indicating the
percolation threshold is ca. 30 wt%. (b) Comparison between the conductive G/PP nonwoven by coating (Chapter 4.3.2) and the graphite/PP by solution mixing. ... 103 Figure 48 SEM images of fractured cross-section of the graphite/PP film with 20 wt%
(a) and 50 wt% (b) of graphite. ... 104 Figure 49 TGA in nitrogen (a), DSC of the melting process (b), XRD patterns(c), DSC
of the crystallization process (d), Non-isothermal crystallization (e) and
isothermal crystallization of PP and graphite/PP composites (f). ... 105 Figure 50 Ragone plot for various electrical energy storage devices. If a supercapacitor
is used in an electric vehicle, the specific power shows how fast one can go, and the specific energy shows how far one can go on a single charge
(adapted from ref [160]). ... 112 Figure 51 Direct laser writing to fabricate GO/nylon supercapacitors with concentric
circular (CC) and sandwich geometry; (d) photograph of the all-solid-state GO/nylon supercapacitor with PVA-H2SO4 gel electrolyte and current
Figure 52 The equivalent circuit used for fitting the EIS spectra generated in the Z-view software. ... 116 Figure 53 Morphologies of GO/nylon supercapacitors via direct laser patterning:
photographs of (a) CC supercapacitor, with darker part as the LGO electrodes and grayish part as the GO/nylon separator and matrix, and (b) sandwich supercapacitor with LGO electrodes at both side of GO/nylon; SEM images of (c) the interface between LGO and GO on the surface of CC supercapacitor, and (d) the cross-sectional image of a sandwich
GO/nylon-based supercapacitor. ... 119 Figure 54 Electrochemical performance of the CC and sandwich supercapacitors in
aqueous electrolyte (1 M Na2SO4) and solid electrolyte (1 M H2SO4 in
10 wt.% PVA). (a) Cyclic voltammograms (CV) curves at the scan rate of
200 mV s-1; (b) Nyquist plots from 1 M Hz to 0.01 Hz; inset showed the zoom-in Nyquist plots at the high frequency domain for different devices in different electrolytes. ... 121 Figure 55 Kinetic analysis of the sandwich supercapacitor working in PVA-H2SO4. (a)
Overlapped CV curves at various scan rates from 10 to 1000 mV s-1. (b) A plot of areal capacitance vs. scan rate-1/2. The separation of diffusion-controlled region and capacitive-controlled region occurs at
~ 60 mV s-1, indicating excellent ion diffusion in GO/nylon
supercapacitors. ... 125 Figure 56 Comparison of areal capacitance density between our supercapacitors and
energy density versus power density of our supercapacitors, as compared with similar systems reported (data from ref [53, 171, 178-179]). * denotes the data converted from the reported values of volumetric density in the
corresponding references, based on the reported thickness. ... 126 Figure 57 Scheme of laser-patterning process to fabricate monolithic sandwich
supercapacitor on GO/PP nonwoven (a).Photograph of the directly laser-scribed GO/PP supercapacitor (b). Cyclic voltammograms (CV) curves at the scan rate of 40 mV s-1 in PVA-H2SO4 gel electrolyte (c). Nyquist plots from 1 M Hz to 0.01 Hz; inset showed the zoom-in Nyquist plots at the high frequency domain (d). ... 128 Figure 58 SEM images of (a) pure PVA, (b) GO/PVA (25:1, w/w), (c) GO/PVA (10:1,
w/w) electrospinning mat, with insets of their photographic images; (d) Cross-sectional SEM image of monolithic supercapacitor with sandwich geometry on GO/PVA mat; (e) Laser reduced GO (LGO) region; (f)
Photographic images of GO/PVA supercapacitors with concentric circular (CC) and sandwich geometries. ... 137 Figure 59 Schematic illustration of electrospinning of GO/PVA mat and the subsequent
fabrication of supercapacitors via laser patterning processes. ... 139 Figure 60 FT-IR spectra (a), Raman spectra (b) and X-ray diffraction pattern of
GO/PVA and PVA electrospun mats (c). Raman spectra of LGO and GO (d). After laser treatment Id/Ig increased from 0.88 to 0.93. ... 140 Figure 61 Evolution of device performance with GO/PVA-m and PVA-m over
Nyquist plots from 1 M Hz to 0.01 Hz, with insets showing the zoom-in region at the high frequency domain, for GO/PVA-m (a, b), and PVA-m (c, d). D means the number of storage days, e.g. D0 represents as-made. ... 141 Figure 62 The chronological evolution of charge-discharge profiles of the GO/PVA-m
supercapacitor from D0 (a), D1 (b), D3 (c) to D5 (d). D means the number of storage days, e.g. D0 represents as-made. ... 143 Figure 63 Nyquist plots from 1 M Hz to 0.01 Hz of GO/PVA-m, PVA-m, GO/PVA-f
and PVA-f upon saturated with 1 M H2SO4; inset showed the zoom-in region at the high frequency domain (a); the evolution of EIS spectra (b) and CV curves (c) of GO/PVA-f and PVA-f after 1-day storage; Cycling
performance of GO/PVA-m and GO/PVA-f at the current density of
1 mA cm-2(d). ... 147 Figure 64 The temperature distribution profile of CB/CL/PP (a), G/CL/PP (b), and
CHAPTER 1: AN OVERVIEW OF CONDUCTIVE
GRAPHENE/POLYMER COMPOSITES
Conducting polymers have received significant attention from both science and engineering communities ever since the invention of conductive polyacetylene in the 1970s. 1-2 This culminated in 2000 when the Nobel Prize in Chemistry was awarded to Alan J. Heeger, Alan G. MacDiarmid and Hideki Shirakawa for their discovery and development of electrically conductive polymers. As our society becomes more technologically advanced, the demands placed on polymers’ electrical capabilities are continuously growing and becoming more
challenging to satisfy. Technological applications for conductive polymers have evolved from the conventional static charge dissipation, electromagnetic interference shielding, corrosion inhibition etc., to the novel flexible electronics such as sensors, diodes, antennas and energy storage systems.3-6 Each of these applications requires polymer capable of offering high level of electrical/ionic conduction. In addition, this polymer would ideally retain the benefits associated with its polymeric nature: light weight, flexibility, toughness and ease in processing.
properties.7 Graphene, a monolayer of sp2-hybridized carbon atoms arranged into a honeycomb structure, was the key material in the 2010 Nobel Prize in Physics owing to its exceptional properties, including excellent electrical (~106 S cm-1) and thermal conductivity (~5000 W m -1 K-1), fast mobility of charge carriers (~200,000 cm2 Vs-1), high Young’s modulus (~1100 GPa), and large specific surface area (theoretically 2630 m2 g-1).8-11 Its oxidized form, GO with both sides of the basal plane attached with various oxygenated functional groups e.g. epoxy, hydroxyl, carbonyl and lactol groups, has been widely studied as an ideal precursor in fabricating graphene/polymer composites, by virtue of its scalability, wet-chemical processability, high chemical activity, and good dispersability in various solvents.12-14 Although electrically insulating, GO can be easily converted to graphene via a variety of recipes (both chemical and physical), leading to highly tunable electrical/ionic conductivity.15
In this chapter we will review the recent advances in conductive graphene/polymer composites, their preparation methods, properties, and a variety of applications mainly in energy-storage systems. The background information about GO and graphene is also briefly discussed.
1.1 Graphene Oxide and Graphene
1.1.1 Synthesis of Graphene Oxide
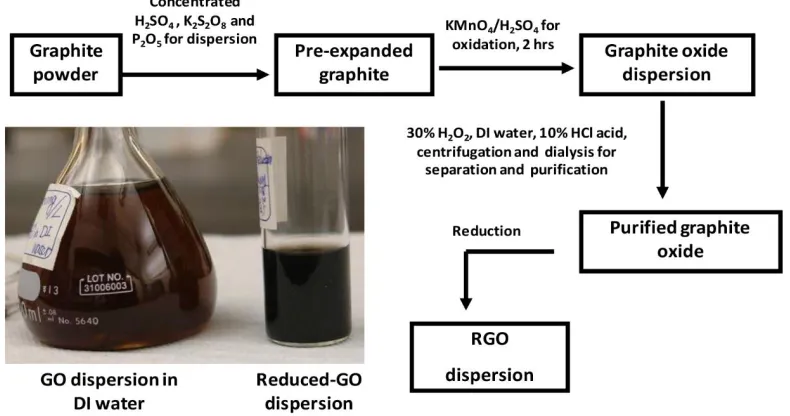
atomic ratio of C/O=2.25. However, the drawback of Hummers method is that the core of the resulted GO still remains graphite, thus Kovtyukhova introduced a pre-expansion process, which involves oxidizing graphite with concentrated H2SO4, K2S2O8, and P2O5 at 80 ℃ for several hours, later widely known as modified Hummers method.17 Figure 1 shows the whole process of the modified Hummers method. The morphology of the obtained GO is small flakes with the thickness of 1 nm (corresponding to a single layer) and the average lateral dimension of ca. 1 μm. Although the product shows a higher degree of oxidation, with chemical composition C:O:H =4:2.95:2.5, the purification process still remains time-consuming.
Figure 1 Schematic illustration of the modified Hummers method. Inset picture: the photographic image of the obtained GO dispersion in deionized (DI) water (left) and after reduced by hydrazine with ammonia (right) (adapted from ref [18]).
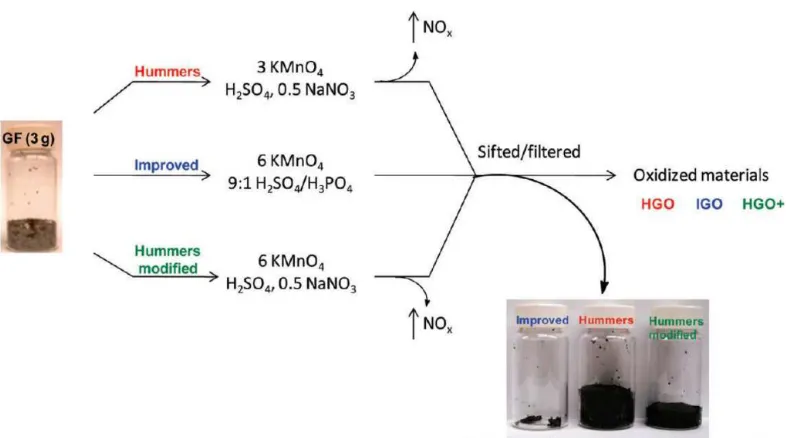
amount of KMnO4. The process occurs in an acidic environment with a mixture of H2SO4/H3PO4 with the ratio of 9:1, with the introduction of H3PO4 for more intact graphitic basal planes. Graphite reacts with six equivalents of KMnO4, leading to a higher degree of oxidation.19 Figure 2 compares the process of Hummers, modified Hummers, and Tour method to prepare GO and their efficiency of oxidization.
Figure 2 A comparison of procedures and yields among different preparation methods of GO, including Hummers, modified Hummers and Tour method (referred as improved in this figure) (adapted from ref [19]).
1.1.2 Chemical Structure of GO
The precise structure of GO has long been a topic for endless debate over the years, due to the complexity of the materials. GO is nonstoichiometric, with compositions varying from sample to sample. Despite this, scientists have used various characterizations to elucidate its structure. Spectroscopic analysis is one of the most widely used and powerful technique to characterize GO, including X-ray diffraction (XRD) analysis, solid state 13C NMR, Raman spectrum, X-ray photoelectron spectroscopy (XPS) analysis, etc.
XRD patterns of GO shows a broad peak (002) at around 11°, which can be influenced by moisture content and oxidation level of GO. For a one molecule-thick layer of water that is presumably hydrogen-bonded between the GO sheets, the d-spacing is about 8.3 Å.20 When exposed in high humidity, GO due to its hygroscopic nature, will absorb water molecules from air and intercalate them between layers via hydrogen bonding, leading to increased d-spacing. Besides, the reduction of GO will decrease the d-spacing due to the removal of oxygenated groups; however, the ozonated GO with higher oxidation level doesn’t show increased
d-spacing as expected.21 The interlayer distance of GO calculated based on the (002) peak can vary from 5.97 Å to 9.5 Å.12
Raman spectrum of GO displays two major peaks, D peak at ~1350 cm-1 corresponding to structural defects, and G peak at ~1594 cm-1 corresponding to graphitic domain vibration. The D/G ratio is around 0.95, indicating lots of defects in the graphitic plane.24-25 After reducing to graphene, the D/G ratio often increases due to more defects generated during the reduction process.
The XPS analysis of GO shows two typical broad peaks at around 284 and 286 eV, corresponding to graphite carbon and oxidized carbon respectively. Deconvolution of these peaks to analyze the quantitative relation between carbon at different oxidizing states has been reported, but due to semi-quantitative analysis nature of XPS analysis, the accuracy is limited.26-27
Microscopic analysis such as Atomic Force Microscopy (AFM), Scanning Electron Microscope (SEM) and Transmission Electron Microscopy (TEM) have been used to understand the morphology of GO. The thickness of the two-dimensional GO nanoflakes is around 1~2 nm in average, but the lateral dimensions can vary between several nanometers to microns. In addition, the surface of GO sheets is usually wrinkled with holes occasionally observed.28
Figure 3 Proposed structure models for GO (adapted from ref [12]).
1.1.3 Reduction of GO to Graphene
Unlike chemical reduction, thermal annealing is a scalable process to convert GO to graphene without additional reducing agents. GO decomposes easily upon heating, resulting in the loss of oxygenated groups, as well as carbon atoms from the graphite plane, leaving behind lattice defects throughout the sheet. Thermal annealing has various derivatives such as microwave and laser reduction, with unconventional heating source allowing heating process to occur more rapidly or in a precisely controlled/designed area. Table 1 compared several typical methods to convert GO and the properties of the resulted products.
Table 1 Comparison in reduction protocols of GO.
Electrical Conductivity (S cm-1)
C/O
ratio Raman (cm
-1)
XRD (d-spacing, nm)
XPS (eV)
GO [23, 26] 5.3×10⁻⁶ 2.7 1594(G)
1363(D) 0.63~1.2
284.8 (C-C) 286.2 (C-O) 287.8 (C=O) 289.0 (C(O)-O)
Pure NH2NH2 [29]
108-fold higher
than GO /
1600 (G) 1350 (D) 2700 (2D) 2950 (D+G) D/G increase
/ 284.5
HI/HAc [30]
3.04×10²,
7.85 × 10³
(vapor)
15.27
1581 (G) 1350 (D) D/G=1.10
0.362 284.6
NaBH4 [31] 45 8.6 D/G increase 0.373 284
Na2S2O4 [32] 13.77 /
1570.7 (G) 1347.3(D) D/G=1
0.377 /
Vitamin C [33] 77 12.5 D/G=1.752,
Table 1 (continued)
H2 [34] 1×10³ / / / 284.3
Thermal
annealing 0.009~2.75 / D/G increase / /
Microwave [35-36] 2 4.5
1591 (G) 1348 (D) D/G=0.96, /higher 2D/G
0.355 284.5
Solvent thermal
reduction [37] / 6.8~8.3
1586 (G)
1347 (D) 0.36 /
1.2 Graphene/Polymer Composites via Coating and Their
Applications
Among the commonly used methods to fabricate conductive polymer composites, coating turns out to be the most efficient, low-cost and easy-to-process protocol that requires relatively low loading of additives to achieve high electrical conductivity, more compatible with industrial practices. In this part, we will review the state-of-art of coating graphene into various polymer matrices for electrical conductivity, from the aspect of surface science, coating processes, structures and properties of the composites, and their relevant applications.
1.2.1 Coating GO onto Hydrophilic Polymer Surfaces
terephthalate) (PET), cotton, and cellulose. Due to the wettability of hydrophilic surface, usually coating can be directly performed without any pre-treatment. However, to achieve desired loading of GO or graphene, the coating process usually needs to be repeated for many times, which is time consuming and low in efficiency. Parameters such as the concentration of GO bath, dipping time, cycling number, drying temperature etc., should be optimized according to different polymer matrices, in order to ensure the desired graphene loading and the uniformity of the coating layers. Besides, the stability of coating layers is also a key issue to be investigated, since coating layers are usually sensible to mechanical force such as scratching, rubbing, and washing.
Figure 4 Schematic for the fabrication of reduced GO (rGO)-coated PET nonwoven fabrics (a). Change in the surface conductivity of the composite fabrics with the increase in the weight fraction of rGO (b). The insets display SEM images of the composite fabrics prepared at rGO fractions of 0.001 (I), 0.030 (II) and 0.080 wt% (III) (adapt from ref [38]).
One of the most feasible way to control graphene loading is to control the coating cycling number. Yu et al. coated graphene onto porous PET textiles by repetitive dipping of the PET fabric into graphene inks (see Figure 5). They found the sheet resistance decreased significantly with more number of dipping cycles, and finally reached a sheet resistance of
Figure 5 Coating graphene nanosheets onto porous textiles. (a) Photograph of graphene-coated conductive PET textile. (b) AFM image of graphene nanosheets deposited on a SiO2/Si substrate and the corresponding line scan profiles. (c) Typical TEM image of graphene nanosheets. (d) Sheet resistances Rs versus the number of dipping cycle for graphene-coated fabric sheets (G-textile) with and without nitric acid treatment. (e) SEM image of a sheet of graphene-coated textile. (f) High-magnification SEM image on the region highlighted in red rectangle (adapt from ref [39]).
Leary J. D. studied coating carded and hydroentangled PET staple fiber nonwovens
Figure 6 Graphite mass as a percentage of initial fabric mass for PET staple fiber nonwovens coated with EGF and GO dispersions (a). Mass loading also shown for GO coated samples after reduction to rGO. (b) IPR of PET nonwovens coated with GO and after reduction to rGO. IPR (c) and TPR (d) of PET nonwovens coated with rGO and EGF (adapted from ref [42]).
In summary, coating graphene onto textile is a convenient way to prepare conductive textiles, especially for hydrophilic polymer matrices, but the major limitations on this topic include:
1) Limited coating efficiency. To achieve higher loading of graphene, it usually requires tedious and time-consuming coating processes with tens of cycles. The uniformity of the coating layer will be compromised if the loading is too high.
2) Week adhesion. Due to the weak affinity between polymeric fibers and graphene, an extra adhesive layer or binder is often required to stabilize graphene coating, which possibly leads to inferior surface conductivity.
1.2.2 Coating GO onto Hydrophobic Polymer Surfaces
To ensure the uniform coating with good affinity, the wettability of the polymer matrices with the coating bath is critical, which is mostly determined by the surface tension of the coating bath and the surface energy of polymer matrices.45-46 In other words, polymer frameworks should have high enough surface energy to overcome the surface tension of the coating bath. Hydrophilic polymer matrices are readily wettable with aqueous coating solutions. However, many industrial polymers such as polypropylene (PP), polyethylene (PE), and polystyrene (PS) are hydrophobic, leading to great challenges in surface coating.
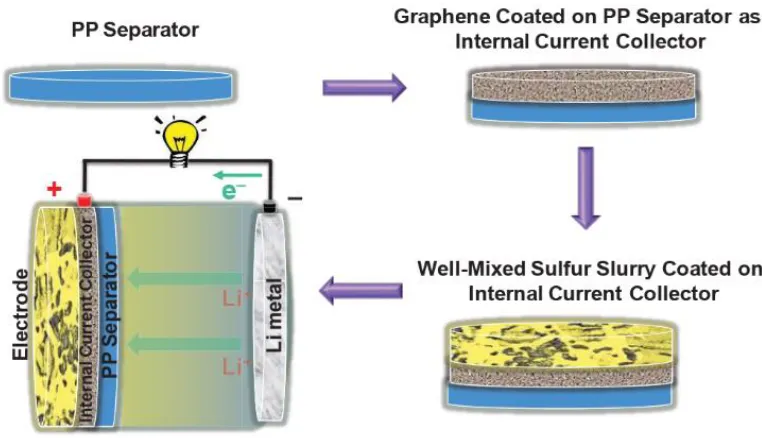
batteries to improve the performance of separation.47-48 PVDF as a binder was mixed with graphene in NMP to form a slurry, and further coated onto the PP separator with the Dr. Blade process (Figure 7).
Figure 7 Schematic illustration of coating graphene onto PP separator used in Li-S battery (adapted from ref [47]).
deposition, but it requires 40~50 times of treatment to intrigue the hydrophilic transition, indicating the low efficiency of the process.50 The major limitation of these surface modifications is that it usually requires complex processes, some of which are low-efficient, high-cost, or only result in temporary effects that fade away in a few hours.
In addition to binders and surface modifications, other strategies to coat carbon materials onto hydrophobic polymer matrices have rarely been reported. From the view of surface science, as long as the polymer surface have high enough surface energy to overcome the surface tension of the coating bath, the liquid should be able to spread on the surface and form continuous interfaces. Table 2 lists the surface energies for common polymers, many of which are hydrophobic in nature (adapted from ref [51]).
Table 2 Surface free energies (SFE) for common polymers (adapted from [51]).
Name
Surface free energy (SFE) at 20 °C (mN/m)
Temp.
coefficient SFE (mN/(m K))
Dispersive contrib. of SFE (mN/m)
Polar contrib. of SFE (mN/m)
Polyethylene-linear PE 35.7 -0.057 35.7 0
Polyethylene-branched PE
35.3 -0.067 35.3 0
Polypropylene-isotactic PP
30.1 -0.058 30.1 0
Polystyrene PS 40.7 -0.072 -34.5 -6.1
Polyvinylidene fluoride PVDF
Table 2 (continued) Polytetrafluoroethylene
PTFE (Teflon™) 20 -0.058 18.4 1.6
Polyvinylchloride PVC 41.5 - -39.5 -2
Polyvinylidene chloride PVDC
45 - -40.5 -4.5
Polyvinylacetate PVA 36.5 -0.066 25.1 11.4
Polymethylmethacrylate PMMA
41.1 -0.076 29.6 11.5
Polyethyleneoxide PEO 42.9 -0.076 30.9 12
Polyethyleneterephthalate PET
44.6 -0.065 -35.6 -9
Polyamide-6,6 PA-66 46.5 -0.065 -32.5 -14
Polyamide-12 PA-12 40.7 - 35.9 4.9
Polydimethylsiloxane PDMS
19.8 -0.048 19 0.8
Polycarbonate PC 34.2 -0.04 27.7 6.5
of the graphene oxide dope, its surface tension, interaction with polymer matrices, in order to engineer the interfaces between hydrophobic polymer and graphene.
1.2.3 Applications of Graphene-Coated Polymer Composites
Graphene/Polymer composites via coating have demonstrated various applications in electronics such as antistatic substances, printed antennas, sensors, diodes, energy-storage systems etc., by the virtue of its simple, scalable, and controllable process. Here we enumerate some typical applications of graphene-coated polymer composites.
Figure 8 Engineering of 3D interdigitated micro-supercapacitors with high energy density. (A-C) Illustration of the fabrication process for an asymmetric micro-supercapacitor based on laser scribed graphene (LSG)/MnO2 composites as the positive electrode and LSG as the negative electrode (adapt from ref [54]).
Lithium-Sulfur Battery Separator: As mentioned before, coating graphene onto PP separator is the most common application in the field of hydrophobic polymers, which can enhance the energy storage performance of Li-S batteries. Graphene can be either coated or filtrated onto PP separators. 55-56 The conductive graphene can block and collect the polysulfide, and reuse it by acting as an internal current collector, therefore improving the rate capability and cycling stability of Li-S batteries.
specific shielding effectiveness ranging from 210 to 320 dB·cm2 g-1, which is even tunable by compressing the porous polymer matrix.57
Figure 9 Fabrication of compressible polymer/PU composite foams for adjustable
electromagnetic interference (EMI) shielding (adapt from ref [57]).
Figure 10 Strain sensors used to monitor health. (a) Photographs of a strain sensor attached onto forearm like a tattoo. The insets are SEM images for top view and cross view of the sensor. (b) Real-time monitoring of human motion by detecting resistance change on finger movement (adapted from ref [59]).
1.3 Electrospun Graphene/Polymer Mats and Their Applications
composite nanofibers arises in the recent decades. The major motivation of incorporating GO or graphene into polymer nanofibers is to enhance mechanical properties, increase porosity and/or surface areas, introduce ionic/electrical conductivity, or impart biomedical properties e.g. antibacterial features.
Figure 11 Electrospinning diagram. Diagram by Joanna Gatford at The New Zealand Institute for Plant and Food Research Ltd (adapted from [63]).
1.3.1 Preparation and Properties of Graphene/Polyvinyl Alcohol
Electrospun Mats
Figure 12 The variation of voltages with time during the electrospinning (a). Typical FESEM (b) and HRTEM image (c) of GO/PVA nanofibers. (d) Tensile stress-strain curves of nanofibers with various GO loading (adapted from ref [64]).
decreased elongation during spinning. Different from GO/PVA electrspun nanofibers in which no GO can be identified, they actually observed protrusion of graphene out of the PVA fiber in HRTEM image (see Figure 13 (b)). The graphene/PVA electrospun fibers showed significantly increased thermal stability (increase of 15 °C) and crystallinity (59% increase). Although pristine graphene was introduced, no electrical conductivity was reported.
Figure 13 SEM images of electrospun 0.5 wt% graphene/PVA mat (a). The fibers were bead-free and the observed fiber diameters ranged from 0.7 to 1 μm. HRTEM images of a single graphene/PVA/PVP fiber (b). Since the lateral dimension of graphene is comparable to the fiber diameter, the graphene occasionally protrudes out of the PVA fiber (adapted from ref [65]).
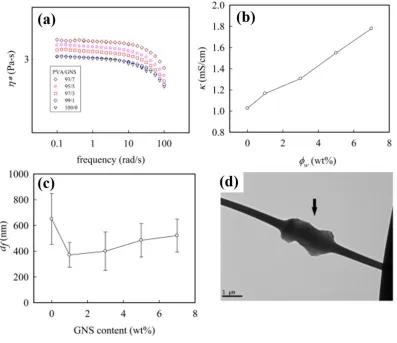
Huang et al. investigated the electrospinning of graphene and PVA at the presence of sodium dodecylbenzene sulfonate (SDBS), emphasizing the effects of graphene on the dope rheology, conductivity and fiber structure.66 In the presence of graphene, the zero-shear viscosity (𝜂0) increases from is 3.04 Pa∙S of pure PVA to 3.33 Pa∙S at the loading of 7 wt%.
Figure 14 Effects of graphene concentration on (a) solution viscosity and (b) solution conductivity at 25°C. (c) fiber diameter versus graphene content of graphene/PVA nanofiber. (d) TEM images of electrospun PVA nanofibers filled with 1 wt% of graphene (adapted from ref [66]).
photocatalysis (Figure 15). This work provided new insights to further functionalize GO/PVA nanofibers and develop one-dimensional hybrid materials.
Figure 15 TEM images of composite nanofibers: TiO2/PVA (a and b) and TiO2/GO/PVA (c and d) (adapted from ref [67]).
annealing has been a widely used to impart electrical conductivity to these electrospun mats though.
1.3.2 Applications of GO/PVA Electrospun Composite Mats
The potential applications of GO/PVA electrospun mats mainly lie in energy storage and biomedical engineering.
Figure 16 Morphology and electrochemical performance of the PEDOT coated GO/PVA electrospun mat (adapted from ref [68]).
Therefore, the as-prepared graphene/CNF/Si electrode showed remarkable cyclic performance in Li-ion batteries compared with other Si-based electrodes (Figure 17 (c)).
Figure 17 SEM image of GO/PVA/Si as-spun nanofibers (a). (b) and (d)HRTEM images of Si/CNF/graphene. (c) Cyclic performance of electrodes made from neat Si, CNF, Si/CNF, Si/CNF and Si/CNF/graphene at a current density of 100 mA g-1 (adapted from ref [69]).
ability of the cell. Figure 18 shows the viability of osteoblasts increased with longer culture period for all scaffolds, and their growth and proliferation on the GO/PVA scaffolds tend to increase with higher GO content, which can be attributed to the excellent intrinsic biocompatibility and the hydrophilic nature of GO.
Figure 18 Formazan absorption (at 490 nm) in MTT assay was expressed as a measure of cell viability of MT3T3-E1cells seeded on the electrospun PVA and PVA/GO composite scaffolds with different GO contents for 24, 48, and 96 h (adapted from ref [70]).
1.3.3 Other GO/Polymer Electrospun Mats and Their Application in
Energy Storage
into CNF via thermal annealing. Khan et al. reported the fabrication of electrospun PAN and polymethyl methacrylate (PMMA) nanofiber mats embedded with graphene nanoflakes as the separator for Li-ion batteries.71 They pointed out the incorporation of graphene raised the ionic conductivity of the electrospun mats, which may contribute considerably to the enhanced battery functionality and lifetime. Table 3 shows the ionic conductivity of the electrospun mats of PAN and PMMA as a function of graphene concentration. At 8 wt% of graphene loading, the ionic conductivity of PAN and PMMA electrspun mats increased by 44.7% and 28.0%, respectively.
Table 3 Ionic conductivities of PAN and PMMA electrospun mats as a function of graphene concentration (adapt from ref [71]).
Graphene concentration
(wt%)
Ionic conductivity (S m-1) ×10-4
PAN nanofibers PMMA nanofiber
0 1.83 ± 0.03 3.97 ± 0.03
2 2.25 ± 0.05 4.52 ± 0.024
4 2.72 ± 0.04 5.30 ± 0.038
8 3.31 ± 0.025 5.52 ± 0.03
the high affinity between -C≡N and polysulfides (Li2Sn) and the electrostatic interactions between GO and negatively charged species (Sn2-) hindered the shuffle effects.72 Table 4 compares the physical and electrochemical properties of different electrospun mats working as the separators in Li-S batteries.
Table 4 Physical and electrochemical parameters of PP membrane, electrospun mats of PAN, and PAN/GO as the separator in Li-S battery (adapted from ref [72]).
Sample Porosity (%) Electrolyte Uptake (%) Ionic Conductivity (mS cm-1)
PP 41 152 0.60
PAN 70 275 1.00
GO/PAN 72 303 1.36
Except for battery separators, another important application in energy storage of these mats is to be used electrodes in supercapacitors or batteries. In this case, further treatment such as carbonization or chemical reduction of GO is usually required in order to boost the electrical conductivity.
2000 cycles, owing to the high electrical conductivity and large specific surface area of the G/CNF composites (Figure 19 (c) and (d)).73
Figure 19 SEM (a) and TEM (b) image of G/CNF electropsun mats. (c) Variation of the specific capacitance of G/CNFs with the current density. (d) Cycling performance of the G/CNF and CNF electrodes at a constant current density of 2.5 A g-1 (adapted from ref [73]).
conductivity of the nanocomposites. They found with only a low loading of graphene (1 wt%), the charge transfer resistance (Rct) reduced from above 212 Ω to only 36 Ω, which contributed significantly to the rate capability and cycling properties of the electrode (Figure 20).
Figure 20 TEM image (a), AC impedance measurements (b), rate capability (c) and cycling performance (d) of graphene-embedded LTO nanofiber composites (adapted from ref [74]).
found the tensile moduli of GO/PLGA with low GO loading of 1% and 2% showed significant enhancement by almost 3- to 5-fold, respectively.76
1.4 Compounding of Graphene/Polymer Composites
1.4.1 Melt Compounding
Melt compounding is the most commercially attractive process of composite fabrication, due to its advantages in scaling up, environmentally friendliness, and versatility. It basically involves direct mixing the graphene or its derivatives with polymer melts in a mixing chamber and extruding them by a twin-screw extruder under certain parameters such as screw speed, temperature and time. The extruded composites can be further hot pressed into films, injected into mold, or melt spun into fibers. It is especially popular in fabricating thermoplastic polymer nanocomposites, such as PP, PE, nylon 6, etc. Since GO is not thermally stable and will release gas due to decomposition of oxygenated groups, graphene or exfoliated graphite (EG) are more commonly used during melt compounding.
very efficiently, resulting in homogeneous xGnP-coated PP powder that can be used for compression or injection molding (Figure 21 (a) and (b) ). Such xGnP/PP showed a much lower percolation threshold of ~0.3 vol%, much lower than that made from conventional melt mixing. (Figure 21 (c)) At the comparable loading (1, 3, 5 vol%), its conductivity was also higher than the composites made from other two compounding methods (Figure 21 (d)).
Figure 22 Effect of the cooling rate on the electrical conductivity of xGnP/PP. FC stands for fast cooling, and SC stands for slow cooling. xGnP-1 and xGnP-15 means the diameter for nanoplatelets is 1 μm and 15 μm, respectively. Schematic of the microstructure of (b) slow cooled and (c) fast cooled xGnP/PP. The arrows indicate the formation of conductive network which can span across the whole sample in case of slow cooling (adapt from ref [78]).
CB/PP are about 8, 4, and 2 wt%, respectively (Figure 23 (a)). In addition, they tried to produce conductive fibers with a core/sheath structure on a bicomponent melt spinning line, with core of the hybridized GNP+CB/PP nanocomposite and sheath of polyamide 6 (PA 6). The reason why they chose GNP+CB/PP as the conductive core is that it shows favorable rheological properties (Figure 23 (b)).
Figure 23 Electrical conductivity as the function of the weight fraction filler for CB, GNP + CB (ratio 1:1), and GNP in PP (a). Storage modulus of different PP composites (b) (adapted from ref [79]).
Table 5 Spinning parameters and properties of produced bicomponent yarns (adapted from ref [79]).
Sample Sheath/core volume ratio Melt draw ratio Solid state draw ratio Conductivity (S cm-1)
Conductivity after heat treatment (S cm-1)
Tenacity (cN tex-1)
1 13/3 44 2.0 0.023 0.143 21.7 ± 4.0
2 13/3 35 2.5 0.012 0.134 20.0 ± 3.5
3 3/1 88 1.0 0.036 0.090 8.4 ± 3.9
4 3/1 53 1.7 0.014 0.138 15.5 ± 3.5
In addition to acting as conductive additives, graphene can also be used to enhance other polymer properties such as thermal and mechanical properties. Achaby et al. fabricated the graphene/PP composites (GNs/PP) via melt mixing and discussed the effects of graphene on the thermal, mechanical and crystallization behaviors.80 The addition of graphene increased the thermal decomposition temperature by ca. 40 ℃ at weight loss of 5%, 20 ℃ at weight loss of 15%, and 10 ℃ at maximum weight loss, indicating graphene enhanced the thermal stability of GNs/PP significantly (Figure 24 (a)). The hindered diffusion of volatile decomposition products within the composites was believed to be the major cause behind this phenomenon, which strongly depending on the nanosheets-polymer chain interactions. Besides thermal stability, the incorporation of graphene also increased the Young’s modulus and the tensile strength significantly (Figure 24 (c) and (d)). With 1 wt% and 3 wt% of graphene loading, the Young’s modulus showed a substantial increase of 64% and 100%, respectively, and the tensile
the relatively strong interfacial interaction between graphene and PP, which resulted in high interfacial stress transfer efficiency. However, the elongation at break decreased dramatically even when the graphene loading was as low as 0.2~0.5 wt% due to the restriction of polymer chain movements (Figure 24 (d)).
Melt mixing is a convenient, environmentally friendly, cost effective way to fabricate graphene/polymer composites. The major disadvantage is that the percolation threshold is relatively high due to the difficulty to achieve uniform dispersions of fillers. High electrical conductivity requires high loading of graphene, whereas more graphene will decrease the elongation at break of the composites, leading to brittle products. Strategies to lower the percolation threshold and optimize the trade-off between conductivity and tenacity are still under investigation.
1.4.2 Solution Compounding
Figure 25 Experimental setup and the procedure for preparing GnP/PP composites (a). (b) SEM image of GnP/PP with graphene nanoplatelets loading of 5.0 wt%, with enlarged region shown in (d). (c) Resistivity of the GnP/PP as a function of graphene loading (adapted from ref [81]).
the crystallization kinetics of PP (Figure 26).82 However, they didn’t quantitatively calculate the detailed kinetics.
Figure 26 2D WAXD patterns of neat PP (PPG0) and its graphene composites with 5 wt% and 10 wt% of graphene loading (PPG05 and PPG10 respectively) isothermally crystallized at 145
℃ under quiescent conditions (adapted from ref [82]).
Figure 27 TEM (a) and SEM images (c) of the rGO/PP latex composite (0.2 vol% of rGO). (b) Conductivity of the rGO/PP composites with different volume fraction of graphene as a function of frequency at room temperature. (d) Dielectric permittivity (ε') of the rGO/PP composites as a function of graphene volume fraction, measured at 103 Hz and room temperature (adapted from ref [51]).
formation of conductive network through the polymer matrix. The percolation threshold was roughly estimated between 1.0 wt% and 2.0 wt%. But no further analysis regarding to conductivity was conducted. Similar with other reports on graphene/polymer composites, the resulted graphene/PP showed higher Young’s modulus and yield strength, higher thermal degradation temperature, but lower elongation at break as aforementioned.
Table 6 Properties of graphene/PP nanocomposites with various graphene loadings (adapted from ref [83]).
Sample Graphene (wt%) Crystallinity 𝜒𝑐 (%) Peak
temperature of crystallization Tp (°C)
Electrical conductivity 𝜎𝑐 (S m-1)
Young’s
modulus (GPa)
Elongation at break (%)
Neat PP 0 42 116 3.2 × 10⁻¹³ 1.02 ± 0.10 1120 ± 100
PPG-0.1 0.1 41.6 117.5 1.3 × 10⁻¹² 1.25 ± 0.12 1150 ± 120
PPG-0.5 0.5 42.8 117.7 3.6 × 10⁻¹⁰ 1.50 ± 0.15 330 ± 30
PPG-1.0 1 42.7 117.9 2.7 × 10⁻⁹ 1.76 ± 0.25 130 ± 20
PPG-2.0 2 43.1 118.5 4.5 × 10⁻⁵ 1.66 ± 0.20 120 ± 18
PPG-5.0 5 44.7 120.3 1.8 × 10⁻⁴ 1.23 ± 0.13 100 ± 15
system, such a low percolation threshold can hardly be achieved, probably due to the structure difference between PP and graphene, the crystallization behavior, solution solubility etc. In general, solution compounding is still an effective way to prepare graphene/polymer composites with uniform filler distribution, and can be easily combined with melt compounding or followed with other fiber processing techniques, such as electrospinning, melt and wet spinning.
1.5 Summary
CHAPTER 2: RESEARCH OBJECTIVES AND
DISSERTATION OUTLINE
The objective of this work is to 1) create electrically/ionically conductive polymer composites with two dimensional (2D) carbon flakes graphene oxide or graphene, which deliver high conductivity while retain the original polymer features such as light weight and flexibility; 2) provide fundamental understanding on how GO interacts with polymer solutions/individual fibers and influences the properties of composites; 3) investigate the applications of graphene/polymer composites in energy-storage systems. The main research work includes:
2.1 Thermal Decomposition of GO in Air via In-situ X-ray
Diffraction Analysis
Thermal decomposition of graphene oxide (GO) has been extensively investigated in the last decade, but the detailed reaction kinetics remains elusive so far. Here we employ in-situ X-ray diffraction (XRD) analysis to clarify the kinetics of GO decomposition in different
has provided new insights on the reaction kinetics of GO thermal decomposition and offered a novel perspective on kinetic analysis based on the in-situ XRD technique.
2.2 Conductive Graphene/Polymer Composites via Coating and
Compounding
2.3 Graphene-coated Nonwovens as Energy-storage Textiles
To further investigate the applications of the conductive G/NW in wearable electronics, herein monolithic supercapacitors have been developed on the GO/nylon nonwoven composites via a programed CO2-laser patterning process. The nonwoven works as an efficient matrix with high surface area, ensuring enough electrode materials generated via the subsequent laser patterning processes. It also improves the electrolyte uptake and ionic diffusion during the charge/discharge process owing to the highly porous structure. Similar application has also been demonstrated on the GO/PP nonwoven. Detailed electrochemical analysis of those GO/nonwoven supercapacitors have been conducted, including the effects of electrode geometry, electrolyte selection, kinetic analysis, bending performance, etc. High areal capacitance, energy density and power density, have been achieved and the G/NW based monolithic supercapacitors carry great promise to be used as lightweight, flexible and minimized energy-storage systems.
2.4 Electrospun Mat of Polyvinyl Alcohol/Graphene Oxide as
Solid-State Electrolyte with Superior Performance
overcomes the major issue of conventional PVA-based electrolytes, which is the ionic
conductivity decay upon drying. After exposure to 45±5% relative humidity at 25 ℃ for 1
CHAPTER 3: THERMAL DECOMPOSITION OF
GRAPHENE OXIDE IN AIR VIA IN-SITU X-RAY
DIFFRACTION ANALYSIS
3.1 Introduction
Graphene, a monolayer of sp2 carbon atoms, has shown excellent performance in transistors, sensors, supercapacitors, batteries, electrocatalysts, and solar cells due to its excellent electrical, optical, thermal and mechanical properties.13, 85-93 A lot of effort has been made toward the large-scale production of graphene through various approaches after it was first exfoliated from graphite, among which conversion of graphene oxide (GO) has attracted enormous attention due to its large scale accessibility and versatility.8, 15, 26, 94 GO, typically made via chemical oxidation of graphite,95 is a nonstoichiometric compound, with oxygenated groups, such as hydroxyl, epoxy, ester, lactol and carboxyl groups, attached on the surfaces and peripheries of the basal planes.12, 23 When dispersed in water, GO hydrolyzes and bares negative charges on its surface, thus GO flakes are well exfoliated into single layers.96 Chemical reduction of GO dispersion along with some surfactants, can lead to large quantities of monolayer graphene in water, which is hardly available through any other protocols.29, 97-98 In addition, thermal conversion of GO back to graphene also attracted considerable attention since it’s a simple and nontoxic process with great potential in lowering the cost of graphene
The extent of GO conversion to graphene can be characterized by the color, microscale morphology, carbon-to-oxygen (C/O) ratio, electrical conductivity, and dispersibility of the resulted products. These analyses can offer detailed information of structural changes in GO before and after decomposition, but are quite limited in providing a dynamic scheme of the reaction. In-situ characterization techniques can observe the entire reaction process directly and would therefore be able to collect real-time data for mechanistic and kinetic studies. However, very few studies have been reported to date on GO decomposition via in-situ analysis techniques. Sampath et al. analyzed the electrochemical reduction of GO via in-situ Raman spectroscopy measurements, and confirmed that GO can be reduced electrochemically in deaerated KNO3 solutions starting from -0.2 V vs. saturated calomel electrode (SCE).105 However, the reduction kinetics was not mentioned. Ruoff et al. investigated the mechanism and kinetics of thermal reduction of GO platelets via monitoring its resistivity at different stages of reduction in high vacuum.103 They reported an estimated value of reaction order of 2.2 and activation energy of 37 ± 1 kcal/mol for the thermal decomposition of a single GO platelet in high vacuum, but did not discuss other important factors that will influence the kinetics, such as reaction atmosphere and sample morphology. Huh characterized the thermal decomposition process of GO from room temperature to 2000 °C under N2 gas flow with the in-situ XRD technique.99 He qualitatively studied the thermal decomposition process of GO by establishing the correlation between the position of the (002) diffraction peak and the corresponding stage of decomposition. Although the change in the peak intensity was briefly mentioned, no further quantitative analysis was presented.
![Figure 3 Proposed structure models for GO (adapted from ref [12]).](https://thumb-us.123doks.com/thumbv2/123dok_us/1524473.1186852/32.612.90.490.72.370/figure-proposed-structure-models-go-adapted-from-ref.webp)