An Empirical Analysis of Different
Classification Algorithms for the Ecoli Protein
Dataset
S.Kalaivani, S.Gandhimathi
Research Scholar, Dept. of Computer Science, PGP Arts and Science College, Namakkal, Tamilnadu, India
Assistant Professor, Dept. of Computer Science, PGP Arts and Science College, Namakkal, Tamilnadu, India
ABSTRACT
: Classification is a data mining technique which is based on machine learning. Basically classification is used to classify each item in a set of data into one of predefined set of classes or groups. Classification method makes use of mathematical techniques such as decision trees, linear programming, neural network and statistics. Therefore, the key objective of the learning algorithm is to construct models with good generality capability. That is the models that accurately predict the class labels of previously unknown records. In this paper we are analyzing the performance of 3 classifiers algorithms namely Naïve Bayes, Instance Based K-Nearest Neighbor (IBK) and Random Forest (RF). From the experimental results, it is found that Naïve Bayes algorithm performs better than the other algorithms. For the comparison of different classification algorithms, we used the ecoli protein datasets. The cross validation parameter is used for calculating the performance of the classification algorithms. From the experimental results, it is inferred that the Naïve Bayes algorithms performs better than the other algorithms.KEYWORDS
: Classification, Navie Bayes, Instance Based K-Nearest Neighbor (IBK), Random Forest , Ecoli, Dataset, Cross validation.I.INTRODUCTION
Generally, Classification is function that maps (classifies) a data item into one of several predefined classes. In classification technique, the testing data are used to estimate the accuracy of the classification rules. The examples include detecting spam email messages based upon the message header and content and classifying galaxies based upon their shapes. If the accuracy is acceptable the rules can be applied to the new data tuples. It describes a set of predetermined classes. Each tuple/sample is assumed to belong to a predefined class, as determined by the class label attribute. The set of tuples used for model construction is called training set. The training and testing data model is represented as classification rules, decision trees, Instance Based Classifiers, Support Vector Machines.
Pablo Bermejo, et al., presented a proposal that is based on the combination of the NB classifier with incremental wrapper feature subset selection (FSS) algorithms. The advantage of their approach is to analyze both theoretically and experimentally, and the results show a striking speed-up for the embedded FSS process [1].
Li-Min Wang, et al., proposed a novel algorithm, Self-adaptive NBTree, which induces a hybrid of decision tree and Naive Bayes. The Naive Bayes node helps to solve overgeneralization and overspecialization problems. The experimental results on a variety of natural domains indicate that Self-adaptive NBTree has clear advantages with respect to the generalization ability [2].
Luciano C. Blomberg, et al., presented an analysis regarding the influence of missing data on datasets when submitted to traditional classification algorithms in data mining applications. Their analysis shows that the classification performance decreases after significant insertion of missing values in all datasets tested [3]
Ramyachitra, et al., analyzed the performance of 3 Lazy classifier algorithms namely IBK, KStar, LWL. They used the Superoxide dismutase (SOD1) protein datasets for calculating the performance by using the cross validation parameter. And finally they perform the comparative analysis based on the performance factors such as the classification accuracy and execution time for all algorithms.
Breiman L.et al., generates new training set randomizing the outputs in the original training set by a random selection of features to split each node yields error rates that compare favorably to Adaboost [5].
Dietterich T,et al, proposed a random split selection where at each node the split is selected at random from among the K best splits. Splits are chosen according to a purity measure [6].
III. METHODOLOGY
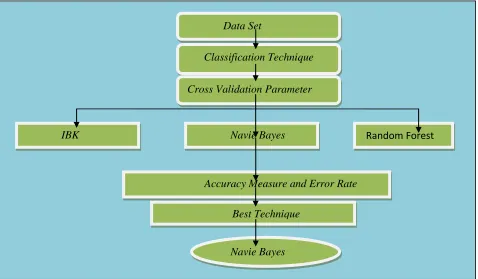
Using the classification technique we find the best algorithm for the ecoli protein dataset. The flow diagram for the comparative analysis is shown in Fig. 1.
A. Dataset
The ecoli protein datasets has been collected from the Keel Repository database. This dataset contains 336 instances and 8 attributes. The data mining tool weka is used for analyzing the performance of these classification algorithms.
B. Classification
In this paper we have analyzed the classification algorithms to predict which of the algorithm is most suitable for the ecoli protein dataset. In these classifications we compare three algorithms namely IBK, Naïve Bayes and Random Forest to find out which one fits effectively for the ecoli protein dataset.
The classification algorithms are listed below. 1. Instance Based K-Nearest Neighbor (IBK) 2. Naïve Bayes
3. Random Forest(RF) 1) IBK
Z
Figure 1. Comparative analysis of Classification
2) Naïve Bayes
The Naive Bayes classifier is a straightforward probabilistic classifier stand on applying Bayes' theorem with strong naive independence assumptions. A more expressive term for the underlying probability model would be "independent feature model". An inclusive comparison with other classification algorithms in 2006 showed that Bayes classification is output performed by other approaches, such as boosted trees or random forests [8].
3). Random Forest
Random forests (RF) are a combination of tree predictors such that each tree depends on the values of a random vector sampled independently and with the same distribution for all trees in the forest. The generalization error of a forest of tree classifiers depends on the strength of the individual trees in the forest and the correlation between them [9].
IV. EXPERIMENTAL MEASURES
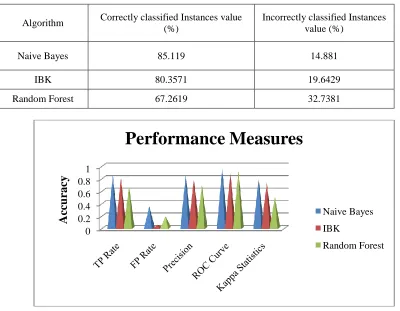
In this paper we calculate the experimental measures by using the performance factors such as the classification accuracy and execution time. And also we find out the accuracy measure and error rate to determine the best algorithm for the ecoli protein dataset. The performance factors for these classification algorithms are listed in Table 1 and the accuracy measure by class for the classifier algorithms is depicted in Table 2.
From the experimental results, it is inferred that for the cross validation parameter the Naïve Bayes algorithm provides better Precision, TP rate and the ROC values for the ecoli protein dataset. And also the naïve bayes algorithm
Data Set
Classification Technique
Cross Validation Parameter
IBK
Navie Bayes
Random Forest
Accuracy Measure and Error Rate
Best Technique
TABLE 1. PERFORMANCE FACTORS FOR THE CLASSIFICATION ALGORITHMS
Algorithm TP Rate FP Rate Precision ROC Curve Kappa Statistics
Naive Bayes 0.851 0.35 0.861 0.96 0.7965
IBK 0.804 0.054 0.799 0.878 0.7295
Random Forest 0.673 0.19 0.689 0.924 0.4971
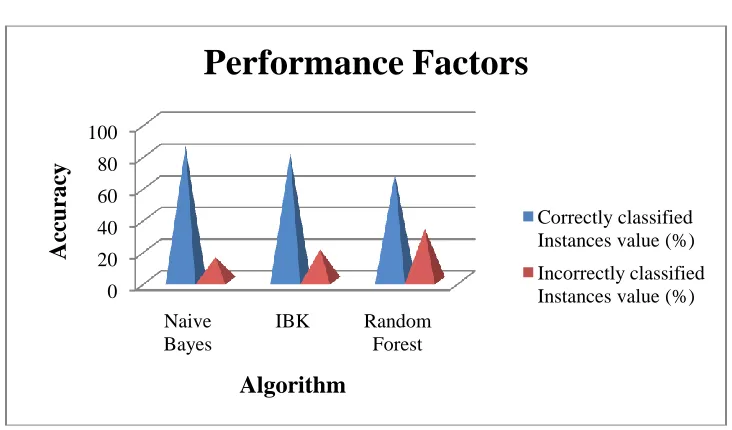
TABLE 2. ACCURACY MEASURES FOR CLASSIFICATION ALGORITHMS
Algorithm Correctly classified Instances value
(%)
Incorrectly classified Instances value (%)
Naive Bayes 85.119 14.881
IBK 80.3571 19.6429
Random Forest 67.2619 32.7381
Figure 2. Performance Measures for the Classifier algorithms 0
0.2 0.4 0.6 0.8 1
Ac
cu
rac
y
Performance Measures
Naive Bayes
IBK
Figure 3. Accuracy Measure for the Classifier algorithms
For IBK algorithm it is inferred that for the cross validation parameter, the Precision, ROC, F-Measure, TP Rate values gives poor results than other algorithms. The Error rate measure for the classification is depicted in Table 3. And also Accuracy error rate measure for the classifier is shown in the Fig. 4 and Fig.5.
For Random Forest algorithm it is inferred that for the cross validation parameter, the ROC value, TP Rate, Precision, F-Measure values gives better than IBK and poor results when compared to Naïve Bayes for the ecoli dataset.
TABLE 3. ERROR RATE MEASURE FOR CLASSIFICATION ALGORITHM
Algorithm Mean Absolute Error Root Mean Squared Error
Naive Bayes 0.0434 0.1653
IBK 0.0535 0.2189
Random Forest 0.1446 0.2941
TABLE 4. ERROR RATE MEASURE FOR CLASSIFICATION ALGORITHMS
Algorithm Relative Absolute Error Root Relative Squared Error
Naive Bayes 23.7063 54.7848
IBK 29.238 72.5574
Random
Forest 79.0735 82.5706
0 20 40 60 80 100
Naive Bayes
IBK Random
Forest
Ac
cu
rac
y
Algorithm
Performance Factors
Correctly classified Instances value (%)
Figure 4. Accuracy error rate measure for classification algorithms
Figure 5. Accuracy error rate measure for classification algorithms
In the experiment was carried out to the ecoli protein datasets by using the cross validation parameter. From the results it is inferred that the Naïve Bayes algorithm performs well as compare to the IBK and Random Forest. The Naïve Bayes algorithm gives more correctly classified instances compare to others.
0 0.05 0.1 0.15 0.2 0.25 0.3
Naive Bayes IBK Random Forest
Ac
cu
rac
y
Algorithm
Error Rate
MAE RMSE
0 20 40 60 80 100
Naive Bayes IBK Random Forest
Ac
cu
rac
y
Algorithm
Error Rate
V. CONCLUSION AND FUTURE WORK
In this paper we have analyzed the performance of 3 classifier algorithms namely IBK, Random Forest and Naïve Bayes. We used the ecoli protein datasets for calculating the performance by using the training set parameter. And finally we analyzed the algorithms by using the performance factors such as the classification accuracy and the performance factors. From the results, it is observed that the Naïve Bayes algorithm provides better results than the other algorithm.
In Future these classifications can be experimented on other datasets also. And in future we can modify the Naïve Bayes algorithm to obtain more effective results. And also the classification algorithms can be analyzed using different parameters such as the training set, percentage split, and supplied test set.
REFERENCES
[1] Pablo Bermejo, José A. Gámez, José M. Puerta, “Speeding up incremental wrapper feature subset selection with Naive Bayes classifier”, Knowledge Based Systems, vol. 55, pp. 140–147, 2014.
[2] Li-Min Wang, Xiao-Lin Li, Chun-Hong Cao, Sen-Miao Yuan, “Combining decision tree and Naive Bayes for classification”, Knowledge-Based Systems, vol. 19, pp. 511–515, 2006,
[3] Luciano C. Blomberg, Duncan DubugrasA.Ruiz, “Evaluating the influence of missing data on classification algorithms in data mining applications”, Em: IX Simpósio Brasileiro de Sistemas de Informação, v. 1, p. 734-743, 2013.
[4]. Ramyachitra and Manikandan, “Data mining techniques for protein sequence analysis”, Lambert Academic Publishing, 978-3-659-54129-2. [5] Himadri Chauhan, Vipin Kumar, Sumit Pundir, Emmanuel S. Pilli, “Comparative Analysis and Research Issues in Classification Techniques for Intrusion Detection”, Intelligent Computing, Networking, and Informatics, Advances in Intelligent Systems and Computing, vol. 243, pp 675-685, 2014. [6]. Breiman L, Friedman J, Olshen R, Stone C: Classification and regression trees. New York: Chapman & Hall; 1984. 32.doi:10.1023/A:1010933404324
[7].Dietterich, T. (1998). An experimental comparison of three methods for constructing ensembles of decision trees: Bagging, boosting and randomization, Machine Learning, 1–22.
[8] Caruana, R.; Niculescu-Mizil, A. (2006). "An empirical comparison of supervised learning algorithms". Proceedings of the 23rd international conference on Machine learning, pp. 161-168, 2006