ISSN 2286-4822 www.euacademic.org
Impact Factor: 3.4546 (UIF)
DRJI Value: 5.9 (B+)
Summative Assessment Tests and Numeric
Methods for Item Analysis
ALFONS HARIZAJ
Expert Albania National Agency of Examinations
Abstract:
Assessment is broadly defined as the process of collecting and interpreting information that can be used to inform teachers, students, and, when applicable, parents/guardians or other users of assessment information, about students’ progress in attaining the knowledge, skills, attitudes, and behaviours to be learned or acquired in school.
Summative assessment is an integral part of assessment. Without sound assessment practices, we may not know if students are progressing as planned. Further, we may not be able to effectively plan for students’ future learning opportunities. A summative assessment determines the final mark the student receives, e.g. an essay, or traditional examination.
Key words: examination, assessment, item analysis,item difficulty, item discrimination
PURPOSE AND FORMS OF ASSESSMENT
Assessment can serve different purposes and the method you choose will depend on its purpose. One assessment task may fulfil more than one function:
Formative assessment is designed to help learners learn more effectively through giving them feedback on their performance indicating how it can be improved.
A formative assessment might, for example, take the form of an in-class test or an essay which is marked but does not count towards the final marks given for a course.
Diagnostic assessment is used to show a learner's preparedness for a unit or programme of study and identifies any potential gaps in knowledge, skills and understanding expected at the start of study, or any other problems. Diagnostic assessment is considered also as a common form of formative assessment.
Summative assessment is used to indicate the extent of a learner’s success in meeting the intended learning outcomes of a unit of study or programme. A summative assessment determines the final mark the student receives, e.g. an essay, or traditional examination
The main types of summative assessment are two: traditional –discreet and continued.
Summative discreet assessment has traditionally been carried out through pen and paper tests and examinations at the end of:
a teaching class,
a teaching unit/chapter,
a term/semester,
Summative assessments include also national exams/ assessments as high-stakes of summative assessments. Such summative assessment has been conceptualized as a discrete and separate stage added to the end of the learning and teaching cycle. Apart of above discrete traditional conception is
developed continued assessment that mean you would never be
graded on just one exam.
TYPES OF SUMMATIVE ASSESSMENT
Summative Assessment can be objective or subjective.
Objective assessment is a form of questioning which has a single correct answer.
Types of question include objective questions: true/false, multiple choice, and matching questions. Subjective assessment is a form of questioning which may have more than one current answer (or more than one way of expressing the correct answer). Types of question include subjective questions: extended-response questions and essays.
Cultural and linguistic aspects of summative
assessments
Cultural and linguistic aspects should be high priority in high-stakes summative assessments. They should be also priority of other summative classroom assessments. These aspect are related to cultural and linguistic diversity of students. Classroom assessment practices should be responsive to and respectful of the cultural and linguistic diversity of students and their communities.
linguistic backgrounds are ignored, students may become alienated or disengaged from learning and the assessment process. Teachers need to be aware of how such backgrounds may impact students’ learning and performance. Teachers should be ready to adjust their assessment practices where needed to ensure students have adequate opportunities to demonstrate what they know and can do (e.g., extra time; dictionaries).
Test grid
A test grid consists of a topic dimension and a cognitive reasoning dimension.
The procedure for creating such a table is as follows:
(a) Identify topics to be assessed and their relative emphases in percentages (defin-ing the rows),
(b) identify cognitive skills expected and their relative emphases in percent-ages (defining the columns),
(c) decide the total points for the summative assessment, (d) calculate the cell values by multiplying total points by combined relative emphases, and
(e) make adjustment to cell values and ensure that the total of cell values is equal to the total summative assessment points.
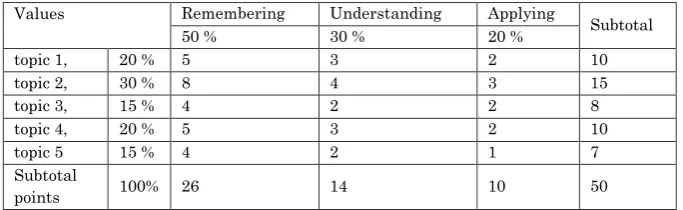
TABLE 1.1 A Sample Test Grid with Values
Values Remembering Understanding Applying
Subtotal
50 % 30 % 20 %
topic 1, 20 % 5 3 2 10
topic 2, 30 % 8 4 3 15
topic 3, 15 % 4 2 2 8
topic 4, 20 % 5 3 2 10
topic 5 15 % 4 2 1 7
Subtotal
points 100% 26 14 10 50
cell values). In the example of Table 1.1, we see that the assessment will cover five topics: topic 1, topic 2, topic 3, topic 4, topic 5; the above topics of content involve three cognitive reasoning skills: remembering, understanding, and applying. The cell values are determined by the product between weights of the corresponding topic and skill and the total points of the summative assessment.
Question type
Once the assessment domain is defined in the form of a test grid with values, the next step to plan the summative assessment is to decide the assessment format and question type.
Once you have decided on assessment formats and question types, you can then operationalize the test grid with values into a test grid with items. Table 1.2 shows a sample test grid with items based on the test grid in Table 1.1.
TABLE 1.2 A Sample Test Grid With Items
Number of Items Points
Remembering Understanding Applying
Subtotal Multiple Choice
Constructed
Response Performance
topic 1 5(5) 2(2)
2(10)
topic 2 8(8) 2(2)
topic 3 4(4) 1(1)
topic 4 5(5) 1(1)
topic 5 4(4) 1(1)
Subtotal 26(26) 7(7) 2(10) 35(50)
Once a test grid with items is created, the next steps in developing a summative assess-ment are to write test questions and develop performance assessment by using the test gridwith items as a guide.
How many items is enough?
This is entirely dependent on the depth and breadth of your goals and objectives.
There is a general rule is that ten items are needed to assess knowledge learning targets that encompass a unit. However in many instances as few as five items can provide good assessment.
When reasoning, performance, and other skills are being assessed we can usually only use a few items, and sometimes only one item, because they take so much time.
Number and Length of Assessments
Be sure to allocate a sufficient amount of time for completion of your test or quiz. Too much time is better than not enough time.
Many short assessments can provide a more accurate representation of what a student knows than one long assessment.
Item Bias
Items for which equally able persons from different cultural groups have different probabilities of success.
Differences in item difficulty, item discrimination, etc indicate different response patterns. Differentiation may indicate that the test items are not measuring the same construct for each group
Item Bias guidelines
Revise or remove assessments or assessment items and tasks that promote stereotypes. Revise or remove assessments that may unfairly impact the performance of individuals or groups of students. Avoid language that is overly confusing or complex thus assessing unintended skills. Avoid assessment topics that may disturb or be too sensitive for students unless there is a prescribed requirement to assess these topics. Minimize all irrelevant factors that may affect the judging and scoring of student performance:
1. stylistic factors such as handwriting, vocabulary or sentence structure when the intent of a written assessment is to assess content and thinking alone; 2. teacher bias that may result in a general tendency to be
too generous or too severe; and
3. the effect, where a general impression or previous rating influences the present rating.
PRINCIPLES OF ASSESSMENT
Effective assessment depends on two main principles:
validity,
reliability
Validity refers to whether the assessment measures what it is
For example, it would not be valid to assess driving skills through a written test alone. A more valid way of assessing driving skills would be through a combination of tests that help determine what a driver knows, such as through a written test of driving knowledge, and what a driver is able to do, such as through a performance assessment of actual driving.
Teachers frequently complain that some examinations do not properly assess the syllabus upon which the examination is based; they are, effectively, questioning the validity of the exam.
Reliability refers to the accuracy, consistency and
repeatability of the assessment. A key component of reliability of assessment is consistency of marking. Discuss and agree your approach with the other markers before you commence. Set down the criteria for marking and Use a standard –well structured marking sheet. A fully structured marking scheme allocates a portion of marks to each of items/questions/criteria to be considered by the marker. Reliability in some cases is much depended on teaching subject. A history test written for high reliability will be entirely multiple choice. It isn't as good at measuring knowledge of history, but can easily be scored with great precision.
ITEM / TEST ANALYSES
Item Analyses
The purpose is to obtain more info on each item in order to determine the retention, deletion, or revision of items.
Two possible methods for analyzing items:
–
Item DifficultyItem Difficulty
Difficulty of a question measures by dividing the number of correct responses by the total number of responses. It ranges from 0 to 1 (0 being very difficult – with no one getting the answer correct and 1 meaning that all test-takers responded correctly) and can be calculated using the following formula:
D = R/N D = Difficulty
R = the number of candidates who gave the correct response to the question
N = total number of candidates
Recommended values for D vary.
Examples of acceptable parameters found in the literature are
0.2 to 0.9; 0.4 to 0.85 and 0.3 to 0.7
Example:
Let's consider you gave a multiple choice test and there were four answer choices (A, B, C, and D). The following table illustrates how many students selected each answer choice for Question #1 and #2.
Question A B C D
#1 0 3 24* 3
#2 12* 13 3 2
* Denotes correct answer.
parameters, this item could be regarded moderately easy -- lots (80%) of students got it correct.
Question #2 is much more difficult (12/30 = .40). In fact, on Question #2, more students selected an incorrect answer (B) than selected the correct answer (A). This item should be carefully analyzed to ensure that B is an appropriate distractor.
Item discrimination
Another measure, the Discrimination Index, refers to how well an assessment differentiates between high and low scorers. In other words, you should be able to expect that the high-performing students would select the correct answer for each question more often than the low-performing students.
If this is true, then the assessment is said to have a
positive discrimination index (between 0 and 1) -- indicating that students who received a high total score chose the correct answer for a specific item more often than the students who had a lower overall score. If, however, you find that more of the low-performing students got a specific item correct, then the item has a negative discrimination index (between -1 and 0).
Method I
D = (H-L)/N D = discrimination
H = number of correct responses to question by the top half of test scorers
L = number of correct responses to question by bottom half of test scorers
N = number of students in the sub-group
Example
Table 2.1 results of ten questions on a test
Student Total
Score (%)
Questions
1 2 3
Student 1 90 1 0 1
Student 2 90 1 0 1
Student 3 80 0 0 1
Student 4 80 1 0 1
Student 5 70 1 0 1
Student 6 60 1 0 0
Student 7 60 1 0 1
Student 8 50 1 1 0
Student 9 50 1 1 0
Student 10 40 0 1 0
"1" indicates the answer was correct; "0" indicates it was incorrect.
Follow these steps to determine the Difficulty Index and the Discrimination Index.
1. After the students are arranged with the highest overall scores at the top, count the number of students in the upper and lower group who got each item correct. For Question #1, there were 4 students in the top half who got it correct, and 4 students in the bottom half.
2. Determine the Difficulty Index by dividing the number who got it correct by the total number of students. For Question #1, this would be 8/10 or p=.80.
3. Determine the Discrimination Index by subtracting the number of students in the lower group who got the item correct from the number of students in the upper group who got the item correct. Then, divide by the number of students in each group (in this case, there are five in each group). For Question #1, that means you would subtract 4 from 4, and divide by 5, which results in a Discrimination Index of 0.
Table 2.2 Calculation of difficulty and discrimination
Item # Correct (Upper group)
# Correct (Lower
group) Difficulty (p) Discrimination (D)
Question 1 4 4 0.80 0
Question 2 0 3 0.30 -0.6
Question 3 5 1 0.60 0.8
Now that we have the table filled in, what does it mean? We can see that Question #2 had a difficulty index of 0.30 (meaning it was quite difficult), and it also had a negative discrimination index of -0.6 (meaning that the low-performing students were more likely to get this item correct). This question should be carefully analyzed, and probably deleted or changed. Our "best" overall question is Question 3, which had a moderate difficulty level (0.60), and discriminated extremely well (0.8).
How many of the items are of medium difficulty? These are the best, because they provide the most opportunity to discriminate (to see this, look at their maximum discrimination indexes in the first row of headings). Items that most everybody gets right or gets wrong simply can’t discriminate much.
The important test for an item’s discriminability is to compare it to the maximum possible. How well did each item discriminate relative to the maximum..? Here is a rough rule.
Discrimination index is near the maximum possible = very discriminating item.
Discrimination index is about half the maximum possible = moderately discriminating item.
Discrimination index is about a quarter the maximum possible = weak item
Discrimination index is near zero = non-discriminating item. Discrimination index is negative = bad item (delete it if worse than -.10)
Method II
test-scorers (ranked according to their overall score on the assessment).
D = (H-L)/N D = discrimination
H = number of correct responses to question by the top third of test scorers
L = number of correct responses to question by bottom third of test scorers
N = number of students in the sub-group
If a test is taken by 90 students and 25 students in the top third answer the question correctly while only 10 students in the bottom third respond correctly, the discrimination of the question would be:
D = (25-10)/30 D = 15/30 D=1/2 or 0.5
Discrimination scores range from -1 to +1. Positive scores of above +.2 (a generally accepted lower bound) indicate a good discrimination and negative scores indicate a question with a poor discrimination. Questions with a negative discrimination should be eliminated.
Item analysis worksheet - example
Table 3.1 Students’ scores
Student Name
Total Score (%)
Questions
1 2 3 4 5 6 7 8 9 10
Student 1 100 1 1 1 1 1 1 1 1 1 1
Student 2 90 1 1 1 1 1 1 1 1 0 1
Student 3 80 1 1 0 1 1 1 1 1 0 0
Student 4 70 0 1 1 1 1 1 0 1 0 1
Student 5 70 1 1 1 0 1 1 1 0 0 1
Student 6 60 1 1 1 0 1 1 0 1 0 0
Student 7 60 0 1 1 0 1 1 0 1 0 1
Student 8 50 0 1 1 1 0 0 1 0 1 0
Student 9 40 1 1 1 0 1 0 0 0 0 1
Student 10 30 0 1 0 0 0 1 0 0 1 0
Calculate the Difficulty Index (p) and the Discrimination Index (D) for each question.
Answer the following questions: 1.Which question was the easiest?
2. Which question was the most difficult? 3. Which item has the poorest discrimination?
4. Which questions would you eliminate first (if any) – why?
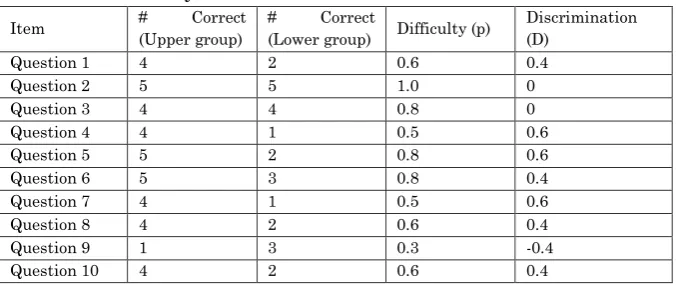
Table 3.2 difficulty and discrimination
Item # Correct (Upper group)
# Correct
(Lower group) Difficulty (p)
Discrimination (D)
Question 1 4 2 0.6 0.4
Question 2 5 5 1.0 0
Question 3 4 4 0.8 0
Question 4 4 1 0.5 0.6
Question 5 5 2 0.8 0.6
Question 6 5 3 0.8 0.4
Question 7 4 1 0.5 0.6
Question 8 4 2 0.6 0.4
Question 9 1 3 0.3 -0.4
Question 10 4 2 0.6 0.4
Answer the following questions:
1.Which question was the easiest? Question #2 (p=1.0)
3. Which item has the poorest discrimination? Question #9 (D=-0.4 – it has negative discrimination – the lower students were more likely to get it correct)
4. Which questions would you eliminate first (if any) – why? Question #9 – because of the negative discrimination.
Guessing: If students can easily discount one or more distractors then the chance of guessing is increased, reducing the discriminability of that item.
Frequency analysis – This measures the number of times a choice or alternative was selected. If certain distracters are rarely chosen, they may be ineffective and you should consider replacing them with more challenging alternatives.
Test Revision
•
Assess strengths and weaknesses of items•
Modificate on the basis of the analyses•
Review purpose of the test to determine any modificationsREFERENCE
1. Lacy Gainey, Formative, Summative, and Performance Assessments, Fall 2013
2. Jamin Carson: A Problem With Problem
Solving:Teaching Thinking Without Teaching
Knowledge; The Mathematics Educator, Vol. 17, No. 2, 7–14, 2007.
3. Patricia Broadfoot, University of Bristol:Assessment in Education-Principles, Policy &Practise, Vol.6, 1999. 4. Patricia Broadfoot, University of Bristol:Assessment in
Education-Principles, Policy&Practise, Vol.7, 2000. 5. Allal, L. & Pelgrims Ducrey, G. Assessment of—or in—
the zone of proximal development. Learning and
6. Black, P. J. & Atkin, J. M. (Eds.). Changing the subject: innovations in science, mathematics and technology education, London, UK: Routledge, 1996,.
7. Day, J. D. & Cordon, L. A. Static and dynamic measures of ability: an experiemntal comparison. Journal of Educational Psychology, 85(1), 76-82, 1993.
8. Black, P.J. Formative and summative assessment by teachers. Studies in Science Education, 21, 49-97, 1993. 9. Black, P.J., & Wiliam, D.. Assessment and classroom
learning. Assessment in Education, 5(1), 7-73, 1998.
10.Brown, M. Graded assessment and learning hierarchies
in mathematics: an alternative view. British
Educational Research Journal, 15(2), 121-128, 1989. 11.Carnoy, M., & Loeb, S. Does external accountability