ISSN (Print) : 2320 – 3765 ISSN (Online): 2278 – 8875
I
nternational
J
ournal of
A
dvanced
R
esearch in
E
lectrical,
E
lectronics and
I
nstrumentation
E
ngineering
(A High Impact Factor, Monthly, Peer Reviewed Journal) Website: www.ijareeie.com
Vol. 7, Issue 6, June 2018
Review of Multisensor Data Fusion (MSDF)
Modelling and Techniques: Applications on
Autonomous Underwater Vehicle (AUV) For
Marine Operation Environment
K.Chithra1, C.Kamaraj2
Assistant Professor, Department of Electronics and Instrumentation Engineering, PSN College of Engineering and
Technology (Autonomous), Tirunelveli, Tamilnadu, India1
Professor and Head, Department of Marine Engineering, PSN College of Engineering and Technology (Autonomous),
Tirunelveli, Tamilnadu, India2
ABSTRACT: A key problem with autonomous underwater vehicle (AUV) navigation is being able to navigate in a generally unknown environment. The available underwater sensor suites have a limited capability to cope with such an underwater problem. In practice, no single sensor in the underwater environment can provide the level of accuracy, reliability, robustness, increased confidence, enhanced resolution and the extended coverage of information necessary to perform underwater navigation. The multisensor data fusion (MSDF) technique has four different level of date representation: single level fusion, pixel level fusion, feature level fusion and symbol level fusion. Therefore there is a need to use a number of sensors and combine their information to provide the necessary navigation capability in a synergetic manner. The aim of this research paper is to survey previous work and recent development in AUV navigation and to introduce MSDF techniques as a means of improving the AUV's capability.
KEYWORDS: MultiSensor Data Fusion (MSDF), Autonomous Underwater Vehicle (AUV), Automatic Target Cueing (ATC), Sensor Models
I. INTRODUCTION
ISSN (Print) : 2320 – 3765 ISSN (Online): 2278 – 8875
I
nternational
J
ournal of
A
dvanced
R
esearch in
E
lectrical,
E
lectronics and
I
nstrumentation
E
ngineering
(A High Impact Factor, Monthly, Peer Reviewed Journal) Website: www.ijareeie.com
Vol. 7, Issue 6, June 2018
One class of this marine environment is tethered and remotely operated and referred to as remotely operated vehicles (ROVs). Extensive use of ROVs is currently limited to a few applications because of very high operational costs, uncertainty, lower resolution and the need for human presence in conducting a mission. The demand for a more sophisticated underwater robotic technology that minimizes the cost and eliminates the need for human operator and is therefore capable of operating autonomously becomes the underwater vehicle apparent. These requirements led to the development of autonomous underwater vehicles (AUVs). To achieve truly autonomous behavior, an AUV must be able to navigate accurately within an area of operation and representation. In order to achieve this, an AUV needs to employ a navigation sensor with a high level of accuracy, accuracy, reliability, robustness, enhanced resolution and the extended coverage.
However, in practice, as will be discussed in the next section, a single sensor alone may not be sufficient to provide an accurate and reliable navigation system, as it can only operate efficiently under certain conditions or it has an inherent limitation when operating in underwater environments. It is therefore necessary to use a number of sensors and combine their information to provide the necessary navigation capability. To achieve this, a multisensor data fusion (MSDF) approach, which combines data from multiple sensors and related information from associated databases, can be used.
II. MULTISENSOR DATA FUSION
ISSN (Print) : 2320 – 3765 ISSN (Online): 2278 – 8875
I
nternational
J
ournal of
A
dvanced
R
esearch in
E
lectrical,
E
lectronics and
I
nstrumentation
E
ngineering
(A High Impact Factor, Monthly, Peer Reviewed Journal) Website: www.ijareeie.com
Vol. 7, Issue 6, June 2018
The uncertainties in sensors not only arise from the impreciseness and noise in the measurements, but are also caused by the ambiguities and inconsistencies in the environment, and inability to distinguish between them. The strategies used to fuse the data from these sensors should be able to eliminate such uncertainties, take into account the environmental parameters that affect sensor measurements, and fuse different nature of information to obtain a consistent description of the environment. To fusion based data from multiple sensory sources can be classified into three categories: Fusion based on probabilistic methods, Fusion based on least-squares techniques, and Fusion based on intelligent methods. All of these methods differ in the manner they try to model the uncertainties inherent in the sensor measurements. The research carried out in this project combines two different kinds of sensing modalities to obtain three-dimensional occupancy profiles of a robotic workspace. The first modality is two vision sensors mounted on a stereo rig, and the second one is an Infra-Red (IR) proximity sensor.
III. SENSOR MODELS
Sensor modeling deals with developing an understanding of the nature of measurements provided by the sensor, the limitations of the sensor, and probabilistic understanding of the sensor performance in terms of the uncertainties. The information supplied by a sensor is usually modeled as a mean about a true value, with uncertainty due to noise represented by a variance that depends on both the measured quantities themselves and the operational parameters of the sensor. A probabilistic sensor model is particularly useful because it facilitates the determination of the statistical characteristics of the data obtained. This probabilistic model is usually expressed in the form of probability density function (p.d.f.) p (z|x) that captures the probability distribution of measurement by the sensor (z) when the state of the measured quantity(x) is known. This distribution is extremely sensor specific and can be experimentally determined. The standard deviation of the distribution is a measure of the uncertainty of the data provided by sensors. Gaussian distribution is one of the most commonly used distributions to represent the sensor uncertainties and is given by the following equation:
P(z x⁄ ) = 1
σ√2πe
( ) σ
1. MAXIMUM LIKELYHOOD MODEL PARAMETERS
Maximum Likelihood (ML) method is the procedure for finding the value of two or more parameters for a given statistical data which maximizes the known likelihood distribution. If Gaussian distribution is considered, the distribution representing the sensor model is given by:
z
σ, x = 1
σ√2πe
( ) σ
Where,
D - Represents the data (z x )
σ - Standard deviation of the distribution(Θ =σ)
L(Θ) =∏
σ√ πe
( ) σ )
L(Θ) = 1
σ (2π) e
∑ ( ) σ
ISSN (Print) : 2320 – 3765 ISSN (Online): 2278 – 8875
I
nternational
J
ournal of
A
dvanced
R
esearch in
E
lectrical,
E
lectronics and
I
nstrumentation
E
ngineering
(A High Impact Factor, Monthly, Peer Reviewed Journal) Website: www.ijareeie.com
Vol. 7, Issue 6, June 2018
based on heuristics. Many feature extraction algorithms include goodness-of-fit function that can be investigated to observe the correlation with sensor output. It might be difficult, if not impossible, to obtain the mathematical model relation, and in the absence of such mathematical relation, model based statistical approach would be difficult to use. In this research work, the universal approximation capabilities of neural networks have been used to establish this correspondence.
2. NEURAL NETWORK BASED SENSOR MODELS
Mostly effective for solving complex problems that do not have an analytical solution, in this analytical solution is too difficult to be found. Currently, they are being applied in many real world problems. Neural Network (NN) has effectively used for sensor fusion techniques. Neural network has three layers: one input layer, one output layer and one hidden layer. Hidden layer having sufficient nodes and a sigmoid transfer function, for linear transfer function in input and output layer are considered to be universal approximations. In this research work, a three-layered NN has been formulated to obtain the correspondence between the standard deviation σ of Gaussian distribution and the parameter which affects sensor’s performance. The output of a typical three-layered NN is given by:
σ= NNET(I, W, B)
(OR)
σ= f W f W I + b + b
(i = 1,2,3 … … … n )
Where,
NNET – Neural network
I – Vector representing input parameter W – Weighted matrix
B – Bias matrix
l – Total number of nodes in hidden layer n – Total number of inputs
m – Total number of outputs w – Weight
b – Bias of the network
f(x) – Activated function associated with nodes
I – Input to the neural network
The weights and biases can be found by the gradient descent method or via evolutionary strategies. The neural network was trained from 750 data points obtained, and tested with the help of a separate set consisting of 700 data points. Neural Network based modeling method promises to provide statistically more optimal and accurate results.
3. MODELING OF STEREO VISION SENSORS
ISSN (Print) : 2320 – 3765 ISSN (Online): 2278 – 8875
I
nternational
J
ournal of
A
dvanced
R
esearch in
E
lectrical,
E
lectronics and
I
nstrumentation
E
ngineering
(A High Impact Factor, Monthly, Peer Reviewed Journal) Website: www.ijareeie.com
Vol. 7, Issue 6, June 2018
Score(P , P ) = ∑ ∑ I (u + i, v + j)−I (u , v ) I (u + i, v + j)−I (u , v ) (2n + 1)(2m + 1) σ I ×σ I
Where,
L – Left side image R – Right side image
I - Intensity matrix of left image
I – Intensity matrix of right image K=L, R (Average value of intensity)
The score of template size: (2n + 1)(2m + 1)
Score images: from -1 to +1
-1 Not similar +1 Similar
The error represents the absolute error between the actual three dimensional location of a point and that obtained from the stereo vision. A negative correlation value represents that when correlation score is large and the error is very small, which logically follows from the fact that larger correlation score means better stereo match and estimation of three dimension positional information.
4. MODELING OF PROXIMITY SENSORS
The output of the Infrared proximity sensor is an analog voltage which is indicative of the distance of the object detected by the sensor. In order to calibrate the Infrared sensor readings, 750 data points, comprising of sensor output values in volts and actual distance to the sensed object in mm were taken. The calibration was obtained via neural network which accepted sensor output in volts as input and provided distance in mm as output. In this research project, the model of the Infrared sensor attempts to capture this dependence of uncertainty on the distance to the object. Since the output of the sensor is indicative of the distance, this investigation makes use of neural network technique outlined in previous section to capture the relationship between sensors uncertainties and sensor output. In this method has been used to obtain models of infra-red proximity sensor and vision sensors in stereo configuration.
IV. SENSOR FUSION TECHNIQUES
The common fused representation may range from a low-level probability distribution for statistical inference to high level logical proposition used in production rules for logical inference. The multisensor data fusion (MSDF) technique has four different level of date representation: single level fusion, pixel level fusion, feature level fusion and symbol level fusion. First, each sensor makes an independent report based on its own observations or features. The process of automatic target cueing may consist of only the first stage of detection or may incorporate the second stage of target discrimination (false alarm reduction) for each of the sensors before the individual decisions are made. Thus, a list of candidate targets is independently generated from each sensor. This preliminary detection hypothesis is a soft decision. The combined hypothesis space is focused only on candidate targets that appear in both image domains. This results in a significant reduction in the number of hypotheses for subsequent processes. It also simplifies the geolocation/registration process, since there is only a need to associate cues.
1. SINGLE LEVEL MSDF
ISSN (Print) : 2320 – 3765 ISSN (Online): 2278 – 8875
I
nternational
J
ournal of
A
dvanced
R
esearch in
E
lectrical,
E
lectronics and
I
nstrumentation
E
ngineering
(A High Impact Factor, Monthly, Peer Reviewed Journal) Website: www.ijareeie.com
Vol. 7, Issue 6, June 2018
Single level sensor fusion produces a single output by combining information from a set of source outputs together, using pixel, and feature or decision level techniques. The fused output contains greater information content for the scene than any one of the individual image sources alone. The reliability and overall detail of the image is increased, because of the addition of analogous and complementary information. Image fusion requires that images be registered first before they are fused.
By single data fusion at the lowest processing level the measured point data from the sensors (3D Cartesian coordinates) is fused. For that the points are fed into a joint segmentation. This merging segmentation process does not differ from the single level sensor segmentation. In order to make the segmentation independent from the sensor type, only the spatial information from the points is used discarding the image information from the stereo camera. Based on the segmentation approach described in an additional sensor specific segmentation model and an error model for the point information are taken into account.
2. PIXEL LEVEL FUSION
Pixel level fusion is the combination of the raw data from multiple source output into a single output with greater information content. The fused images can be modeled as a realization of a stochastic process across the output, with the fusion process considered as an estimation procedure. In order for pixel-level to be feasible, the data provided by each sensor must be able to be registered at the pixel-level and, in most cases, must be sufficiently similar in terms of its resolution and information content. In a multi-sensor environment, pixel level fusion can generate a fused image that provides the best description of a scene. Each sensor provides complementary information that can be combined together into a fused image. Fused images can be used by other algorithms for further processing, such as for target detection or tracking. Fused images are also ideal for human end users, who cannot easily visualize and combine the results from multiple sensors.
For the pixel level fusion, called mid-level fusion, the incoming object hypotheses are determined either directly in the sensor or in a subsequent processing unit. As a result a new object hypothesis is generated by a weighted fusion of the incoming objects from the involved sensors. At first all corresponding objects mapping the same real object are associated with each other within a clustering. Based on contradictory sensor assignments within the object clusters segmentation errors can be detected.
3. FEATURE LEVEL FUSION
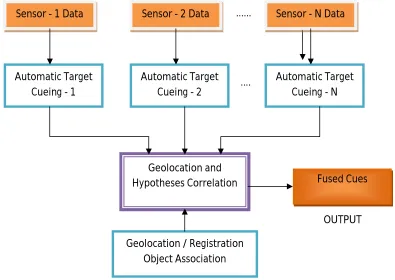
Feature level fusion, it can be stated that with an increasing data processing, the accuracy of the object determination is decreasing. On the other side errors made in lower process steps can be caught at higher processing steps. There are two practical feature level fusion techniques (hybrid fusion and cued fusion) for automatic target cueing that combine features derived from each sensor data at the object-level. In the feature level fusion method each of the input sensor data is prescreened (i.e. Automatic Target Cueing (ATC) is performed) before the fusion stage. The cued fusion method assumes that one of the sensors is designated as a primary sensor, and thus ATC is only applied to its input data. If one of the sensors exhibits a higher or a lower false alarm rate, it can be selected as the primary sensor. However, if the ground coverage can be segmented to regions in which one of the sensors is known to exhibit better performance, then the cued fusion can be applied locally/adaptively by switching the choice of a primary sensor. Otherwise, the cued fusion is applied both ways (each sensor as primary) and the outputs of each cued mode are combined. Both fusion approaches use a back-end discrimination stage that is applied to a combined feature vector to reduce false alarms. The two fusion processes were applied to spectral and radar sensor data and were shown to provide substantial false alarm reduction. The approaches are easily extendable to more than two sensors. Figure 4 illustrate the Feature level fusion block diagram
ISSN (Print) : 2320 – 3765 ISSN (Online): 2278 – 8875
I
nternational
J
ournal of
A
dvanced
R
esearch in
E
lectrical,
E
lectronics and
I
nstrumentation
E
ngineering
(A High Impact Factor, Monthly, Peer Reviewed Journal) Website: www.ijareeie.com
Vol. 7, Issue 6, June 2018
Therefore the sensor data, taken from one time step, is fused independently on pixel and feature level fusion. Afterwards the actual track states are mapped from the high on the object hypotheses of the pixel level. Thus detected conflicts on multi level can confirm or rejected by comparing them with the results of the pixel level conflict detection.
Figure 3: Feature level fusion block diagram
The key to the success of the two data fusion approaches is the feature-level fusion process as described in the previous section. The most important part of the feature-level fusion process is the selection of features for both spectral and SAR imagery that are used for target/clutter discrimination and to mitigate the effects of registration error. The features can be grouped into three main categories: statistics-based, fractal-based and correlation-based. The statistics-based features generally use amplitude-based statistics to characterize the detected area. Fractal-based features estimate the fractal/no-fractal behavior. The correlation-based features measure the level of spatial correlation of targets and clutter. These features are combined into a single feature vector that is passed to the pretrained classifier to eliminate/reduce false alarms.
V. HYBRID FUSION
Figure 4 illustrates the hybrid fusion architecture. First, each sensor makes an independent report based on its own observations or features. The process of automatic target cueing may consist of only the first stage of detection or may incorporate the second stage of target discrimination (false alarm reduction) for each of the sensors before the individual decisions are made. Thus, a list of candidate targets is independently generated from each sensor. This preliminary detection hypothesis is a soft decision. The combined hypothesis space is focused only on candidate targets that appear in both image domains. This results in a significant reduction in the number of hypotheses for subsequent processes. It also simplifies the geolocation/registration process, since there is only a need to associate cues. This approach is applicable only if the probability of detection is high in each sensor domain; otherwise the probability of detection will be driven by the lowest performing sensor. If the false alarms are not correlated in terms of location, a substantial reduction will be achieved based only on geolocation. However, even if the false alarms correlate in terms
PNN Classifier
Ground Truth Information
Feature Extraction Hyperspectral
Image
SAR Image Detection
Coordinates
Feature Library
Detections
ISSN (Print) : 2320 – 3765 ISSN (Online): 2278 – 8875
I
nternational
J
ournal of
A
dvanced
R
esearch in
E
lectrical,
E
lectronics and
I
nstrumentation
E
ngineering
(A High Impact Factor, Monthly, Peer Reviewed Journal) Website: www.ijareeie.com
Vol. 7, Issue 6, June 2018
of position, a substantial reduction is still achievable if the extracted features decorrelate. In this case the joint distribution of the extracted features will provide better separability (target/clutter) than each feature set alone.
There are three cases to be considered in hybrid fusion,
Case 1: No detection is generated in the combined hypothesis space when detection is reported in one image but no detection is reported within the uncertainty region in the other image.
Case 2: If a single detection is reported within the uncertainty region of the other image, the features from both sensors are combined to determine the object classification.
Case 3: If multiple detections are reported within the uncertainty region, the ambiguities are resolved through data association). To determine the one detection report that best matches the report from the other sensor. More specifically, use the object discrimination/classification process to determine the correct data association.
For example, if for a single detection in the spectral image there are three detections reported in the SAR uncertainty region. A feature vector is generated for all of the three SAR objects. Another set of features is generated for the single object in the spectral image domain. These features are combined with each of the three SAR feature vectors to form three distinct combined feature vectors. Each of these feature vectors is examined by the pre-trained target/clutter classifier to determine if any of them exhibits target-like characteristics. If all of them are classified as clutter, the detection cue generated at this location is rejected as a false alarm. Otherwise, detection is retained with the corresponding combined set of features that exhibited the strongest target-like behavior.
……
…. …. …. ……
…. ……
….
Sensor - 1 Data Sensor - 2 Data Sensor - N Data
Automatic Target Cueing - 1
Automatic Target Cueing - 2
Automatic Target Cueing - N
Geolocation and Hypotheses Correlation
Geolocation / Registration Object Association
Fused Cues
OUTPUT ……
….
ISSN (Print) : 2320 – 3765 ISSN (Online): 2278 – 8875
I
nternational
J
ournal of
A
dvanced
R
esearch in
E
lectrical,
E
lectronics and
I
nstrumentation
E
ngineering
(A High Impact Factor, Monthly, Peer Reviewed Journal) Website: www.ijareeie.com
Vol. 7, Issue 6, June 2018
VI. CUED FUSION
Cued fusion (Figure 5) designates one sensor as the primary sensor and utilizes the second sensor for false alarm reduction. In this mode of fusion, the data of the primary sensor is used to derive an initial set of target cues, a set of associated features/attributes and the level of confidence based on the primary sensor data. Since ATC is performed only in the primary sensor domain, the corresponding image location for each target cue in the other sensor domain is estimated by automated geolocation/registration processes. A set of target features is derived from the estimated target location and combined with the attributes extracted from the primary sensor. The combined set of features is passed to a classifier that is trained on the joint distribution. A final decision is made by combining the estimated target confidence derived from the primary sensor and the confidence based on the joint set of features. The cued fusion requires either better geolocation accuracy than the hybrid approach or an alternate mechanism for refining geolocation.
Figure 5: Cued sensor fusion architecture
In cued-level fusion, cannot use the object discrimination approach to correct for geolocation errors, since it performs ATC only on the primary sensor. Normally, this approach requires very accurate geolocation in order for the feature-level fusion process to perform well. If the transformed coordinates of the object in the primary image have a large geolocation error, the extracted features from the derived coordinates may not correspond to the detected object in the primary image. The larger the registration error, the worse the feature representation. However, it is possible to refine the initial estimate (within the error basket) using contrast. This approach has been evaluated under the MSET program and demonstrated that no significant degradation occurred with reasonable registration errors.
Sensor - 1 Data Sensor - 2 Data
OUTPUT Fused Cues Multisensor target
(Confidence and Combination) Object classification
using multisensory fusion data Automatic Target
Cueing
Cross sensor Geolocation
Feature Extraction
Sensor - 1 Data Sensor - 2 Data
OUTPUT Fused Cues Multisensor target
(Confidence and Combination) Object classification
using multisensory fusion data Automatic Target
Cueing
Cross sensor Geolocation
Feature Extraction
ISSN (Print) : 2320 – 3765 ISSN (Online): 2278 – 8875
I
nternational
J
ournal of
A
dvanced
R
esearch in
E
lectrical,
E
lectronics and
I
nstrumentation
E
ngineering
(A High Impact Factor, Monthly, Peer Reviewed Journal) Website: www.ijareeie.com
Vol. 7, Issue 6, June 2018
REFERENCES
[1] Jos Elfring, “EffectiveWorld Modeling: Multisensor Data Fusion Methodology for Automated Driving”, Sensors 2016.
[2] Asgeir J. Sørensen and Martin Ludvigsen, “Towards Integrated Autonomous Underwater Operations” IFAC - Papers OnLine 48-2 (2015) 107–118.
[3] D Loebis, R Sutton and J Chudley, “Review of multisensor data fusion techniques and their application to autonomous underwater vehicle navigation”, Journal of Marine Engineering & Technology,2012, ISSN: 2046-4177
[4] M. Haberjahn and M. Junghans, “Vehicle environment detection by a combined low and mid level fusion of a laser scanner and stereo vision,” in Proc. 14th International IEEE Conference on Intelligent Transportation Systems, Washington DC, USA, 5.-7. Oct. 2011. [5] Yoerger, D.R., Jakuba, M., Bradley, A.M., 2007b. Techniques for deep sea near-bottom survey using an autonomous underwater vehicle.
International Journal of Robotics Research 26, 41–54.
[6] Bovio, E., Cecchi, D., Baralli, F., 2006. Autonomous underwater vehicles for scientific and naval operations. Annual Reviews in Control 30, 117–130.
[7] Gadeyne, K. BFL: Bayesian Filtering Library. Available online: http://www.orocos.org/bfl (accessed on 10 October 2016).
[8] Michael, V. Jakuba., 2003. Modeling and Control of an Autonomous Underwater Vehicle with Combined Foil/Thruster Actuators, Massachusetts Institute of Technology, pp.33-62.
[9] Sousa, J. B. (2010). Concepts and tools for coordination and control of networked ocean-going vehicles. Autonomous Underwater Vehicles (AUV), IEEE/OES, CA, US.
[10] Maybeck, P. S., Stochastic Models, Estimation and Control, Volume 1, Academic Press, Inc., 1979.