ISSN (Print) : 2320 – 3765 ISSN (Online): 2278 – 8875
I
nternational
J
ournal of
A
dvanced
R
esearch in
E
lectrical,
E
lectronics and
I
nstrumentation
E
ngineering
(An ISO 3297: 2007 Certified Organization)
Vol. 5, Issue 4, April 2016
An Automated Method for Counting of Red
Blood Cells Using Image Processing
Dishant Mehta1, Sharvil Panandikar2, Omkar Prabhu3, Amey Chindarkar4, Naveeta Kant5
Student, Dept of Electronics, V.E.S Institute of Technology, Mumbai, Maharashtra, India 1
Student, Dept of Electronics, V.E.S Institute of Technology, Mumbai, Maharashtra, India 2
Student, Dept of Electronics, V.E.S Institute of Technology, Mumbai, Maharashtra, India 3
Student, Dept of Electronics, V.E.S Institute of Technology, Mumbai, Maharashtra, India 4
Assistant Professor, Dept of Electronics, V.E.S Institute of Technology, Mumbai, Maharashtra, India.5
ABSTRACT: The paper proposes an automated method for counting of red blood cells using image processing techniques. The traditional methods of blood analysis involve the manual counting of blood cells observed under the microscope. This method poses large dependency on the skills of the laboratory technician and can cause errors. The automated haematology analysers, on the other hand, produce accurate results. However, these equipments are very costly and difficult to move once installed. They require trained experts to operate this equipment. The proposes method provides a low cost and portable solution for obtaining the red blood cell count using a image processing algorithm that works on the images captured by a microscope with considerable accuracy. The method minimizes the cost of the equipment while promoting mobility of the device for relocation to remote parts for pathological tests.
KEYWORDS: Bloodcell count; Image processing; Thresholding; Mathematical morphology
1. INTRODUCTION
Pathology is the field of investigation of samples collected from the individual to provide proof for diagnosis in the medical field. It involves the detection of pathogens or harmful foreign particles present in the sample for providing important proof for further treatment of the diseases. A pathologist collects the samples and processes it using the laboratory equipment to generate a report based upon the results of the test. Frequently performed tests such as blood test, test for blood sugar, etc. also undergo the same process. The equipment currently available with the pathologist is the haemocytometer or the haematology analysers. This equipment is bulky and highly expensive. Even though they provide reasonable accuracy, the cost of the equipment is so high that many pathologists come together to purchase a single analyser machine.
The problem statement of the project is to define a system which answers the hurdles present in the field of pathology. The system especially focuses on the rural parts and the remote village areas were the situation is much more acute than in the urban areas. The system should manage the cost of the currently available systems which is refraining the pathologists from approaching these areas and improve the services. Medical laboratories provide confirmation of clinical diagnoses, facilitate improved management of diseases, generate essential public health information and with adequate government funding [3].
ISSN (Print) : 2320 – 3765 ISSN (Online): 2278 – 8875
I
nternational
J
ournal of
A
dvanced
R
esearch in
E
lectrical,
E
lectronics and
I
nstrumentation
E
ngineering
(An ISO 3297: 2007 Certified Organization)
Vol. 5, Issue 4, April 2016
In this regard, the paper presents an automated method, which counts the RBCs present in a blood sample.An image involves some unwanted particles (noise). Therefore, some pre-processing is neededwhich is called image preparation phase. The image preparation is done as follows: The first step is to convert the image from RGB color space to gray scale image then, this gray scale image is converted into binary image by applying thresholding method. Then, all the non-peripheral holes are filled in this binary image followed by smoothing. The next step is to fill the peripheral holes and finally, a hole less image is produced. From this hole less image, each cell is extracted and categorized. After the image is prepared properly after filtering and image processing techniques, finally, the total number of cells in the image is counted.
II. LITERATURE SURVEY
The project aims at providing a portable and low cost solution for pathology porcesses especially for blood tests for counting the erythrocytes present in the specified volume of blood. Literature releated to the proposed work shows proof for supporting the problem statement with appropriate statistical data. Results of blood analysis not only have an important clinical significance to the observation of the diagnosis of the disease and the observation of curative effect, but also give a reference for human health assessment [1].Blood analysis in rural areas poses a major hurdle in the field of medicine and point of care treatment.A paradigm shift from the current ‘biomedical model’ to a ‘sociocultural model’ is required, to meet the needs of therural population [4].
III. PROPOSED METHODLOGY
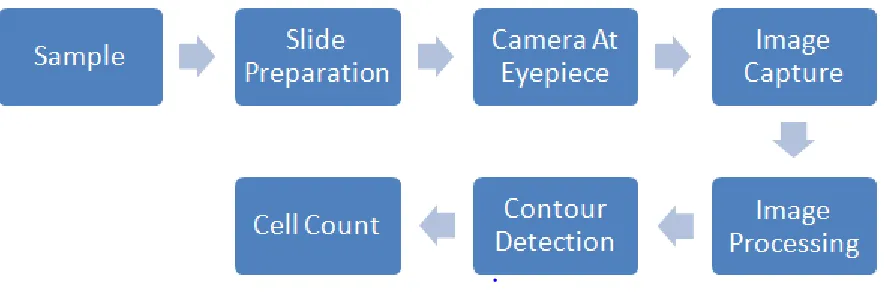
Fig. 1: Block diagram of the proposed method
The system is designed to obtain images from the blood samples. Smear of the blood samples are prepared and kept under the objective lens of a microscope. The microscope is fitted with a camera that can take suitable images and load them into the processing unit. The processing unit possesses the image processing software which processes the images to extract information about the count of the red blood cells present in the samples.
ISSN (Print) : 2320 – 3765 ISSN (Online): 2278 – 8875
I
nternational
J
ournal of
A
dvanced
R
esearch in
E
lectrical,
E
lectronics and
I
nstrumentation
E
ngineering
(An ISO 3297: 2007 Certified Organization)
Vol. 5, Issue 4, April 2016
After acquiring the image, it needs to be pre-processed before the information is extracted. Techniques such as low pass filtering, median filtering need to apply for reducing the redundancy and noise, if present, from the image. These techniques provide an image suitable for the further processing.
The Python IDLE and the open source OpenCV library is used for image processing. It is an open source platform that provides numerous functions for image processing. These functions can be modified depending on various parameters that the function uses for processing.
In our application, automatic area classification is a preprocessing step before further accurate and detailed cell enumeration and analysis [2].
A. Reading the image
The image that is captured from the camera mounted microscope is stored in a directory that can be directly accessed by the python and OpenCV.
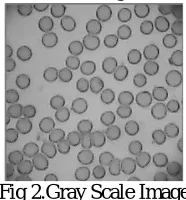
B. Converting to Grey Scale Image
The image obtained is a color image which has all the three RGB components. It needs to be converted to grey scale images.In order to process a blood cell image, conversion ofthe colour image into the grey value is required becauseof converting three intensities level to single intensity level [8].
Fig 2.Gray Scale Image
C. High Pass Filtering
The edges of the cells in the image need to be enhanced for detection of the change n the intensity of the grey levels inside and outside the cell and the background of the image.
Fig 3. High Pass Filtered Image
D. Canny Edge Detection
The high pass filtered image is passed through the canny edge detection algorithm which detects the edges of the cells. It includes many subfunctions involving double thresholding, differentiation of the image based on the change in the intensity and avoiding the false edges. The secondary edges in the image are obtained by using connected components methodology.
ISSN (Print) : 2320 – 3765 ISSN (Online): 2278 – 8875
I
nternational
J
ournal of
A
dvanced
R
esearch in
E
lectrical,
E
lectronics and
I
nstrumentation
E
ngineering
(An ISO 3297: 2007 Certified Organization)
Vol. 5, Issue 4, April 2016
E. Closing Morphological Operation
Closing is Dilation followed by Erosion. It is useful in closing small holes inside the foreground objects and the small points on the image. This is useful for connecting the small gaps present in the edges of the cells.
Fig 5 Closing Morphology Image
F. Contouring The image
Contours are closed regions in the image which are obtained by the canny edge detection algorithm. These contours are found in the image, which indirectly represent the cells present in the image. The basic idea of the red blood cells counting was to use three major techniques which arelogical, morphology and contour detection [10]..
IV. IMPLEMENTATION
Camera:
The camera used for the capturing of image of Red Blood Cells on slide is a simple webcam (iballRobo K20) with resolution of 10.2 MP. The camera is connected to the processing unit i.e. computer which acquires the image which is to be used to generate final result. The field of view of camera is about 1mm X 1mm on the actual glass slide. Slight focussing is required before capturing of image. Focussing is done by adjusting the microscope so that the clear image will appear on the screen. Obtaining a clear image is very important as it involves the qualitative as well as quantitative information about the blood cells. Also the efficient implementation image processing algorithm depends on the quality of image. As the focussing is done, the user will run the program which also includes capturing of image automatically. The captured image is then processed using different image processing techniques. The camera vision is implemented for the task of counting of Red Blood Cells which is similar to the case in which a skilled person viewing the RBC slide through eyepiece of microscope and counting the blood cells manually using his/her expertise.
Fig 6. Web Camera
Microscope:
ISSN (Print) : 2320 – 3765 ISSN (Online): 2278 – 8875
I
nternational
J
ournal of
A
dvanced
R
esearch in
E
lectrical,
E
lectronics and
I
nstrumentation
E
ngineering
(An ISO 3297: 2007 Certified Organization)
Vol. 5, Issue 4, April 2016
Fig 7. Microscope
OpenCV:
The image processing is done using programming language Python and Open CV. Open CV is the library through which different image processing blocks are imported to the Python Idle which is a programming environment. It consists of many inbuilt image processing functions. Python programming environment is very flexible.
V. WORKING
After preparing the blood smear of the blood samples on the slide the image is processed. The processing is done using the OpenCV library in the Python IDLE interface. Based on the algorithm the image is processed using various image processing techniques. The magnification of the microscope ensures that the RBCs are visible and image processing is possible on it. To ensure that proper counting of RBCs is done the image is first converted from RGB to Grey scale. But the image obtained after Grey scaling is not so sharp and hence, it is further subjected to High pass filtering where sharp images of RBCs are obtained. Now in order to count the RBCs, various edge detection techniques can be used[6]. Canny Edge detection technique is used here which help in generation of contours which denote the shape of the cells and are counted based on the algorithm.
In image processing step the image is being enhanced in term of quality level to be prepared for the next process. It is because the produced image may have some artefacts andillumination issues [7].
Feature extraction is followed by morphologicaloperations, feature extraction also called descriptiondeals with extraction features that result in somequantitative information of interest of features that arebasic for differentiating one class of objects from another [9].The counting of RBCs in the area covered by field of view of camera is done by image processing algorithm. But the unit of actual count of the blood cells which appears on the report is millions / cm3. Therefore to obtain the now such samples are usually diluted with an anticoagulant liquid to separate the cells to decrease overlapping. In such cases we have to multiply the count by the dilution factor. Considering these factors the formula for RBC count becomes:
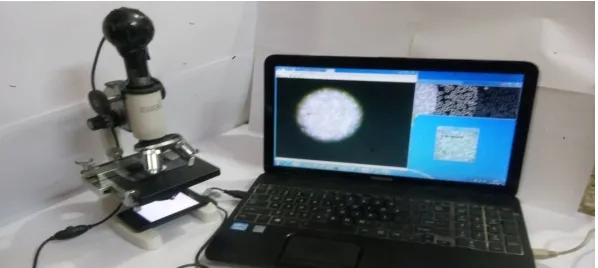
Fig 8Microscope Mounted With Web Camera Interfaced With Computer Showing Live Image Of RBCs Actual rbc count per cm3= (RBCs counted by image processing / ((input image area/(magnification
ISSN (Print) : 2320 – 3765 ISSN (Online): 2278 – 8875
I
nternational
J
ournal of
A
dvanced
R
esearch in
E
lectrical,
E
lectronics and
I
nstrumentation
E
ngineering
(An ISO 3297: 2007 Certified Organization)
Vol. 5, Issue 4, April 2016
VII. RESULTS
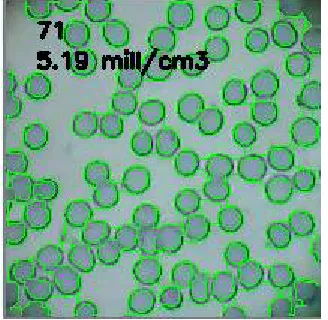
The results of the processed samples were verified with the count from the original sample. The original sample processed through haematology analyser showed a reading of 5.38 million cells per cm3 and the sample processed using the microscope assembly with image processing algorithm showed a count of 5.19 million per cm3. This shows that the proposed system has an error of 3.54% and an accuracy of 96% which is considerable taking into account the normal range of the RBC and the cost effectiveness of the proposed system.
Fig 9.Original Image of the cells
Fig 10 Image showing marked cells with count.
The count of the cells obtained from the image is averaged and interpolated to obtain the final count of the RBCs present in 1 cubic centimetre volume of blood. Different Algorithms for detecting the blood cells from the image were tested. The algorithm which suited the most was utilized for increasing the efficiency of the system.
ISSN (Print) : 2320 – 3765 ISSN (Online): 2278 – 8875
I
nternational
J
ournal of
A
dvanced
R
esearch in
E
lectrical,
E
lectronics and
I
nstrumentation
E
ngineering
(An ISO 3297: 2007 Certified Organization)
Vol. 5, Issue 4, April 2016
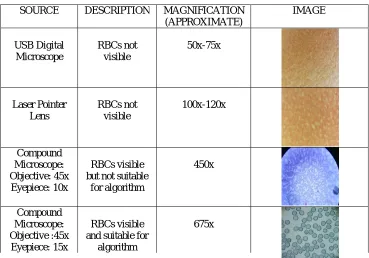
Table 1 : Comparison of different lenses and their magnification with images.
VIII. CONCLUSION
As a conclusion, this research successfully uses various image processing techniques for Red Blood Cell Estimation. It utilizes morphological approaches for segmentation, extraction and estimation in order to solve problem in image processing of the red blood cells. It proposes an image processing system that uses Python Idle software for blood cell counting. By using the Python Idle, all the importance aspects of a correct algorithm have been successfully produced. Different algorithms were employed for the detection and counting. With the efficient algorithm, the red blood cells can be detected and segmented as well as estimate the number of the red blood cells. It enables the study of the morphological features of RBC by the pathologist can determine whether the person is normal referring the amount of RBC in human blood. There is a need for fast and cost-effective production of blood cell count reports. This system includes an effective and efficient method in recognizing and counting blood cells as a practical alternative to the manual blood cell counting. Since it’s an on-going study, more enhancements and improvement could be done in the further process. The system can be further improvised for detecting various diseases related to different blood cell morphologies.
REFERENCES
[1] Peng Zhao, Fang Fang and XudongMa,"Embedded System Design and Implementation in Novel Automatic
HematologyAnalyzer",International Conference on Mechatronics and Automation,pp. 952-957 August 3-6, 2014.
[2] Alvin G. L. Chong, and Kevin S. W. Tan, "Automatic Area Classification in Peripheral Blood Smears",IEEE TRANSACTIONS ON BIOMEDICAL ENGINEERING, VOL. 57, NO. 8, pp. 1982-1990 AUGUST 2010.
[3] Adepoju Paul Olusejun “Improving Laboratory Services And Workforce In Rural Health Facilities” VOL. 2 ISSUE 3, pp. 103-108 July-September 2012.
[4] Ashok VikhePatil, K. V. Somasundaram2 and R. C. Goyal, "CURRENT HEALTH SCENARIO IN RURAL INDIA", International Association of Agricultural Medicine and Rural Health, pp.129-135, 2002.
[5] M. R. Amin and S. Reza, Laboratory manual for practical Physiology and Biochemistry, 1st ed. Azimpur Dhaka, India: Medicogist Medical, 2005.
[6] S. Liangwongsan, B. Marungsri, R. Oonsivilai, and A. Oonsivilai, “Extracted Circle Hough Transform and Circle Defect Detection Algorithm,” World Academy of Science, Engineering and Technology, vol. 60, pp. 432–437, 2011.
[7] J. M. Sharif, M. F. Miswan, M. A. Ngadi, MdSahHj Salam, "Red Blood Cell Segmentation Using Masking and Watershed Algorithm: A Preliminary Study", International Conference on Biomedical Engineering (ICoBE),pp.258-262,27-28 February 2012,Penang
SOURCE DESCRIPTION MAGNIFICATION (APPROXIMATE) IMAGE USB Digital Microscope RBCs not visible 50x-75x Laser Pointer Lens RBCs not visible 100x-120x Compound Microscope: Objective: 45x Eyepiece: 10x RBCs visible but not suitable
for algorithm 450x Compound Microscope: Objective :45x Eyepiece: 15x RBCs visible and suitable for
algorithm
ISSN (Print) : 2320 – 3765 ISSN (Online): 2278 – 8875
I
nternational
J
ournal of
A
dvanced
R
esearch in
E
lectrical,
E
lectronics and
I
nstrumentation
E
ngineering
(An ISO 3297: 2007 Certified Organization)
Vol. 5, Issue 4, April 2016
[8] Ms. S. S. Adagale, Ms. S. S. Pawar,"Image Segmentation using PCNN and Template Matching for Blood Cell Counting", IEEE Conference Enathi,26-28 Dec. 2013.
[9] Miss. Madhuri G. Bhamare,Prof. D.S.Patil, "Automatic Blood Cell Analysis By Using Digital Image Processing: A Preliminary Study", International Journal of Engineering Research & Technology (IJERT), Vol. 2 Issue 9,pp. 3137-3141, September – 2013.