Voltage Profile Improvement with Thyristor
Controlled Series Capacitor
Yadu Ram
1, Dr. Dharmendra Kumar Singh
2, Amit Agrawal
3M.Tech Scholar, Dept. of EEE, Dr. C.V. Raman Institute of Science & Technology, Kota Bilaspur (C.G.), India1 Head of the Dept. , Dept. of EEE, Dr. C.V. Raman Institute of Science & Technology, Kota Bilaspur (C.G.), India2 Assistant Professor , Dept. of EEE, Dr. C.V. Raman Institute of Science & Technology, Kota Bilaspur (C.G.), India3
ABSTRACT: In the recent years, one of the problems that found wide attention is the power system instabilities with the lack of new generation and transmission facilities and increase in the load demand of electrical power is continuously rising at a very high rate, due to rapid industrial development. Power system instability is the main problem that the industry is facing today. FACTS technology and other advanced technologies have made it possible to mitigate the power quality problems. A control strategy for the Series Compensation is developed to regulate power flow and minimize the losses in the power system. This paper describes the analysis of voltage sag/swell and harmonic distortion and compensation of these power quality problems with the Thyristor controlled series capacitor. In this paper the Thyristor controlled series capacitor is considered for the series compensation. Medium transmission line show for voltage profile and harmonic analysis when Thyristor controlled series capacitor (TCSC) is not inserted in series with the line, and then result obtained through Matlab Simulation when Thyristor controlled series capacitor is inserted in series with the transmission line. All the simulation work is carried in MATLAB/SIMULINK environment.
KEYWORDS: Power Quality, Voltage sag, Voltage swell, Harmonics, TCSC
I.INTRODUCTION
interactions between the different control levels may be expected when not properly coordinated .The main aim is to analyse the design of a hierarchical TCSC controller for stability enhancement, taking into account interactions among the different control levels [2]. In this paper our objective is to analyse the voltage profile of receiving end for medium transmission line using MATLAB simulation. Simulation is done for 33kv,110km medium transmission line for the analysis of voltage sag, voltage swell and harmonic present during sag and swell. The simulation work for sag/swell and harmonic is done with and without Thyristor controlled series capacitor. Thyristor controlled series capacitor is used as series compensator.
II.
POWER QUALITYModern industrial processes are based on a large amount of electronic devices such as programmable logic controllers and adjustable speed drives. Unfortunately, electronic devices are sensitive to disturbances, and thus, industrial loads become less tolerant to power quality problems such as voltage sags and harmonics [4]. Voltage sags are an important power quality problem. TCSC is an effective FACTS device to mitigate these power quality problems.
The most common Power Quality problems are: Reduced voltage regulation.
Voltage Sag Voltage Swell Flickers
Reduced Power Factor
Voltage sag (or dip):
A decrease of the normal voltage level between 10 and 90% of the nominal rms voltage at the power frequency, for durations of 0, 5 cycle to 1 minute.Voltage sag occurs on the transmission or distribution network (most of the times on parallel feeders) due to Faults in consumer‟s installation. Connection of heavy loads and start-up of large motors. Voltage sag may result results in Malfunction of information technology equipment, namely microprocessor-based control systems (PCs, PLCs, ASDs, etc) that may lead to a process stoppage. Tripping of contactors and electromechanical relays. Disconnection and loss of efficiency in electric rotating machines.
Voltage swell:
It is Defined as the Momentary increase of the voltage, at the power frequency, outside the normal tolerances, with duration of more than one cycle and typically less than a few a few seconds [8].
III.THYRISTOR CONTROLLED SERIES CAPACITOR
The basic Thyristor-Controlled Series Capacitor scheme, proposed in 1986 by Vithayathil with others as a method of "rapid adjustment of network impedance," is shown in Figure 1. It consists of the series compensating capacitor shunted by a Thyristor-Controlled Reactor. In a practical TCSC implementation, several such basic compensators may be connected in series to obtain the desired voltage rating and operating characteristics. A capacitive reactance compensator which consists of a series capacitor bank shunted by a thyristor-controlled reactor in order to provide a smoothly variable series capacitive reactance Specific dynamical issues in transmission systems are addressed by Thyristor Controlled Series Capacitors (TCSC). In case of large interconnected electrical systems it increases damping. It also overcomes the problem of Sub- Synchronous Resonance (SSR). Sub-Synchronous Resonance is a phenomenon that involves an interaction between large thermal generating units and series compensated transmission systems. The high speed switching capability of TCSC provides a mechanism for controlling line power flow. This permits increased loading of existing transmission lines, and also allows for rapid readjustment of line power flow in response to various contingencies. Regulation of steady-state power flow within its rating limits can be done by the TCSC. The TCSC resembles the conventional series capacitor from a basic technology point of view. All the power equipment is located on an isolated steel platform, including the Thyristor valve which is used for controlling the behaviour of the main capacitor bank. Similarly the control and protection is located on ground potential along with other auxiliary systems. This arrangement is similar in structure to the TSSC and, if the impedance of the reactor, XL, is sufficiently smaller
than that of the capacitor, XC, it can be operated in an on off manner like the TSSC. However, the basic idea behind the
XTCSC = XcXL α
XL α −XC (1)
𝑋𝐿 𝛼 = 𝑋𝐿 𝜋
𝜋−2𝛼 −sin 𝛼 , 𝑋𝐿≤ 𝑋𝐿 𝛼 ≤ ∞ (2)
XL=ωL, and α is the delay angle measured from the crest of the capacitor voltage (or, equivalently, the zero crossing of
the line current). Fig.1 shows the Basic Thyristor controlled series capacitor.
Fig.1 Basic Thyristor Controlled Series Capacitor
The TCSC thus presents a tune able parallel LC circuit to the line current that is substantially a constant alternating current source. As the impedance of the controlled reactor, XL(α), is varied from its maximum (infinity) toward its
minimum (ωL), the TCSC increases its minimum capacitive impedance, XTCSC.min = XC = 1/ωC, (and thereby the
degree of series capacitive compensation) until parallel resonance at XC = XL(α) is established and XTCSC.max
theoretically becomes infinite. Decreasing XL(α) further, the impedance of the TCSC, XTCSC(α) becomes inductive,
reaching its minimum value of XL XC / (XL - XC) at α = 0, where the capacitor is in effect bypassed by the TCR.
Therefore, with the usual TCSC arrangement in which the impedance of the TCR reactor, XL, is smaller than that of the
capacitor, XC, the TCSC has two operating ranges around its internal circuit resonance: one is the αClim ≤ α ≤ π/2 range,
where XTCSC (α) is capacitive, and the other is the 0 ≤ α ≤ αClim ≤ π/2 range, where XTCSC(α) is inductive, as illustrated
in Figure 1 [5]. An appropriate value for capacitor and inductor of a TCSC device is based on the net reactance of transmission line and expected power demands in future. Capacitor value is chosen by a degree of series compensation. Sub section gives an idea of selecting degree of series compensation. Choice of inductor depends on the length of operating area required for inductive and capacitive region. It is perfectly decided by a factor „ώ‟, given by shifting the position of resonance region. The FACTS devices have low switching frequency of once a cycle in the converters and hence the have low losses. The thyristor can be also used to simply bridge impedances in the valves [6].
IV. SIMULATION RESULT
Fig.2 complete simulation model for voltage profile analysis
Voltage Profile Analysis:
i. Consider a 33kv, 110km long transmission line, at bus-2 (receiving end) we found 14.5% voltage sag during switching on of heavy loads or during fault condition as shown in fig.5. X-axis shows the time and Y-axis shows the magnitude of the voltage in rms. This is shown in fig.3.
Fig.3 Three phase Voltage sag(without TCSC) in 33KV transmission line
ii. For 33kv 110km long transmission line we found 14.5%voltage sag(Bus-2) which has been compensated(Bus-4) to 3.36 as shown in fg.4.
iii. For a 33kv, 110km long transmission line we found 14.56% voltage swell at bus-2 (receiving end) during sudden switching-on of the large load as shown in fig.5.
Fig.5 Three phase Voltage swell(without TCSC) in 33KV transmission line
iv. For 33kv, 110km long transmission line 14.56% voltage swell was found, which is reduced to 0.31% as shown in fig.6.
Fig.6 phase Voltage swell compensation (with TCSC) in 33KV transmission line
Harmonic Analysis:
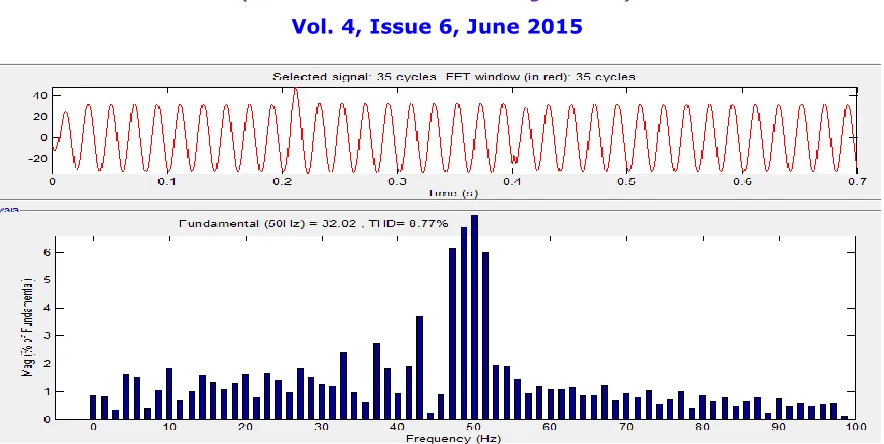
Harmonic distortion levels are described by the complete harmonic spectrum with magnitude and phase angle of each individual harmonic component. It is also a common to use a single quantity, the total harmonic distortion (THD) as measure of effective value of harmonic distortion. Here Harmonic analysis are shown for a voltage profile (Sag & Swell) with and without TCSC.
i. 16.61% Harmonic distortion present in receiving end voltage of 33kv, 110km transmission line during voltage sag condition. This is shown in fig.7.
ii. For 33kv, 110km long transmission line 16.61% harmonics was found during voltage sag, which has been reduced to 7.00% as shown in fig.8.
Fig.8 Harmonic distortion during voltage sag with TCSC
iii. 19.03% Harmonic distortion present in receiving end voltage of 33kv, 110km transmission line during voltage swell condition. This is shown in fig.9
Fig.9 Harmonic distortion during voltage swell without TCSC
Fig.10 Harmonic distortion during voltage swell with TCSC
All the simulation results has been carried in MATLAB/SIMULINK environment. The summary for all the results with and without TCSC is shown in Table.1
Table No.1 Summary of results obtained with & without TCSC
S.No. Sag/Swell Analysis Harmonic Analysis
Sending End Voltage in KV
Voltage Sag/swell type
Voltage sag % without
TCSC
Voltage sag % with TCSC
Harmonic % Without TCSC
Harmonic % with TCSC
1 33 Sag 14.5 3.36 16.61 7.00
2 33 Swell 14.56 0.31 19.03 8.77
V. CONCLUSION
Simulation has been done for 33kv 110 km medium transmission lines. During the power flow from sending to receiving end the losses of power and voltage drop appear and our objective is to minimize that drops and improve power transfer capability of the system. In this paper we can see that the voltage sag and swell is generated during sudden switching on/off of heavy loads, when TCSC is not inserted. These sag/swell has been compensated with the use of TCSC as described above. Harmonic analysis is also done for both the conditions of voltage sag and voltage swell. Finally we conclude that with the use of series compensator the sag/swell and harmonics can be compensated, and hence the power transfer capability of line can be improved.
REFERENCES
[1] N. G. Hingorani and L. Gyugyi, Understanding FACTS: Concepts and Technology of Flexible AC Transmission Systems. New York: IEEE Press, 2000. [2] Siti Amely Jumaat, Ismail Musirin, Muhammad Murtadha Othman and Hazlie Mokhlis “Placement And Sizing Of Thyristor Controlled Series Compensator Using
PSO Based Technique For Loss Minimization”, 2012 IEEE International Power Engineering and Optimization Conference (PEOCO2012), Melaka, Malaysia: 6-7 June 2012 978-1-4673-0662-1/12, PP285-290.
[3] Claudio A. Ca~nizares, Zeno T. Faur “Analysis of SVC and TCSC Controllers in Voltage Collapse”, IEEE Trans. Power Systems, Vol. 14, No. 1, February 1999, pp. 158-165.
[4] Nagendrababu, Sreekanth G, Narender Reddy Narra, Dr. Srujana, “Series Compensation Technique for Voltage Sag Mitigation”, IOSR Journal of Engineering (IOSRJEN) ISSN: 2250-3021 Volume 2, Issue 8 (August 2012), PP 14-24.
[5] G. V. T. Prudhvira, Raghu, S. Meikandasivam and D. Vijayakumar, “Implementing TCSC Device in Kalpakam Khammam Line for Power Flow Enhancement”, 2013 IEEE International Conference on Circuits, Power and Computing Technologies 978-1-4673-4922-2/13, PP138-141.
[6] GABRIEL OLGUIN “Voltage Dip (Sag) Estimation in Power Systems based on Stochastic Assessment and Optimal Monitoring” 2005 ISBN 91-7291-594-3 Doktorsavhandlingar vid Chalmers Tekniska Högskola Ny serie nr 2276 ISSN 0346-718.
[7] S. Meikandasivam, Rajesh Kumar Nema, Shailendra Kumar Jain, “Behavioral Study of TCSC Device – A MATLAB/Simulink Implementation”, World Academy of Science, Engineering and Technology Vol: 2 2008-09-24.