Optimizing Efficiency of Coal Mines using Constant
Return to Scale (CRS) Model
Dr.G.Thirupati Reddy
Professor & Principal, Sree Visvesvaraya Institute of Technology & Science, Mahabubnagar,
ABSTRACT
Coal accounts for 50% of total
commercial energy supplied in India. The rising
demand for coal and the inability of the domestic
coal production to meet the demand is a
challenging task to improve the productivity and
reducing cost through technological upgradation.
SCCL is a public sector mining organization is the
largest producer of coal in India after coal India
Limited (CIL) with manpower of 77,000 and
catering the energy needs of southern part of
India. The company is now operating 42
Underground (UG) mines and 15 Open Cast (OC)
mines. Productivity improvement and cost control
have become key objectives of SCCL coal mines
in recent years. As a result many research works
have carried out on productivity improvement in
coal mines.
Keywords : Data Envelopment Analysis , CRS , Benchmark.
1.INTRODUCTION
Selected various coal mines in SCCL and
calculated relative efficiency of mines by using
Data Envelopment Analysis (DEA) which helps
to rank them based on their efficiency score.The
efficiency score has been calculated based on two
approaches of DEA Viz., Constant Return to
Scale (CRS) model.For every inefficient coal
mine, DEA identifies a set of corresponding
efficient coal mines that can be utilized as
benchmarks for improvement of performance and
productivity. DEA developed based on two scale
of assumptions viz., Constant Return to Scale
(CRS) output model.
Methodology
Data envelopment analysis (DEA) is a linear
programming based technique for measuring the
relative performance of organizational units where
the presence of multiple inputs and outputs makes
comparisons difficult. DEA developed based on
two scale of assumptions viz., Constant Return to
Scale (CRS) model and the DEA model which
allows relative efficiency measures to be
determined is developed.
A common measure for relative efficiency is,
Efficiency =
The Constant Returns to Scale Model (CRS)
The following discussion of DEA begins with a
description of the input-orientated CRS model
was the first to be widely applied. The original
constraint is manipulated in order to convert the
fractional program to a linear program. These two
steps result in the following:
The interpretation of ur and vi is that they
and the are chosen to maximize the efficiency
score for DMU0. The constraint forces the
efficiency score to be no greater than 1 for any
DMU. In order to convert the fractional program
to a linear program. These two steps result in the
following:
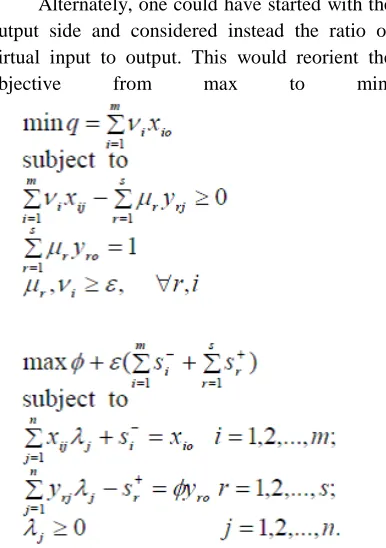
CRS Output-oriented Model
Alternately, one could have started with the output side and considered instead the ratio of virtual input to output. This would reorient the
objective from max to min.
Data Collection and Preparation for the Model
we have chosen four input variables namely, Wage Cost (In Lakhs rupees per year), Store Cost (In Lakhs rupees per year),OBR Cost (In Lakhs rupees per year), Other cost (In Lakhs rupees per
year) and one output variable namely Production (in Lakh Tonnes per year).
Table I: Input and Output Variables used in
the analysis
Input/output variable Open-Cast mines
Wage Cost (Input) It includes all the wages paid to
the employees
Store Cost (Input) Cost of Explosives, spares and
other maintenance items used
Other cost (Input) Cost of Capital equipment,
Depreciation.
OBR cost (Input) Cost of over burden removal
from above coal seams
Production (output) Saleable Coal
2. ANALYSIS OF OC MINES
OC mines with output – oriented CRS model
Using CRS algorithm for every single DMU a
linear program with one objective function and 16
side conditions was designed. These 16 linear
programs were solved using TORA package and
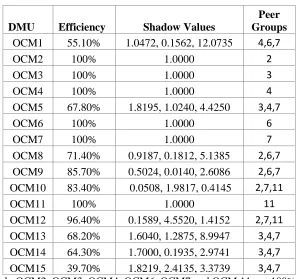
Table
II: Efficiency Scores, Shadow values and Peer Groups of OC mines after
solving Output – oriented CRS model
DMU
Efficiency
Shadow Values
Peer
Groups
OCM1
55.10%
1.0472, 0.1562, 12.0735
4,6,7
OCM2
100%
1.0000
2
OCM3
100%
1.0000
3
OCM4
100%
1.0000
4
OCM5
67.80%
1.8195, 1.0240, 4.4250
3,4,7
OCM6
100%
1.0000
6
OCM7
100%
1.0000
7
OCM8
71.40%
0.9187, 0.1812, 5.1385
2,6,7
OCM9
85.70%
0.5024, 0.0140, 2.6086
2,6,7
OCM10
83.40%
0.0508, 1.9817, 0.4145
2,7,11
OCM11
100%
1.0000
11
OCM12
96.40%
0.1589, 4.5520, 1.4152
2,7,11
OCM13
68.20%
1.6040, 1.2875, 8.9947
3,4,7
OCM14
64.30%
1.7000, 0.1935, 2.9741
3,4,7
OCM15
39.70%
1.8219, 2.4135, 3.3739
3,4,7
Six Mines namely OCM2, OCM3, OCM4, OCM6, OCM7 and OCM 11 got 100% efficiency, so
these mines are called the benchmarking or referring mines.
Table III: Ranking and Peer count of OC Mines after solving Output – oriented
CRS model
DMU Efficiency
Peer
Group Ranking
Peer Count
OCM1 55.10% 4,6,7 13 0
OCM2 100% 2 3 5
OCM3 100% 3 3 5
OCM4 100% 4 2 6
OCM5 67.80% 3,4,7 11 0
OCM6 100% 6 4 4
OCM7 100% 7 1 10
OCM8 71.40% 2,6,7 9 0
OCM9 85.70% 2,6,7 7 0
OCM10 83.40% 2,7,11 8 0
OCM11 100% 11 5 3
OCM12 96.40% 2,7,11 6 0
OCM13 68.20% 3,4,7 10 0
OCM14 64.30% 3,4,7 12 0
The above table 4.10 shows relative efficiency of OC Mines calculated by comparing with other
uniform DMUs with same Input and Output variables.
.The shadow values related to the
constraints limiting the efficiency of each unit to be no greater than 1.
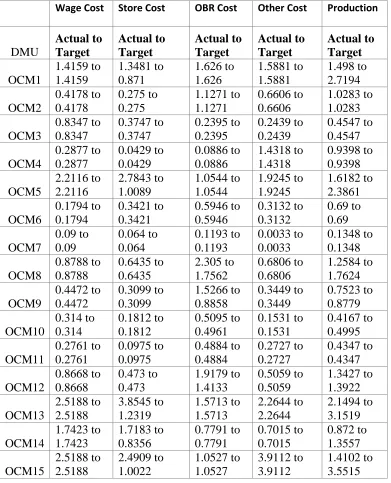
Table IV: Improvements in Inputs and Output of OC Mines after solving Output –
oriented CRS model
Wage Cost
Store Cost
OBR Cost
Other Cost
Production
DMU
Actual to
Target
Actual to
Target
Actual to
Target
Actual to
Target
Actual to
Target
OCM1
1.4159 to
1.4159
1.3481 to
0.871
1.626 to
1.626
1.5881 to
1.5881
1.498 to
2.7194
OCM2
0.4178 to
0.4178
0.275 to
0.275
1.1271 to
1.1271
0.6606 to
0.6606
1.0283 to
1.0283
OCM3
0.8347 to
0.8347
0.3747 to
0.3747
0.2395 to
0.2395
0.2439 to
0.2439
0.4547 to
0.4547
OCM4
0.2877 to
0.2877
0.0429 to
0.0429
0.0886 to
0.0886
1.4318 to
1.4318
0.9398 to
0.9398
OCM5
2.2116 to
2.2116
2.7843 to
1.0089
1.0544 to
1.0544
1.9245 to
1.9245
1.6182 to
2.3861
OCM6
0.1794 to
0.1794
0.3421 to
0.3421
0.5946 to
0.5946
0.3132 to
0.3132
0.69 to
0.69
OCM7
0.09 to
0.09
0.064 to
0.064
0.1193 to
0.1193
0.0033 to
0.0033
0.1348 to
0.1348
OCM8
0.8788 to
0.8788
0.6435 to
0.6435
2.305 to
1.7562
0.6806 to
0.6806
1.2584 to
1.7624
OCM9
0.4472 to
0.4472
0.3099 to
0.3099
1.5266 to
0.8858
0.3449 to
0.3449
0.7523 to
0.8779
OCM10
0.314 to
0.314
0.1812 to
0.1812
0.5095 to
0.4961
0.1531 to
0.1531
0.4167 to
0.4995
OCM11
0.2761 to
0.2761
0.0975 to
0.0975
0.4884 to
0.4884
0.2727 to
0.2727
0.4347 to
0.4347
OCM12
0.8668 to
0.8668
0.473 to
0.473
1.9179 to
1.4133
0.5059 to
0.5059
1.3427 to
1.3922
OCM13
2.5188 to
2.5188
3.8545 to
1.2319
1.5713 to
1.5713
2.2644 to
2.2644
2.1494 to
3.1519
OCM14
1.7423 to
1.7423
1.7183 to
0.8356
0.7791 to
0.7791
0.7015 to
0.7015
0.872 to
1.3557
OCM15
2.5188 to
2.5188
2.4909 to
1.0022
1.0527 to
1.0527
3.9112 to
3.9112
1.4102 to
3.5515
The following fig I shows clearly the difference between Actual Production and
Target Production.
Fig-I: Actual Production Vs Target Production for Output – oriented CRS model
3. CONCLUSION
One could alternatively ask the question “: “By
how much more output can potentially be
produced without altering the input quantities
used?” This is an output-orientated measure as
opposed to the input-oriented measure. six units
OCM2, OCM3, OCM4, OCM6, OCM7 and
OCM 11 got 100% efficiency acts as a peer
groups for other nine inefficient mines. But two
OC mines are OCM7 and OCM4 appeared
maximum number of times (10 and 6) as a peer
groups. So, these two mines built the efficient
frontier for improvement of other mines and acts
as a benchmarking for other units which are
given the 1st and 2nd ranks by DEA. OCM2,
OCM3, OCM6 and OCM 11 assigned less
ranking then OCM7 and OCM4 even though got
100% efficiency due to these units appeared less
peer count.
However, there is a scope for improvement of
Open cast mines because mean efficiency score
for all DMUs shows 0.8213 (82.13%).There is
lot of scope for further improvement in the
output production without changing all input
variables by adjusting slack variable in one Input
of each Coal mine. Table IV shows in both the
input and output-oriented cases lot of
improvement in output can be achieved by
decreasing the input based on the analysis given
by the DEA CRS method.After Benchmarking it
is found that there is sufficient scope for
improvement in coal mines .The fruits of process
benchmarking could bring in substantial savings
by way of overall cost reduction and cycle time
which improves the Productivity of Coal mines.
4. REFERENCES
1. Srinivas Talluri, Data Envelopment
Analysis: Models and Extensions, 2000,
the journal of Production/Operations
management.
2. Banker, R.D., Charnes, A. and Cooper,
W.W. (1984), ‘Some models for
estimating technical and scale
inefficiencies in data envelopment
3. analysis’, Management Science, Vol.
30, No. 9,pp.1078-1092.
4. Andersen, P., & Petersen, N.C. (1993).
A Procedure for ranking efficient units
in data envelopment analysis.
Management Science, 39 (10),
1261-1264.
5. A. Charnes, W.W. Cooper and E.
Rhodes, “Measuring the Efficiency of
Decision Making Units,” European
Journal of Operational Research 2, pp.
429-444, 1978.
6. Andersen P and Petersen NC (1993). A
procedure for ranking efficient units in
Data Envelopment Analysis. Mngt Sci
39: 1261–1264.
7. Cooper, W.W., Seiford, L.M. and Tone, K., 2000, Data Envelopment Analysis:
A Comprehensive Text with Models,
Applications, References and
DEA-Solver Software, Kluwer Academic
Publishers, Boston.