CFD SIMULATION OF SINGLE PHASE FLOW OVER NUCLEAR FUEL
CLUSTER SPACER
Arnab Dasgupta, D.K. Chandraker, P.K. Vijayan Reactor Engineering Division
Bhabha Atomic Research Centre, Mumbai
E-mail of corresponding author: [email protected]
ABSTRACT
Spacers are an important part of any nuclear fuel cluster. It does the function of spacing the fuel elements, thus preventing hot spots. It also aids in arresting flow induced vibrations. From the thermal-hydraulic point of view, spacers enhance turbulence and improve heat transfer. This fact has been well known and is manifested as an increase in critical heat flux as is experimentally observed. Increase in turbulence apart from increase in heat transfer also implies increase in momentum transfer. This causes increased pressure drop. Enhanced pressure drop is an important consequence as it determines the pumping requirements in pumped systems. In natural circulation systems, since driving head is generally lower than in pumped systems, pressure drop assumes a lot of significance. Turbulence and thus pressure drop has been satisfactorily modeled for bare bundle regions of the fuel cluster using approaches like bundle average method or the more detailed subchannel analysis. These methods however use lumped loss coefficients for spacers which have to be adjusted to match experimentally observed pressure drop values. In fact, prediction of loss coefficients based on a combination of sudden contraction and sudden expansion losses lead to erroneous results. With such lumped loss coefficients and friction factors, a complete picture of flow distribution around spacers is not available. Such information can be obtained only by using computational fluid dynamics. In this paper, flow across the AHWR fuel bundle spacer is modeled using CFD code PHOENICS 3.6.1. For comparison purpose, experimentally observed pressure drop across spacer is used.
INTRODUCTION
The fission heat is generated in the core of a nuclear reactor which consists of the nuclear fuel clusters. Due to their importance, generally detailed analyses are performed to evaluate the flow conditions inside a rod bundle. Conventionally such analyses are done using subchannel codes like COBRA, which divide the total flow area into a number of parallel interacting subchannels and solve the mass momentum and energy balances. Since there is no resolution of the geometry in a direction perpendicular to channel or rod walls, empirical friction factors have to be provided to account for the frictional pressure drop. The advantage of such codes is generally small computational times. Also, all the subchannel codes used in industry have been validated against a reasonably large number of experimental data. On the downside, subchannel codes do not provide a detailed picture of flow within rod bundles. As the desire to extract more power from a given rod bundle configuration and computational power is increasing, there has been a trend towards using Computational Fluid Dynamics (CFD) techniques for simulating flow within rod bundles. Lately there have been many papers in which attempts have been made either to simulate flows in fuel clusters [1-4] or to understand the details of flows within a single subchannel [5,6].
One of the least understood phenomena in fluid mechanics is that of turbulence. Most of the empiricism that exists in single phase flows is a reflection of this. Physically turbulence manifests itself in the form of increased pressure drop and increased heat transfer. These are in fact intimately linked; a proper understanding of the turbulent shear stresses implies understanding of the turbulent heat transfer. Many models exist in literature for simulation of turbulence, the most common being the k-ε model which is an eddy viscosity based model. The eddy viscosity models are however not able to capture, the intricacies of cross flows occurring across the gaps between subchannels and the periodic structures [6]. Either Reynolds stress based models or Large Eddy Simulation (LES) has to be used for this purpose. However, these models are computationally very demanding and for large scale problems, where prediction of gross phenomena is important, simpler models like k-ε are used.
LITERATURE SURVEY
Due to the importance of spacers in promoting turbulence and thereby increasing both heat transfer and pressure drop, there have been many experimental and numerical studies to understand the flow distribution around spacing grids. Since spacer designs are specific to rod bundles, experiments are also very specific. Caraghiaur et al.[9] have measured the pressure drop and local velocity components across a spacer grid and found out the spacer loss coefficients for their specific spacer grid. Connor et al [10] have conducted experiments and validated a CFD methodology for prediction of flows across spacer specific to Westinghouse PWR design. In Liquid Metal Fast Breeder Reactors, spacing is provided by wire wraps, experimental investigations of that kind have been done by Rehme[11].
With regards to simulation, the effect of spacers is often accounted for by applying a local loss coefficient for the spacer. This is the methodology followed in subchannel analysis codes [12, 13]. Also for large scale rod bundle simulations, this technique is used to affect savings on computational front [14]. This method can simulate the flow redistribution due to spacers to some extent as the local subchannel losses are different and some crossflow occurs after the spacer location to equalize the pressure between adjacent subchannels. However, this method is unable to simulate recirculation zones downstream of a spacer grid. These recirculation zones increase turbulence and further induce pressure drop. For such detailed flow distributions, spacer geometry has to be properly modeled. Connor et al.[10] have obtained best results by using renormalization (RNG) group k-ε model for turbulence modeling. Gajapathy et al.[1] have used the standard k-ε model in their numerical investigation of helical wire wrapped 7-pin bundle. Liu and Ferng [4] have modeled flows over split vane and standard spacer grids of Pressurised Water Reactors (PWRs). They have used the Reynolds Stress Model (RSM) for turbulence simulation. For the split vane spacer, they have obtained higher heat transfer due to induced swirl and existence of strong vortices for a substantial distance downstream of the spacer vane.
MODELING OF THE AHWR FUEL CLUSTER
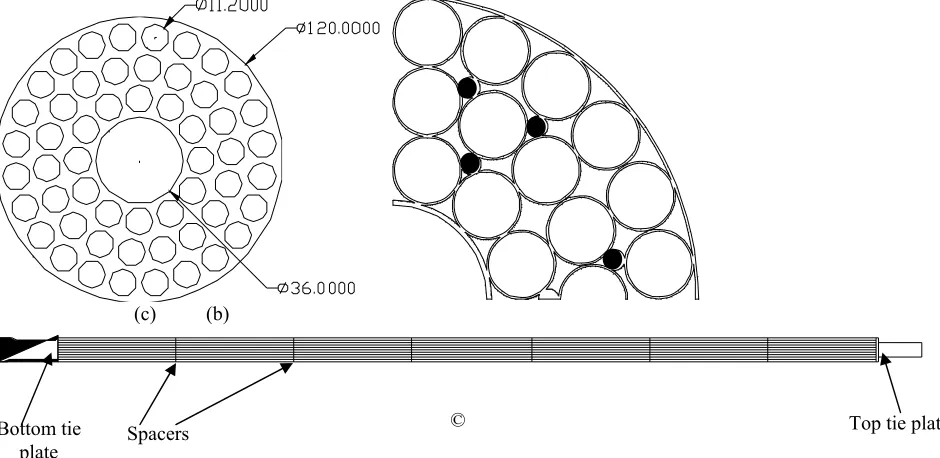
AHWR fuel cluster consists of 54 fuel pins arranged in three concentric circles of 12, 18 and 24 pins around a central water rod of 36 mm outside diameter. The cluster is housed in a channel of 120 mm inside diameter. The total length of the fuel pins is 3.8 m and the fuel pins are spaced using six grid type spacers (15 mm thick) located at 550 mm from each other. These details are shown in figure 1. Near the region of the spacers, bearing pads are welded on to the fuel pin surface to prevent fretting of the fuel pins.
(c) (b)
©
Fig 1. (a) cross section of the bare bundle showing the central rod, fuel pins and channel inside diameter, (b) ¼th
sector of cross section of spacer, (c) Schematic of fuel cluster of AHWR Bottom tie
plate Spacers
For the purpose of modeling, first a bare bundle has been modeled and the length for the flow to become fully developed has been evaluated. This length has been found to be ~190 mm. Since this length is smaller than the spacer pitch, it can be expected that the flow disturbed after flowing over a spacer will be fully developed before reaching the next spacer. Considering this, the simulation length for flow over bundle containing spacer was taken to be sufficiently larger than the developing length.
For the simulation, a ¼th symmetry sector of the cluster was used. The geometry was created using solid
modeling software and imported to PHOENICS. Since only structured grid is allowed in PHOENICS, a Cartesian mesh was used. The total number of computational cells were 12,15,000. The number of cells is unusually large due to the use of a structured mesh where even the non flow regions are required to be meshed. Figure 2 shows the modeled bundle along with the spacer and spacer bearing pads. Since Cartesian coordinates have been considered, the channel inside diameter has been simulated by considering a solid block. No such structure exists in actual reactor.
(a) (b) (c)
Fig 2. ¼th symmetry sector of AHWR fuel cluster considered for analysis (a) the spacer grid shown along with the
region of the bundle consisting of bearing pads, (b) The complete assembly of spacer and rod cluster, (c)90 x 90 computational grid across the cross section of bundle.
The experimental results for spacer loss coefficient Ksp, are available as a function of inlet flow rate. From
the numerical simulation of bare bundle pressure drop and that across a bundle consisting of spacer, the spacer loss coefficient can be deduced using eqn. (1).
2
2(
bs bb)
sp avg
p
p
K
u
ρ
Δ
− Δ
=
(1)
Where, Δpbs and Δpbb are the pressure drop for bundle containing spacer and bare bundle respectively, ρ is the
coolant density and uavg is the average coolant flow velocity considering bare bundle flow area.
Governing equations and boundary conditions
The equations of mass and momentum conservation have been solved to obtain the flow field. In tensor notation, these equations may be stated as:
Continuity equation:
0
j ju
x
∂
=
∂
(2)
Momentum equation:(
j i)
ijj i j
u u
p
x
x
x
ρ
τ
∂
= −
∂
+
∂
∂
∂
∂
(3)
Where the closure for shear stress,τij is given by:
Spacer grid
Bearing pad
' '
2
i iij i j
j j
u
u
u u
x
x
τ
=
ρν
⎛
⎜
⎜
∂
∂
+
∂
∂
⎞
⎟
⎟
−
ρ
⎝
⎠
(4)
In the k-ε model, the Reynolds stresses, ' ' i j
u u
ρ are modeled by relating them to the mean strain rate using a scalar eddy viscosity. To obtain this eddy viscosity, equations for turbulent kinetic energy, k (eqn.5) and turbulent energy dissipation, ε(eqn.6) are solved.
(
j)
tk
j j k j
u k
k
P
x
x
x
ρ
ν
ρ ν
ρε
σ
∂
=
∂
⎧
⎪
⎛
+
⎞
∂
⎫
⎪
+
−
⎨
⎜
⎟
⎬
∂
∂
⎪
⎩
⎝
⎠
∂
⎪
⎭
(5)
(
j)
t(
1 2)
k
j j j
u
C P C
x
x
εx
k
ε ερ ε
ν
ε
ε
ρ ν
ρε
σ
∂
=
∂
⎧
⎪
⎛
+
⎞
∂
⎫
⎪
+
−
⎨
⎜
⎟
⎬
∂
∂
⎪
⎩
⎝
⎠
∂
⎪
⎭
(6)
The eddy viscosity, νtis given by,
2 t k Cμ ν ε =
(7)
Pk is the term which denotes production of turbulent kinetic energy. Σk, σε Cε1,Cε2 and Cμ are model constants. In the standard k-ε model, their values are 1.0, 1.3, 1.44,1.92 and 0.09 respectively. The above equations (2-7) form a closed set which can be solved to obtain the velocity and pressure distribution for given boundary conditions. The boundary conditions imposed are an inlet flow condition, an exit pressure condition and wall boundary conditions which are taken care of by the geometrical model.
RESULTS AND DISCUSSIONS
The use of eddy viscosity models though not good enough to capture the periodic structures existing in the gap between subchannels work seem to work well for the simulation of spacer grids because, in the case of spacer grids, basically the effects of flow blockage need to be simulated. Such effects are appropriately taken into account by the k-ε model. The predicted spacer loss coefficients are compared with the experimental correlation in table 1. It can be seen that the predictions are substantially lower than experimental values. This difference can be attributed to the treatment of partial solid cells in PHOENICS. Such cells occur whenever the wall boundaries- in this particular case, the rods and other circular boundaries, don’t conform to the coordinate system. Due to this, the no-slip boundary condition cannot be effectively imposed and hence predicted wall shear is lesser.
Table1: Experimental and predicted Spacer loss coefficients Channel Flow (m3/s)
x 10-3
Experimental Ksp Predicted Ksp
4.0 1.88 1.13
4.5 1.86 1.12
5.0 1.84 1.09
5.5 1.73 1.08
6.0 1.60 1.06
Even though the values of spacer loss coefficient are widely different, the trends are the same. The code is also seen to predict the flow recirculation zones downstream of the spacer grid. These are shown in fig. 3 for channel flow rate of 0.004 m3/s. The recirculation zones are also the regions with high turbulent kinetic energies and
high energy dissipation. Such recirculation cannot be simulated in cases where lumped loss coefficients are used for spacers.
(a)
(b) (c)
Fig.3 Contours of quantities downstream of spacer (a) recirculation zones indicated by velocity plot, (b) Dissipation rate of turbulent energy, (c) turbulent kinetic energy.
The variation of pressure, turbulent kinetic energy and energy dissipation is also plotted (fig.5) for a specific cross-sectional location along the axis of the bundle. The behavior is similar for the complete cross section. It is seen that there is a sharp drop in pressure due to increased velocity in the spacer region (fig. 5(a)). Some of this pressure loss is recovered after a very short distance downstream of the spacer. In the bare bundle region, the pressure fall is linear, as expected. Turbulent kinetic energy and dissipation rate show a flat trend till the spacer where there is a sharp rise indicating increased turbulence and thus greater pressure drop.
CONCLUSIONS
Single phase coolant flow over a rod bundle containing spacer was simulated using CFD code PHOENICS 3.6.1. The results were compared with experimental data. The predictions of spacer loss coefficient were much lower than experimental observations, but the trends were predicted properly. The reason for this can be attributed to the poor implementation of no-slip boundary condition in partial solid cells, which is a limitation of PHOENICS.
It is seen from the simulation that the spacer region is a region of vigorous mixing. The flow redistribution due to spacer grid and recirculation zones downstream of the spacer are captured by CFD simulation. It was also seen that the turbulent kinetic energy and energy dissipation rate peak at the spacer location indicating enhanced turbulence. The pressure drop across the spacer is seen to consist of two components, one a recoverable pressure drop, which occurs due to change in velocity head; and an irrecoverable drop which occurs due to turbulence. It can thus be concluded that the k-ε model is able to capture the physics of flow across the spacer grid of a typical rod bundle.
(a) (b)
(c)
Length along bundle axis (m)
(a)
Length along bundle axis (m) (b)
REFERENCES
[1] Gajapathy, R., Velusamy,K., Selvaraj, P., Chellapandi, P., Chetal, S.C., “CFD investigation of helical wire-wrapped 7-pin fuel bundle and the challenges in modeling full scale 217 pin bundle” Nucl. Eng. Des., Vol. 237, 2007, pp. 2332-2342.
[2] H. Anglart, O. Nylund, N. Kurul, M.Z. Podowski, “CFD prediction of flow and phase distribution in fuel assemblies with spacers”, Nucl. Eng. Des., Vol. 177, 1997, pp. 215-228.
[3] Natesan, K., Sundararajan, T., Narasimhan, A., Velusamy, K., “Turbulent flow simulation in a wire wrap rod bundle of an LMFBR”, Nucl. Eng. Des., Vol. 240, 2010, pp. 1063-1072.
[4] Liu, C.C., Ferng, Y.M., “Numerically simulating the thermal-hydraulic characteristics within fuel rod bundle using CFD methodology”, Nucl. Eng. Des., Vol. 240, 2010, pp. 3078-3086.
[5] Toth, S., Aszodi, A., “CFD analysis of flow field in a triangular rod bundle”, Nucl. Eng. Des., Vol. 240, 2010, pp. 352-363.
[6] Merzari, E., Ninokata,H., Baglietto, E., “Numerical simulation of flows in tight-lattice fuel bundles”, Nucl. Eng. Des., Vol. 238, 2008, pp. 1703-1719.
[7] Sinha, R.K., Kakodkar, A., “Design and development of the AHWR-the Indian thorium fuelled innovative nuclear reactor”, Nucl. Eng. Des., Vol. 236, 2006, pp. 683-700.
[8] Dasgupta, A., “Results of single phase pressure drop experiments on AHWR D-5 cluster”, unpublished work.
[9] Caraghiaur, D., Anglart, H., Wiktor, F., “Experimental investigation of turbulent flow through spacer grids in fuel rod bundles”, Nucl. Eng. Des., Vol. 239, 2009, pp. 2013-2021.
[10]Conor, M.E., baglietto, E, Elmahdi, A.M., “CFD methodology and validation for single-phase flow in PWR fuel assemblies”, Nucl. Eng. Des., Vol. 240, 2010, pp. 2088-2095.
[11]Rehme, K., “Pressure drop correlations for fuel element spacers”, Nucl. Tech., Vol. 17, 1973, pp 15-22. [12]Rowe, D.S., “COBRA IIIC: A Digital Computer Program for Steady State and Transient
Thermal-Hydraulic Analysis of Rod Bundle Nuclear Fuel Elements”, BNWL-1695, 1973.
[13]Wheeler, C.L. et al., “COBRA-IV-I: An interim version of COBRA for thermal-hydraulic analysis of rod bundle nuclear fuel elements and cores”, BNWL-1962, March 1976.