ABSTRACT
BALAGOPAL, BHARAT. A Four-Dimensional First Principle Based Battery Degradation Model for State of Health (SOH) and State of Function (SOF) Estimation. (Under the direction of Mo-Yuen Chow).
© Copyright 2019 by Bharat Balagopal
A Four-Dimensional First Principle Based Battery Degradation Model for State of Health (SOH) and State of Function (SOF) Estimation
by
Bharat Balagopal
A dissertation submitted to the Graduate Faculty of North Carolina State University
in partial fulfillment of the requirements for the Degree of
Doctor of Philosophy
Electrical Engineering
Raleigh, North Carolina 2019
APPROVED BY:
Srdjan Lukic Cranos Williams
Alyson Wilson Mo-Yuen Chow
DEDICATION
To my parents, Vrindha and Balagopal and my sister, Bhavana, for their support, motivation and love.
BIOGRAPHY
ACKNOWLEDGEMENTS
I would like to thank my advisor and mentor, Dr. Mo-Yuen Chow, for his continuous support throughout my PhD program. He has always guided me and provided me a platform to learn as well as showcase my strengths. Being a part of the Advanced Diagnosis, Automation and Control Lab and interacting with Dr. Chow and his team has helped me think outside the box and develop innovative solutions for problems in the real world.
The alumni, Drs. Unnati Ojha, Ziang Zhang, Wente Zeng, Navid Rahbari Asr, Habiballah Rahimi-Eichi and Yuan Zhang and the current members of the ADAC Lab, Cong Sheng Huang, Jie Duan and Zheyuan Cheng have all been excellent colleagues and provided me with an exciting work environment. They were often sounding boards for ideas and helped me improve my quality of work.
I am highly appreciative of my PhD committee members, Dr. Srdjan Lukic, Dr. Cranos Williams and Dr. Alyson Wilson for their feedback on my research milestones, plan of work and approach to achieve my research goals.
I’d like to give a shout-out to all the staff at the Office of International Services for being the friendliest immigration advisors I have ever met.
TABLE OF CONTENTS
List of Tables . . . viii
List of Figures . . . ix
Chapter 1 INTRODUCTION. . . 1
1.1 Factors that Affect the Health of the Battery . . . 2
1.1.1 Temperature of Operation . . . 2
1.1.2 Charge/Discharge Cycling . . . 3
1.1.3 Depth of Discharge . . . 3
1.1.4 Overcharging . . . 3
1.1.5 Charge/Discharge Rate . . . 4
1.1.6 Calendar Aging . . . 4
1.2 SOH Estimation Techniques . . . 4
1.2.1 Capacity Estimation Techniques . . . 5
1.2.2 Internal Resistance Estimation Techniques . . . 11
1.2.3 Limitations of the Current SOH Estimation Techniques . . . 12
1.3 State of Function Estimation . . . 13
1.3.1 Factors that Affect the SOF of the Battery . . . 14
1.4 SOF Estimation Techniques . . . 15
1.4.1 Power Demand Based Techniques . . . 15
1.4.2 Terminal Voltage Based Techniques . . . 15
1.4.3 Limitations of the Current SOF Estimation Techniques . . . 15
1.5 Outline and Contributions of this thesis . . . 16
Chapter 2 BATTERY CHEMISTRIES AND PHYSICS - BASED MODELING METHODS . . . 20
2.1 Popular Battery Chemistries . . . 23
2.1.1 Lead Acid . . . 23
2.1.2 Nickel Cadmium . . . 24
2.1.3 Nickel Metal Hydride . . . 25
2.1.4 Lithium Ion . . . 27
2.2 Current Physics Based Models . . . 27
2.2.1 1D Model . . . 28
2.2.2 Pseudo 2D (P2D) Model . . . 29
2.2.3 Pseudo 3D Model . . . 33
Chapter 3 FIRST PRINCIPLE BASED FOUR-DIMENSIONAL DEGRADATION MODEL (4DM) . . . 36
3.1 Capabilities of 4DM . . . 36
3.2.1 Software Selection - COMSOL . . . 38
3.2.2 Design Parameters of the 4DM . . . 40
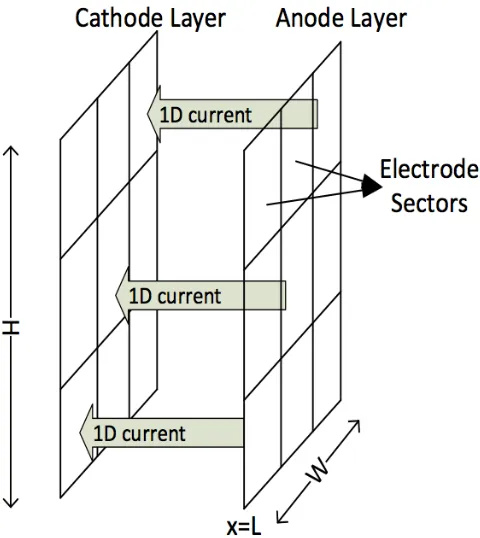
3.2.3 Single Layer Single Electrode Model . . . 45
3.2.4 Single Layer Multi-Electrode Model . . . 56
3.2.5 Multi-Layer Multi-Electrode Model . . . 58
Chapter 4 DEGRADATION PHENOMENA & SENSITIVITY ANALYSIS . . . . 60
4.1 Battery Aging . . . 60
4.2 Three Major Classes of Degradation . . . 61
4.2.1 Loss of active material . . . 61
4.2.2 Loss of Lithium inventory . . . 63
4.2.3 Side Reactions . . . 64
4.3 Sensitivity Analysis . . . 65
4.3.1 Anode concentration degradation . . . 65
4.3.2 Anode conductivity /volume fraction degradation . . . 70
4.3.3 Electrolyte salt diffusion coefficient degradation . . . 72
4.3.4 Electrolyte transference number degradation . . . 76
4.3.5 Activity coefficient of anode degradation . . . 79
4.3.6 Activity coefficient of cathode degradation . . . 81
4.4 Chapter Conclusion . . . 83
Chapter 5 CALENDAR AGING AND ITS IMPACT ON DEGRADATION . . . . 85
5.1 Calendar Aging . . . 85
5.2 Simulation of Calendar Aging on the three classes of degradation phenomena in 4DM . . . 86
5.2.1 Loss of active material . . . 86
5.2.2 Loss of Lithium inventory . . . 88
5.2.3 Side reactions . . . 89
5.3 Results of Calendar Aging Simulation in 4DM . . . 94
5.3.1 Impact of Calendar Aging on Anode Conductivity . . . 94
5.3.2 Impact of Calendar Aging on Concentration of Lithium Ions . . . 96
5.3.3 Impact of Calendar Aging on SEI Growth and Battery Capacity . . . . 96
5.3.4 Impact of Anode Conductivity Degradation, Concentration of Lithium Ion Degradation and SEI Growth on Equivalent Circuit Model Parameters 98 Chapter 6 PROBLEMS ENCOUNTERED DURING THE DESIGN AND SIM-ULATION OF 4DM . . . 107
6.1 Mesh Resolution for Finite Element Analysis Issues . . . 108
7.2 Future Work . . . 115
LIST OF TABLES
Table 1.1 Possible SOF Values for Different SOCs and SOHs . . . 14 Table 3.1 Cathode Materials and their specifications . . . 42 Table 3.2 Physical Parameter of 4DM of a Li-Ion battery under study. . . 45 Table 3.3 Electrochemical Parameters of 4DM of a Li-Ion battery under study. . . . 47 Table 4.1 Change in Terminal Voltage (V) for a 10% change in parameter. . . 84
Table 5.1 Sensitivity of ECM Parameters to calendar aging of battery components. 106
LIST OF FIGURES
Figure 1.1 Electrochemical model of the battery. . . 6
Figure 1.2 A RC Equivalent Circuit of a battery. . . 7
Figure 1.3 Block Diagram of Kalman Filter used for Capacity Estimation. . . 8
Figure 1.4 Charge Discharge Curves for PNN. . . 9
Figure 1.5 Pulsed Discharge Technique. . . 10
Figure 2.1 Components of the battery. . . 21
Figure 2.2 Movement of ions and electrons during battery discharge. Popular Bat-tery Chemistries. . . 22
Figure 2.3 1D Model of a battery. . . 28
Figure 2.4 P2D Model of a battery. . . 30
Figure 2.5 Pseudo 3D Model of a battery. . . 35
Figure 3.1 The Graphical User Interface developed for the 4DM operation. . . 38
Figure 3.2 Software selection logic flow for 4DM. . . 39
Figure 3.3 Voltage vs SOC of different cathode materials. . . 42
Figure 3.4 Graphite voltage (y-axis) vs SOC (x-axis). . . 44
Figure 3.5 Simulation logic flow for 4DM. . . 46
Figure 3.6 Model Builder View for Geometry generation. . . 48
Figure 3.7 Single Layer Single Electrode Model. . . 49
Figure 3.8 Geometry design logic flow for 4DM. . . 50
Figure 3.9 Lithium Ion Battery component selection logic flow for 4DM. . . 52
Figure 3.10 Lithium Ion Battery electrode initialization logic flow for 4DM. . . 53
Figure 3.11 Porous electrode settings for the anode. . . 54
Figure 3.12 Pulse Discharge Current of 1C (4.6A) used to discharge the battery model. 55 Figure 3.13 Terminal Voltage (V) vs Time (s) to compare performance of COMSOL model and experimental data. . . 55
Figure 3.14 R2fit of Terminal Voltage from COMSOL and Experiment. . . 56
Figure 3.15 Single Layer Two Electrode Model. . . 57
Figure 3.16 Single Layer Multi Electrode Model. . . 57
Figure 3.17 The 4DM with multiple layers and multiple electrode materials. . . 58
Figure 3.18 Model update logic flow for 4DM. . . 59
Figure 4.1 Impact of operating conditions on battery components. . . 62
Figure 4.2 Representation of structural changes that can happen to the anode of the battery. . . 63
Figure 4.3 Terminal Voltage vs Time for Anode Concentration Degradation. . . 66
Figure 4.4 Relation of change of terminal voltage to anode concentration vs anode concentration. . . 68
Figure 4.6 Terminal Voltage vs time for Anode Volume Fraction Degradation. . . . 72
Figure 4.7 Change of terminal voltage to anode volume fraction vs anode volume fraction. . . 73
Figure 4.8 Terminal Voltage vs Time for Change in Transference Number. . . 78
Figure 4.9 Change of terminal voltage to transference number vs transference number. 79 Figure 4.10 Terminal Voltage vs Time for Change in Activity Coefficient of Negative Electrode. . . 81
Figure 4.11 Change of terminal voltage to anode activity coefficient vs anode activity coefficient. . . 82
Figure 4.12 Terminal Voltage vs Time for Change in Activity Coefficient of Positive Electrode. . . 82
Figure 4.13 Change of terminal voltage to cathode activity coefficient vs cathode activity coefficient. . . 83
Figure 5.1 Battery operation in charging mode with SEI. . . 91
Figure 5.2 Anode Conductivity Degradation due to Calendar Ageing. . . 95
Figure 5.3 Terminal Voltage (Vt) vs Time (s) with pulse discharge for Anode Con-ductivity Degradation due to calendar aging. . . 95
Figure 5.4 Terminal Voltage vs Time (s) for Concentration Degradation due to calendar aging. . . 96
Figure 5.5 Effect of Calendar Ageing on Concentration Degradation and its impact on Battery Capacity. . . 97
Figure 5.6 Film resistance growth vs time for calendar aging. . . 98
Figure 5.7 Capacity degradation due to SEI growth over a period of 3 years. . . 99
Figure 5.8 Terminal Voltage response due to calendar aging and SEI growth. . . . 99
Figure 5.9 RC Equivalent Circuit Model of the battery. . . 100
Figure 5.10 Effect on Calendar Ageing on Anode Conductivity Degradation and its impact on Internal Resistance (R0) of ECM. . . 101
Figure 5.11 Effect on Calendar Ageing on Anode Conductivity Degradation and its impact onR1&C1of ECM. . . 102
Figure 5.12 Effect of Calendar Ageing on Lithium Ion Concentration Degradation and its impact on Internal Resistance (R0). . . 103
Figure 5.13 Effect of Calendar Ageing on Lithium Ion Concentration Degradation and its impact onR1andC1. . . 103
Figure 5.14 Increase in the internal resistanceR0due to SEI growth. . . 104
Figure 5.15 Increase in the relaxation resistanceR1due to SEI growth. . . 105
Figure 5.16 Decrease in the relaxation capacitanceC1due to SEI growth. . . 105
CHAPTER
1
INTRODUCTION
energy resources [1].
With the advancement in battery/energy storage technology, it is crucial to ensure the safe and efficient usage of the battery. This led to the development of smart battery management systems (BMS). Battery management systems play an important role in improving the performance of the battery and ensuring that it operates in its optimal operating condition. Some of the important functions of the BMS include state of charge (SOC) estimation, state of health (SOH) estimation and state of function (SOF) estimation [2].
The SOC of the battery can be clearly defined as the percentage of charge left in the battery with respect to the nominal capacity of the battery. There have been a number of techniques developed to estimate the SOC of the battery based on the terminal voltage, the current drawn and the temperature of operation. Being a well-defined concept, the SOC estimation have been the focus of researchers for the past decade [3]. Even though the SOH is well defined, the factors that affect it are not comprehensively researched. The SOF of the battery is not a clearly defined concept and requires further research.
1.1
Factors that Affect the Health of the Battery
There are a number of factors that affect the health of a battery. The state of health of a battery represents the health of the battery at that time instant. The most significant factors are the temperature of operation, charge and discharge cycling, depth of discharge, overcharging, charge or discharge rates, and calendar aging [4].
the temperature is below the minimum operating temperature, the health of the battery decreases. This is often associated with the decrease in the capacity of the battery [5].
1.1.2
Charge/Discharge Cycling
Charging and discharging are important processes in the efficient use of the battery. However, they affect the performance of the battery, too. During the discharging process, the lithium ion moves from the cathode into the electrolyte and the lithium ion from the electrolyte moves into the anode and releases an electron. This process is reversed during charging. As this process takes place, it leads to breaking or wearing down of the electrode and results in capacity loss [6].
1.1.3
Depth of Discharge
The depth of discharge of the battery plays an important role in the aging of the battery. The battery undergoes irreversible chemical damage if it undergoes deep discharge, i.e., if the battery is discharged below the cut-off voltage. This could also result in hazardous results where the battery goes into thermal runaway [7]. Partial charging and discharging will also cause a decrease in the health of the battery. However, this effect has not been studied in detail.
1.1.4
Overcharging
1.1.5
Charge/Discharge Rate
The charge or discharge rate plays an important role in the aging of the battery. If the current used to charge is very high, then the battery reaches its maximum voltage fast. However, this would result in the formation of irreversible chemicals in the electrolyte. High charging currents also affect the electrodes. It results in cracking of the electrode because it is not able to accommodate the ions moving at such high speeds. All these effects combined cause a decrease in the capacity and a significant increase in the internal resistance of the battery [9].
1.1.6
Calendar Aging
Calendar aging is defined as the decrease in the ability of the battery to provide the power when new. This usually happens as the battery is used over time because of the decrease in the potency of the chemicals that are used to develop the battery. It also involves the forming of a layer over the electrode and prevents the electrode from reacting with the electrolyte immediately to produce current. Thus, some potential is required to overcome and breakdown the layer before the battery can be used, which results in the decrease in the battery capacity. Another factor that is similar to calendar aging is the concept of self-discharge. If a battery is stored for a long period, e.g., 6 months to 1 year, without usage, the chemical inside the battery tends to react with each other slowly to form some irreversible chemical. It generally affects the capacity of the battery and also increases the internal resistance of the battery. However, the effect of these kinds of aging is not significant when compared to the previously mentioned factors [10].
use different methods to estimate the capacity degradation and define the aging of the battery. The internal resistance estimation techniques compare the ratio of the internal resistance of the battery when it is new and its current internal resistance to determine the aging of the battery. The combination of capacity and internal resistance estimation techniques uses algorithms to estimate the capacity and internal resistance of the battery and then use inference-based algorithms to determine the aging of the battery based on the two parameters that were individually estimated.
Equation (1.1) describes the estimation of the SOH of the battery using the capacity degra-dation technique. Qcurrent is the current capacity in Ah, Qnominal is the nominal capacity of the battery in Ah. Equation (1.2) describes the estimation of the SOH of the battery using the internal resistance technique. Here,REOL is the internal resistance of the battery when it has reached its end-of-life (usually equal to twice the internal resistance of the battery when it is new [11]),Rcurrent is the current internal resistance of the battery andRnominal is the nominal
internal resistance of the battery.
SOH= Qcurrent
Qnominal ×100, (1.1)
SOH = REOL−Rcurrent
REOL−Rnominal ×100, (1.2)
1.2.1
Capacity Estimation Techniques
The capacity estimation techniques can be divided broadly into a number of categories based on the technique used to estimate it. Some of the commonly observed categories are model-based observers, inference-based techniques, constant current constant voltage (CCCV) approach, geometric approach, pulsed discharge approach and curve fitting approach.
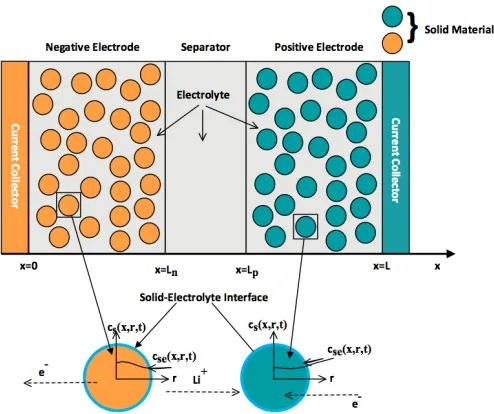
Equivalent RC circuit model. The electrochemical model [12] models the behavior of the battery based on the chemical reactions that take place inside the battery. These chemical reactions, modeled as partial differential equations (PDEs), take into account the concentration of lithium ions in the electrode and in the electrolyte to estimate the capacity degradation of the battery. In order to reduce computation, these PDEs are reduced into differentiation equations. This increases the speed of estimation of the parameters and solving of the equations to produce the capacity of the battery [13]. A electrochemical model of the battery is depicted in Fig. 1.1 and will be described in details in Chapter 2 section II of the thesis.
Figure 1.1: Electrochemical model of the battery.
Figure 1.2: A RC Equivalent Circuit of a battery.
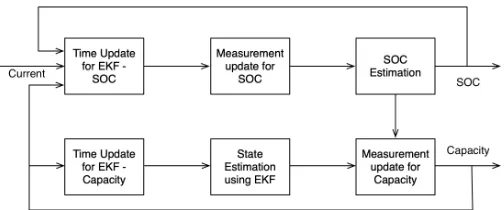
Kalman Filter is a popular technique because it is a well-structured process attempt to minimize the estimation error. It is often used on a linear system. Since the battery is a nonlinear system, more than one Kalman Filter has been used to estimate the capacity of the battery . Extended Kalman Filter (EKF) [14], Dual Extended Kalman Filter (DEKF) [15], Unscented Kalman Filter (UKF) are some examples of extending the Kalman Filter techniques for capacity estimation. The block diagram of the setup is depicted in Fig. 1.3.
Unlike the Kalman Filter, the Sliding Mode Observer (SMO) is designed for non-linear systems. The SMO uses the RC model of the battery to estimate the SOC. Then, it uses the rate of change in the SOC to estimate the capacity degradation of the battery [16].
Another technique that is used is the co-estimation algorithm that estimates the capacity of the battery based on an adaptive observer that determines the SOC of the battery using the open circuit voltage. This technique reduces the error in the estimation of the capacity by updating the parameters in the RC equivalent circuit model [3].
Figure 1.3: Block Diagram of Kalman Filter used for Capacity Estimation.
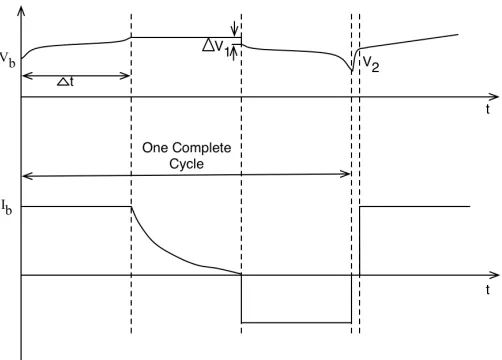
and the capacity of the battery and then combine them to produce an estimate of the SOH of the battery. Neural networks also uses the terminal voltage, the current, the SOC and the temperature as inputs to its neurons [14]. The weights of the neurons are updated using training data that are obtained by training the neural networks with known capacity degradation data for the input set. The probabilistic neural network (PNN) is an extension of the artificial neural network (ANN). It generates an output of the event with the highest probability of occurring. For capacity estimation, the battery is charged and then discharged and the voltage and time characteristics are obtained as depicted in Fig. 1.4 [18] where,∆tis the time taken for the battery
to reach the upper cut-off voltage during the constant current charge mode,∆V1is the voltage
drop from the maximum cut-off voltage of the battery when a discharge current is applied and V2is the rise in the terminal voltage during the rest period due to relaxation,Vbis the terminal voltage of the battery andIbis the applied current. The drop and rise in the terminal voltage (∆V1,V2) are also referred to as the over potentials of the battery.
This charging/discharging experiment is performed multiple times and the voltage, time and capacity information is used to train the network. Based on experimental data, it was observed that the capacity of the battery linearly decreased with the voltage parameters (∆V) and increased
Figure 1.4: Charge Discharge Curves for PNN.
constant current (between 0.1C to 1C). When the battery reaches the upper cut-off voltage, the voltage is held constant and the current is allowed to decrease until 0.01C. The capacity of the battery is estimated as the sum of the total current sent into the battery. Since the current drops all the way to 0.01C, it is possible to get a reasonably accurate estimate of the battery’s capacity.
The geometric approach for capacity estimation [19] is an extension of the CCCV approach. In this technique, four features are considered: the area under the CV curve, the time duration of the CV curve, the maximum radius of curvature of the CV stage and the slope of the voltage drop at the beginning of the discharge curve. Experimental data is used to develop the battery degradation curve. Using the concept of Laplacian Eigenmaps and k nearest neighborhood, the capacity of the battery is estimated.
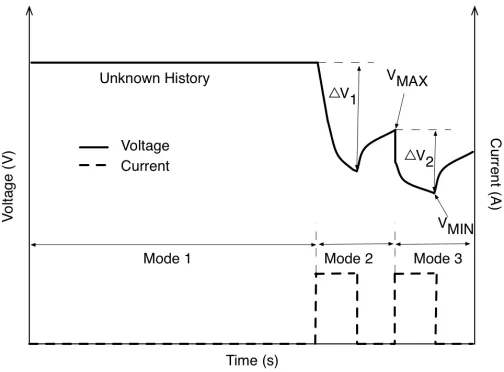
Figure 1.5: Pulsed Discharge Technique.
the internal electrochemical reactions have reached equilibrium and the battery has reached its open circuit voltage (OCV). On completion of mode 1, the battery is subjected to a known pulse current for a very short duration of 10s and the difference in the terminal voltage before the start of the current pulse and at the end of the current pulse is denoted as∆V1as shown in Fig. 1.5.
The battery is then subjected to a rest duration of 10s and the terminal voltage at the end of the rest period is assigned asVMAX. Another current pulse is applied to the battery for a duration of 10s, mode 3, and the battery’s voltage at the end of the current pulse is denoted asVMIN. The difference betweenVMAX andVMIN is assigned∆V2. UsingVMAX and∆V2, the capacity is
determined, and the SOH is determined using equation (1.1).
error is less than the set threshold value, the capacitanceCdi f f, as seen in Fig. 1.2, is used to estimate the degradation factor [22].
The discharge curve analysis is based on technique similar to CCCV. It is used for capacity estimation of batteries in a pack. This method uses the voltage capacity rate curve (VCRC) i.e. the rate of change of voltage with respect to change in capacity plotted against the discharge/charge capacity of the battery to identify scaling and offset parameters to match the VCRC of an aged battery to that of a new battery to determine the capacity degradation. To determine the optimum scaling and offset parameters, a genetic algorithm (GA) based approach is adopted to minimize the error in the VCRC of the new battery and the aged battery. On determining the scaling and offset parameters, the capacity of the aged can be determined by multiplying the scaling factor with the capacity of the new battery [23]. This method is often used when CCCV data is not available.
The exponential curve fitting for capacity loss technique involves the fitting of an exponential curve to determine the capacity of the battery as it degrades. Usually, the temperature and number of cycles are the main parameters in the equation [24].
The Moving Window Grey Model predicts the capacity of the battery based on the terminal voltage of the battery. It uses a time series forecasting model and historical information to predict the capacity of the battery [21].
1.2.2
Internal Resistance Estimation Techniques
The internal resistance of the battery can be calculated based on the drop in the terminal voltage. As the battery ages, the internal resistance of the battery is said to increase. As a result, different techniques have been established to identify the change in the internal resistance of the battery based on its usage and therefore predict the SOH of the battery.
techniques used to measure the internal resistance of the battery. EIS involves sending current pulses of very small magnitude and varying frequency to estimate the internal impedance of the battery. The value of the impedance of the battery when the frequency is 0Hz gives the internal resistance of the battery [25]. The model-based observer techniques involve the electrochemical model or the RC equivalent circuit model of the battery. In the electrochemical model of the battery, the degradation of the electrode, the decrease in the concentration of lithium ions and increase in the solid electrolyte interface layer thickness are indicative of the increase in the internal resistance of the battery. As for the RC equivalent model, it is possible to estimate the value of the internal resistance of the battery using observers like Kalman Filter and SMO as discussed in the Capacity Estimation Techniques section.
1.2.3
Limitations of the Current SOH Estimation Techniques
Currently used SOH estimation techniques define the end of life of batteries as 20% capacity degradation or doubling of internal resistance. However, there is no theoretical evidence to support these claims. Also, the capacity and the internal resistance of the battery are not the only indices that can be used to determine the SOH of the battery as discussed in Section II.
However, a combination of fuzzy logic and neural networks can be used. But this would require extensive training of the network and detailed domain knowledge to set up correct fuzzy rules and membership functions, which are time consuming, knowledge intensive, and tedious. The CCCV, geometric and pulse discharge approach are all time consuming to perform. The curve fitting approach is very restrictive to a particular battery at a particular operating point. As a result, it cannot be generalized. The traditional EIS technique is an expensive technique and requires a lot of computation to estimate the internal impedance of the battery. It also requires the battery to be at rest before it is tested. Therefore, it is time consuming and cannot be used in real time. There are modern techniques that use microcontrollers to inject send sinusoidal current signals to the battery to obtain its frequency response. This frequency response is then analyzed and the parameters of the RC equivalent circuit model are identified. While this technique is comparatively inexpensive, it still requires that the battery be injected with sinusoidal AC signals that are superimposed on the current signals applied to the battery [26],[27], [28]. This superimposition could potentially lead to incorrect estimation due to the shifting of the DC impedance depending on the amplitude of the current being applied to the battery.
1.3
State of Function Estimation
The State of Function (SOF) of the battery is defined as the ability of the battery to support a particular application in its current state [7]. This concept is mainly used to identify if the battery can be used to power the application in its current SOC and SOH.
1.3.1
Factors that Affect the SOF of the Battery
Some of the factors that affect the SOF of the battery are the SOH, the SOC, the State of Power (SOP), temperature and terminal voltage of the battery. The SOP of the battery is a concept developed based on the amount of power that a battery could provide to support an application. In [29], the possible outcomes of the SOF based on the SOC and the SOH of the battery are described in Table 1.1. The results in this table are established assuming that the temperature is constant. However, when the temperature changes, the rate of change of SOC and the rate of change of the SOH are different. Thus, it can be inferred that the SOF of the battery is directly related to the SOC, the SOH and the temperature of operation of the battery. Unlike the permanent effect of temperature on the SOH of the battery, the effect of temperature on the SOF of the battery is not permanent. Therefore, if the battery is in a temperature outside the operating range defined by the manufacturer, the SOF of the battery maybe 0.
Table 1.1: Possible SOF Values for Different SOCs and SOHs
SOC/SOH SOH is low SOH is high SOC is low SOF = 0 SOF = 0/1 SOC is high SOF = 0/1 SOF = 1
1.4
SOF Estimation Techniques
1.4.1
Power Demand Based Techniques
Power demand-based techniques uses the power demand of the application to determine the SOF of the battery. Based on the state of charge of the battery, it is possible to obtain the open circuit voltage of the battery from the VOC-SOC curve. Using the maximum change in the voltage and the capacity of the battery at that time instant, the instantaneous power that can be delivered can be calculated. Based on the amount of power that it can provide, it is possible to determine if the SOF of the battery is 1 or 0.
1.4.2
Terminal Voltage Based Techniques
This technique is similar to the power demand-based technique. It uses the terminal voltage of the battery to estimate the SOF of the battery. Based on historical information it is possible to identify the amount of voltage that dropped during the previous use of the battery for the same application. Based on the SOH of the battery, the current terminal voltage and the cutoff voltage of the battery, it is possible to determine if the battery can be used to power the application. The SOH of the battery is a very important factor in this estimation technique because it determines the rate of decay of the battery’s terminal voltage.
1.4.3
Limitations of the Current SOF Estimation Techniques
10 minutes. The battery that is used for the backup system cannot be used to power the radar system because it cannot deliver the required amount of power for the application. Therefore, the state of function of the battery for the radar application is 0. However, it may still be able to support the backup system for which the state of function of the battery is 1. Similarly, when the battery is subjected to extreme ranges of temperature, the battery’s state of function is affected. Consider the battery used in an electric vehicle with the average driving range of 100 miles for a full discharge. If the driver wishes to make a round trip of 90 miles then the SOF is 1. However, if the temperature drops below the range of the nominal operating conditions of the battery, then the capacity of the battery is affected. This reduces the driving range to 80 miles. Then the SOF of the battery is 0 because it cannot support the application. Therefore, it is crucial to develop a clear relationship between the SOF, the SOH, the SOC and the temperature of operation.
1.5
Outline and Contributions of this thesis
Currently, the determination of SOH of the battery is based on just two indices. These indices may not represent the battery entirety. Therefore, more indices are needed to be identified and a comprehensive relationship must be established between the SOH of the battery and these indices. Also, the effect of partial charging and discharging have not been considered on the SOH of the battery.
The SOF of a battery is a very application specific concept. Therefore, there is a lack of generic and reliable models that relate the SOC, the SOH, the operating temperature and the SOF of the battery.
is crucial in understanding on how to best utilize the battery to meet the user’s need. Without prior knowledge of the SOH, it is possible to over or underutilize the battery which can lead to disastrous consequences (e.g. thermal runaway) or high costs due to frequent replacements.
The contribution and innovation of this thesis is the bridging of the gap between material science, electrochemical and electrical engineering. The 4DM provides a platform for to design existing or new batteries using different materials, modeling their electrochemical reactions to generate voltage profiles and use the voltage and current profiles to develop relationships between material degradation, electrochemical reactions and voltage profiles. This thesis explores the the Lithium Nickel Manganese Cobalt Oxide battery’s materials, electrochemical reactions and electrical profiles to study the sensitivity of the voltage and capacity of the assembled battery to different kinds of degradation phenomena occurring to the materials of the battery. Research and simulations have also been done to explore the impact that calendar aging has on the degradation of the battery components.
The contributions of the 4DM are that it can save significant time and resources and can simulate the working of batteries of different sizes, shapes and chemistries without requiring manufacturing. Real batteries’ performance varies because of manufacturing variations and differential aging. Battery testing can take years under fixed operating conditions to obtain meaningful results. Accelerated aging cannot give a clear idea of the impact of the operating condition because the battery is subjected to multiple operating conditions to age the battery faster. But the 4DM can simulate exact operating conditions and perform experiments repeatedly with minimum variation for better analysis and obtaining statistically significant/meaningful conclusion on the impact of operating conditions on the degradation of the battery. Because of the ability of the 4DM, it is possible to improve repeatability of experiments. The 4DM can speed up the time required to perform long drawn experiments and provide results in the matter of few hours instead of years.
the behavior of the model over long periods of time. When compared with the state-of-the-art, 4DM is based on physics of operation and uses a layer-based modeling approach for high resolution degradation modeling to highlight the progressive effects of degradation phenomena. The 4DM can help simulate these effects because the components are modeled in layers to provide the required resolution for the simulation of these phenomena.
The 4DM is designed to integrate the effect of temperature and other operating conditions in the components of the battery. This feature would reflect the impact that operating condi-tions have on the different components of the battery and therefore the performance of the battery. Therefore, the 4DM is capable of simulating the effect of operating conditions such as temperature, C-rate, calendar aging, etc. on the components of the battery.
Performing real experiments to study and analyze the impact of partial charging and dis-charging can be very time and resource consuming. It is also not possible to study the impact the partial charging and discharging have on different components of the battery. As a result, it may not be possible to obtain statistically significant information to prove the hypotheses on the effect of partial charging and discharging. With the 4DM, it is possible to simulate different operating conditions, depths of discharge. The 4DM, being a simulator, has the ability to provide repeatability and reproducibility of results and can therefore provide statistically significant information to draw conclusions on the effect of partial charging and discharging on the performance and degradation of the battery and its components.
CHAPTER
2
BATTERY CHEMISTRIES AND PHYSICS
- BASED MODELING METHODS
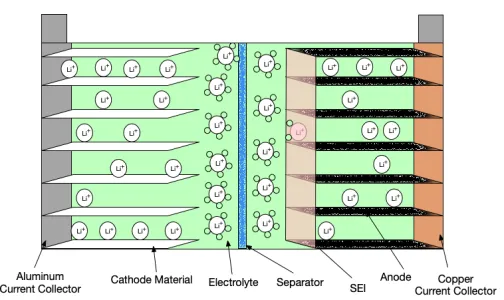
Figure 2.1: Components of the battery.
depending on the kind of battery. There are three major properties of electrolytes that must be considered when selecting an appropriate electrolyte - polarization potential, ionic conductivity and electronic conductivity. The polarization potential determines the maximum potential drop the electrolyte can handle before beginning to break down. The ionic conductivity determines the ability of the electrolyte to conduct ions while the electronic conductivity determines the ability to conduct electrons.
The separator in a battery plays the role of electrically isolating the anode and the cathode to prevent an internal short of the battery. The separator is made of a porous material that is doused in the electrolyte to enable movement of ions from one electrode to another while ensuring electrical isolation.
explained using the equations (2.1) and (2.2): At the cathode: (Gain of Electrons - Reduction)
Li(1−x)CoO2+xLi++xe−*)LiCoO2. (2.1)
At the anode: (Loss of Electrons - Oxidation)
CnLix*)Cn+xLi++xe−. (2.2)
During charging, the electrons flow in the opposite direction resulting in an oxidation reaction at the cathode and reduction reaction at the anode.
2.1
Popular Battery Chemistries
There are a number of different battery chemistries that are being developed every day. The popular ones are: Lead Acid (PbA/VRLA, etc.), Nickel Cadmium (NiCd, NiCad, etc.), Nickel Metal Hydride (NiMH) and Lithium Ion. This subsection will discuss the working, advantage and disadvantages of these battery chemistries.
2.1.1
Lead Acid
The Lead Acid battery uses Lead alloys (Pb) for electrodes and Sulfuric acid (H2SO4) for the
electrolyte. Lead-alloys are preferred over pure Lead because Lead, by itself, is a very soft metal and would not be able to mechanically support itself as an electrode structure. Often elements such as Antimony, Calcium, Tin and Selenium are used to create alloys to provide mechanical stability. The major reactive electrode materials are a Lead alloy and Lead (II) Oxide alloy (PbO2). The Lead alloy is the negative electrode and the Lead Oxide alloy is used at the positive
electrode. A separator is used to electrically isolate the positive and the negative electrode. During battery discharge, the Lead and Lead Oxide alloys react with the Sulfuric acid to form Lead Sulfate (PbSO4) and water (H2O). The reactions at the positive and negative electrode are
given in equations (2.3) and (2.4): At the positive electrode: (Gain of Electrons - Reduction)
PbO2+HSO−4 +3H++2e−→PbSO4+2H2O. (2.3)
At the negative electrode: (Loss of Electrons - Oxidation)
These reactions cause a cell potential of 2.05V. In a typical lead acid battery, 6 cells are put together in series to obtain a total voltage of 12V. The specific gravity of the Sulfuric acid is often used as a gauge to determine the SOC of the Lead Acid battery. This can be inferred based on the chemical reactions where the Sulfuric acid is consumed during discharge.
The advantages of Lead Acid batteries are: low cost, high reliability and tolerance to abuse (overcharging), low internal impedance, can generate high C-rates. It is available in a wide range of sizes and capacities based on the application requirement and is easily recyclable.
The disadvantages are: very heavy and bulky, the efficiency ranges between 70 -90%, can overheat during charging, cannot be fast charged, typical life is between 300 to 500 cycles.
2.1.2
Nickel Cadmium
The Nickel Cadmium (NiCd) battery uses a Nickel (III) Oxy-Hydroxide (NiO(OH)) as the positive electrode and Cadmium (Cd) as the negative electrode. The electrolyte in a NiCd battery is an alkaline solution of Potassium Hydroxide (KOH). During discharge, the Cadmium in the negative electrode reacts with the hydroxide ions (OH−) in the electrolyte to form Cadmium Hydroxide (Cd(OH)2), while the Nickel Oxide Hydroxide (NiO(OH)) reacts with the water
in the electrolyte to form Nickel Hydroxide (Ni(OH)2) and hydroxide ions. The Potassium
Hydroxide in the electrolyte helps ionize the water and generate the hydroxide ions for the reaction to take place. The chemical reactions at the electrodes are given in equation (2.5) and (2.6):
At the positive electrode: (Gain of Electrons - Reduction)
At the negative electrode: (Loss of Electrons - Oxidation)
Cd+2OH−→Cd(OH)2+2e−. (2.6)
These reactions cause a cell potential of 1.20V per cell. Often NiCd cells are connected in series to make batteries of higher voltage ranges. Unlike the Lead Acid battery, the Potassium Hydroxide electrolyte does not get consumed during the chemical reaction and therefore, cannot be used as an indicator of the SOC of the cell. Therefore, a voltage-based estimation is required to determine the SOC of the NiCd cell.
The advantages of Nickel Cadmium batteries are that they are rugged and can have very high cycle count if they are maintained properly. They have high tolerance to abuse and fast charging and can be stored at fully discharged state. They can be easily stored for long durations and can perform well under low temperatures. Being low cost, it is often used in many applications and can easily be created for different sizes.
One of the key disadvantages of the NiCd batteries is their memory effect. They need to be regularly discharged all the way to 0% to ensure that the entire capacity is rejuvenated. The other disadvantages of NiCd batteries are that they have a very low energy density compared to the newer technologies in the market. Cadmium is a very toxic metal and recycling it can be very problematic. NiCd batteries have very high self-discharge rate and very low voltage levels.
2.1.3
Nickel Metal Hydride
electrode, the NiO(OH) reacts with water to form Ni(OH)2and generate a hydroxide ion. The
chemical reactions are given in equations (2.7) and (2.8): At the positive electrode: (Gain of Electrons - Reduction)
NiO(OH) +H2O+e−→Ni(OH)2+OH−. (2.7)
At the negative electrode: (Loss of Electrons - Oxidation)
MH+ (OH)−→M+H2O+e−. (2.8) The reaction generates a voltage of 1.20V/cell. As a result, the NiCd and NiMH cells can be used interchangeably because of their voltage limits. Similar to the NiCd, the KOH electrolyte is not consumed during the reaction and therefore requires a voltage based SOC estimation to determine the charge level of the cell.
The NiMH cells has all the advantages of the NiCd cells and some more. Even though NiMH is very similar to the NiCd cell, it has a 30-40% higher capacity than the standard NiCd cell. Unlike the NiCd cell, the NiMH is less toxic and less prone to the memory effect. These cells can handle a wide range of temperatures and can be easily recycled for the Nickel content.
2.1.4
Lithium Ion
Lithium is the smallest and most reactive metal in the periodic table thereby making it a suitable candidate for usable in energy storage systems. The small size ensures the high reaction rates and low activation energy which results in very high theoretical capacity i.e. 3860mA/g. In lithium ion batteries, graphite is often used as anode material and a lithium metal oxide is used as the cathode material. Lithium ion batteries voltages varies from 2V to 4.25V depending on the cathode material used for the battery.
Lithium batteries have two major kinds of operation - deposition-based and intercalation based. In deposition-based lithium batteries, the lithium ions are deposited on the surface of electrodes. A major limitation of this type of batteries is that it can lead to dendrite formation. Dendrites, a thin long wire-like structures, are formed due to the improper deposition of lithium ions as a result of inappropriate utilization of batteries. These dendrites could grow and result in piercing of the separator and cause internal shorting of the battery. Thus, lithium metal-based batteries are not often used. The intercalation method involves lithium ions moving into the electrode material and filling in the lattice space/ structure to form temporary chemical bonds with the electrode material. This method of operation is safer compared to lithium deposition and is therefore adopted in most lithium ion-based batteries. There are different physics-based models developed to represent the working of lithium ion batteries, based on intercalation, as discussed in the following subsection.
2.2
Current Physics Based Models
2.2.1
1D Model
In the 1D model, the battery is modeled as a line. The anode, the cathode and the separator are modeled as line segments shown in Fig. 2.3.
Figure 2.3: 1D Model of a battery.
In this model, the current collectors are modeled as points on either end. During charging or discharging, lithium ion flows to the anode or cathode respectively through the separator. The separator is assumed to be ideal. The model approximates the partial differential equations to piece-wise linear equations and solves for the change in the concentration of the lithium ions during the charging or discharging. This assumption thereby provides only steady state results and is incapable of capturing transient changes in concentration. These transient concentrations reflect the rate of relaxation especially during operations of pulse charging or discharging. The relaxation rate is used to determine the degradation that the electrolyte has undergone.
Conservation of Li in a single spherical particle of active material as per Fick’s Laws of Diffusion:
cs(r=0)−cs(r) = (Ir2)/(2aFDsδRs), (2.9)
electrode and F is Faraday’s constant (96,487 C/mol).
Open Circuit Potential at the cathode as a function of concentration for LMO:
φs+ =4.19829+0.0565661 tanh[−14.5546y+8.60942] −0.0275479
"
1
(0.998432−y)0.492465−1.90111 #
−0.157123 e−0.04738y8+0.810239e−40(y−0.133875),
(2.10)
where,yis the amount of lithium inserted into the LMO electrode (LiyMn2O4). Open Circuit
Potential at the anode as a function of concentration for graphite:
φs− =−0.16+1.32e
−3.0x+10.0e−2000.0x, (2.11)
wherexis the amount of lithium present into the graphite electrode (LixC6).
The change in potential is calculated using Ohm’s Law, the conductivity of the materials and the current applied to the battery [31].
The advantage of this technique is that it requires very little computation and can produce results in the order of 10s of seconds. The disadvantage of this model is that it cannot simulate the degradation of the different parameters of the battery. For example, the degradation of the anode results in a difference in the distribution of current i.e. the current density. These effects cannot be observed using the 1D model of the battery.
2.2.2
Pseudo 2D (P2D) Model
the radius of the electrode and not truly a second dimension. This model works similar to the 1D model but also includes the effect of diffusion in the electrolyte and solid (electrode) phases as well as the Butler Volmer kinetics for modeling the electrode kinetics. The model is developed using partial differential equations that relate the concentration of lithium ions and the potential in the electrode and electrolyte with the current flow as time varies along the radius of the particle and the length of the cell. There are two main concepts that are used to model the electrochemical reactions using partial differential equations - conservation of mass and conservation of charge. The conservation of mass and charge are applied to the solid electrode and liquid electrolyte.
Figure 2.4: P2D Model of a battery.
Conservation of Li in a single spherical particle of active material as per Fick’s Laws of Diffusion:
∂cs ∂r
r=0
=Ds
∂cs
∂r
r=Rs
=− j
Li
asF, (2.13)
wherecs represents the concentration of the lithium ions in the solid electrode in mol/m3,Dsis the solid phase diffusion coefficient in m2/s,ris the distance from the center of the spherical particle used to represent the electrode to a point on the radiusRs in m,jLi is the volumetric rate of electrochemical reaction at the surface of the particle in A,as is the spherical surface area of the electrode interphase in m2and F is Faraday’s constant (96,487 C/mol).
Conservation of Li in the electrolyte as per Fick’s Laws of Diffusion:
∂(εece)
∂t =
∂
∂x
De f fe ∂ce
∂x
+
1−t+0 F
jLi, (2.14)
∂ce
∂x
x=0
= ∂ce
∂x
x=L
=0, (2.15)
wherecerepresents the concentration of the lithium ions in the electrolyte in mol/m3,εe is the
electrolyte phase volume fraction,De f fe is the effective diffusion coefficient in the electrolyte phase in m2/s calculated using the reference diffusion coefficient of the electrolyte and the volume fraction of the polymer solvent in the electrolyte (De f fe =Deεep) to account for the
tortuous path taken by the Li ions while moving through the electrolyte,xis the position of the particle in m at any time instantt,t+0 is the transference number of Li ions with respect to the velocity of the solvent andLis the length of the battery in m.
Conservation of charge in the electrode as per Ohm’s Law:
∂
∂x
σe f f∂ φs ∂x
− jLi=0, (2.16)
−σ−e f f∂ φs
∂x
x=0
=σ+e f f∂ φs ∂x
x=L
= I
A, (2.17)
∂ φs
∂x
x=δ− = ∂ φs
∂x
x=δ−+δsep
whereσe f f represents the conductivity of the solid electrode material in S/m,φsis the potential
on the surface of the electrode in V,I is the current applied in A,Ais the surface area of the electrode in m2,δ− is the thickness of the negative electrode in m andδsepis the thickness of
the separator in m.
Conservation of charge in the electrolyte as per Fick’s Laws of Diffusion:
∂
∂x
κe f f∂ φe
∂x +κ
e f f D
∂lnce
∂x
+jLi=0, (2.19)
∂ φe
∂x
x=0
= ∂ φe
∂x
x=L
=0, (2.20)
κDe f f = 2RTκ
e f f
F (t
0
+−1)
1+∂ln f±
∂lnce
, (2.21)
where, κe f f represents the effective ionic conductivity of the electrolyte in S/m, φe is the
electrolyte phase potential in V,cs,eis the concentration of lithium ions at the solid - electrolyte interface in mol/m3,κDe f f is the effective diffusional conductivity in S/m, Ris the universal
gas constant in J/mol K,T is the temperature of operation of the battery in K and f± is the electrolyte activity coefficient that is unitless.
The partial differential equations described above are used to model the changes in concen-tration and potential across the different phases of the battery. These variables are coupled to using the Butler-Volmer electrochemical expression given in equation (2.22).
jLi=asi0
eαRTaFη−e−
αcF RT η
, (2.22)
wherei0is the exchange current density in A/m2,αais the anodic coefficient,αcis the cathodic
thermody-The exchange current density is calculated using the concentration of the solid and electrolyte phase with the formula in equation (2.23).
i0=k(ce)αa(c
s,max−cs,e)αa(cs,e)αc, (2.23)
wherekis the kinetic rate coefficient and is unitless.
The terminal voltage of the battery is calculated using the difference between the surface potentials at either electrodes and the potential drop due to the surface impedance of the electrodes:
Vt=φs+−φs−−
Rf
A I, (2.24)
whereVt is the terminal voltage of the battery in V,φs+ is the potential on the surface of the
positive electrode/cathode in V,φs− is the potential on the surface of the negative electrode/
anode in V,Rf is the contact resistance between the current collector and the electrode surface in Ohms.
Using these set of coupled partial differential equations and linear equations, it is possible to model the behavior of the lithium ion battery in a pseudo-2D perspective. The advantage of this model over the 1D model is that it can estimate the electrolyte concentration, electrolyte potential, electrode potential and electrode concentration in the electrode and the electrolyte potential and concentration in the separator. One of the disadvantages of this model is that it cannot show the distribution of the current density on the surface of the electrode.
2.2.3
Pseudo 3D Model
current flow on the surface of the electrode and the solution current. Conservation of charge in the electrode and electrolyte:
I−i2=−σ∇φs, (2.25)
withi2=Iat the boundary of the anode separator interface,i2=0 at the boundary of the cathode separator interface, wherei2is the current in the solution phase in A.
This approach models the electrode surface as a network of resistors to develop a current flow pattern on the surface of the electrode as well as generate a temperature distribution based on the heat generated by the resistors [34].
CHAPTER
3
FIRST PRINCIPLE BASED
FOUR-DIMENSIONAL DEGRADATION
MODEL (4DM)
3.1
Capabilities of 4DM
• progressive component degradation,
• different operating conditions - C-rates, temperatures, depth of discharge, partial charging and discharging effects,
• component degradation over time
This thesis has developed a 4DM computer simulation model for battery dynamics studies under different degradation and operating conditions. The 4DM provides a platform to study the sensitivity of the battery’s rate of change of voltage and capacity with respect to the degradation of different physical and electrochemical components. This feature/capability of the 4DM enables users to better understand the impact of different operating conditions on the degradation of their battery and determine appropriate use cases for their batteries to prolong the remaining useful life.
The 4DM has an intuitive user-interface that assists the user to perform different tests on the model under different operating conditions. The user interface is designed to be simple, yet intuitive and capable of providing the user with sufficient options to understand the working of the 4DM with access to the core back-end tool with all the features. Fig. 3.1 shows the user interface developed using COMSOL [35] that provides the user the ability to change the battery capacity, discharging or charging current and operating temperature in the Cell Parameter definition tab. The Simulation Parameters definition tab gives the user the option to select the simulation start time, end time and time step as well as the option to simulate the operation of the battery over calendar years.
3.2
Design of the Four-Dimensional Degradation Model (4DM)
Figure 3.1: The Graphical User Interface developed for the 4DM operation.
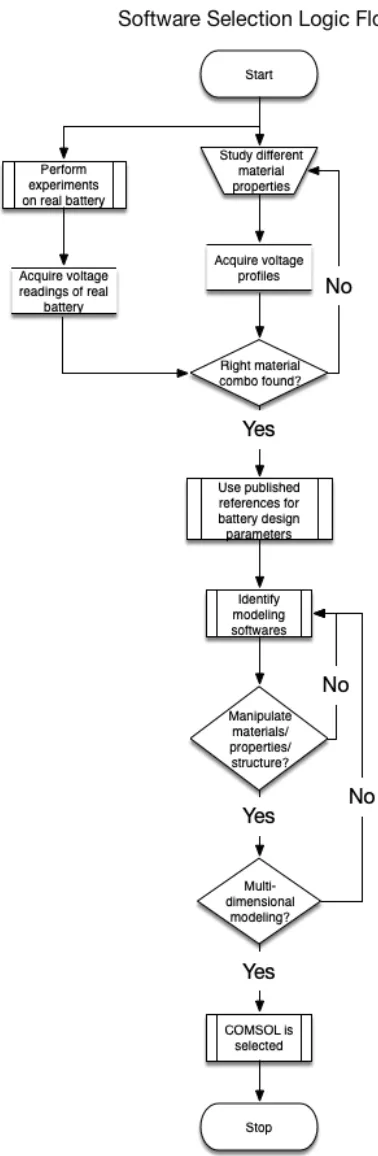
3.2.1
Software Selection - COMSOL
3.2.2
Design Parameters of the 4DM
The 4DM is designed based on the physics of operation of the battery, i.e., the actual components such as anode, cathode, electrolyte, separator and current collector, are used to construct the model. This particular approach is used to bridge the gap between material science, electro-chemical and electrical engineering. From an electrical engineering perspective, the key aspects that are used to qualify the battery are the voltage limits and the capacity of the battery. The electrical aspects of the battery are determined by the electrochemical reactions that take place inside the battery - which are determined based on the materials selected to make the battery. Equation (3.1) describes the relationship between the capacity and the physical parameters of the battery.
Q=δ εsAFcs,max(θ100−θ0), (3.1)
whereQis the capacity of the battery in Ah,δ is the thickness of the electrode material in m,εs
is the volume fraction of the electrode material,Ais the surface area of the electrode material, F is Faraday’s constant (96,487C/mol),cs,max is the maximum concentration of Lithium ions in the electrode material in mol/m3,θ100 is the stoichiometry (relative concentration/quantity
expressed as a ratio between 0-1) of the electrode at 100% SOC andθ0is the stoichiometry of
the electrode at 0% SOC.
Evidently, the capacity of the battery depends on the volume of electrode material present as well as the volume fraction of the electrode, i.e., the ratio of the total volume of active material present to total volume of the electrode. Another aspect of the capacity is the maximum concentration of lithium ions in the electrode surface as well as the stoichiometric coefficients
θ100 and θ0. These parameters determine the maximum lithium ions that the electrode can
increase the resistance to the flow of ions due to the concentration gradient. These limits are highly dependent on the electrode material selected to make the battery.
The terminal voltage of the battery is determined by the voltage generated due to the intercalation of lithium ions into the electrode material. Thus, the concentration of lithium ions on either electrode determines the potential on the surface of the electrode. The formula to calculate the terminal voltage of the battery is given in equation (3.2).
Vt=φs+−φs−−
Rf
A I, (3.2)
whereVt is the terminal voltage in V,φs+ is the surface potential on the cathode in V,φs− is
the surface potential on the anode in V andRf is the contact resistance between the current collectors and the electrodes inΩ/m2.
Cathode
Figure 3.3: Voltage vs SOC of different cathode materials.
Table 3.1: Cathode Materials and their specifications
LCO LMO NMC
Voltage(V) 4.3-2.4V 4.25-3.6V 4.25-3.5V Specific Energy (Wh/kg) 150-200 100-150 150-220
Cycles 500-1000 300-700 1000-2000 Thermal Stability 150◦C 250◦C 210◦C
C-rate <=1C <=10C <=2C
LFP NCA LTO
Voltage(V) 3.5-3.2V 4.3-3.2V 2.2-1.2V Specific Energy (Wh/kg) 90-120 200-260 50-80
Cycles 1000-2000 400-500 3000-7000 Thermal Stability 270◦C 150◦C 170◦C
C-rate <=1C <=1C <=10C
Anode
The anode material for Lithium ion batteries are usually selected based on their ability to form temporary bonds with the lithium ions, i.e., very high ionic conductivity. Another key aspect that is required of a suitable anode material is its intercalation expansion capability without cracking or deformation. Based on these properties there are two major types of anode materials - lithium metal-based and graphite-based anodes.
Lithium Metal Anode
Lithium metal forms a very good anode material for lithium ion batteries because of its high specific capacity (3860mAh/g), low density (0.59g/cm3) and lowest negative electrochemical potential with hydrogen (-3.040V). However, using Lithium as an anode material results in very high dendrite formation and low Coulombic efficiency. Dendrite formation can lead to internal shorting of the battery and result in catastrophic failure and thermal runaway. As a result, Lithium metal is not considered for anode materials [36].
Graphite Anode
Figure 3.4: Graphite voltage (y-axis) vs SOC (x-axis).
the concentration of lithium ions in the anode should never go to zero because this would result in deep discharge of the battery and cause irreversible damage to the anode and prevent it from accepting any more lithium ions.
Electrolyte
The electrolyte of Lithium ion batteries must have very high ionic conductivity and very low electronic conductivity. The low electronic conductivity is to ensure very low self-discharge as well as potential side reactions that may occur due to the availability of free electrons and ions. The high ionic conductivity determines the C-rate at which the battery can be charged and discharged without undergoing significant degradation. The di-electric coefficient of the electrolyte needs to be considered to determine the maximum and minimum voltage drop across the electrolyte - which could contribute to the internal resistance of the battery. The most common electrolyte used in Lithium ion batteries is the Lithium Hexa Fluro Phosphate (LiPF6)
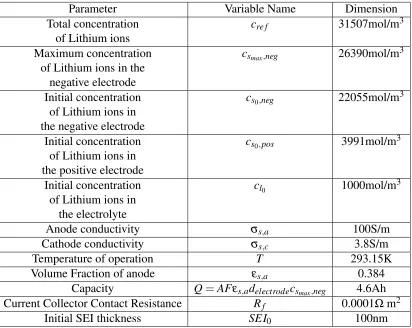
Table 3.2: Physical Parameter of 4DM of a Li-Ion battery under study.
Parameter Variable Name Dimension
Height of battery H 111mm
Width of battery W 105mm
Thickness of electrode delectrode 1.45mm Thickness of electrolyte delectrolyte 6mm
Current Collectors
Current collectors are metals that have very high electronic conductivity and are used to collect the current flowing through the external circuit and pass it along to the electrode material with minimal loss. In Lithium ion batteries, the current collector at the anode is usually Copper and the current collector at the cathode is usually Aluminum. Copper and Aluminum are selected because of their low cost and high conductivity. Aluminum is selected as the current collector for the cathode because of its high oxidation potential (5V vs Li/Li+) i.e. the voltage required to convert metallic Aluminum to Aluminum ions. Copper, on the other hand, is used at the anode because it has a high reduction potential (3V vs Li/Li+) meaning that the voltage at the anode needs to reach at least 3V to convert the metallic Copper to Copper ions. Based on the current materials being used for cathode and anode, it can be seen that the maximum voltage that the cathode experiences is 4.3V and the maximum voltage that the anode experiences is 2.8V. Therefore, unless the battery is overcharged or over-discharged, Aluminum and Copper can be safely used as current collectors [39].
3.2.3
Single Layer Single Electrode Model
Based on the discussion in the previous section, a battery was designed using a NMC cathode, a Graphite anode, a LiPF6 in 1:2 solution of EC:DMC and Copper and Aluminum current
Table 3.3: Electrochemical Parameters of 4DM of a Li-Ion battery under study.
Parameter Variable Name Dimension
Total concentration cre f 31507mol/m3
of Lithium ions
Maximum concentration csmax,neg 26390mol/m3
of Lithium ions in the negative electrode
Initial concentration cs0,neg 22055mol/m3
of Lithium ions in the negative electrode
Initial concentration cs0,pos 3991mol/m3
of Lithium ions in the positive electrode
Initial concentration cl0 1000mol/m3
of Lithium ions in the electrolyte
Anode conductivity σs,a 100S/m
Cathode conductivity σs,c 3.8S/m
Temperature of operation T 293.15K
Volume Fraction of anode εs,a 0.384
Capacity Q=AFεs,adelectrodecsmax,neg 4.6Ah Current Collector Contact Resistance Rf 0.0001Ωm2
Figure 3.6: Model Builder View for Geometry generation.
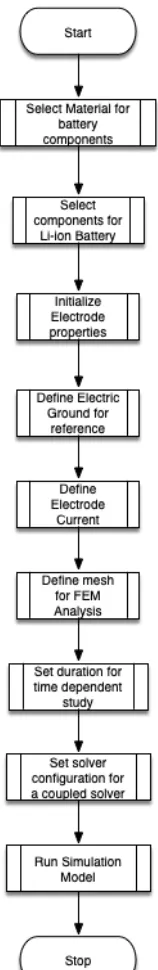
Using the parameters described above, a single layer single electrode model was created. The single layer single electrode model was developed as a proof of concept to test the validity of the parameters discussed above.
to be assigned to the model. The porous electrode domain is used to represent the electrode and the electrolyte in the pores of the electrode. Since, in Lithium Ion Batteries, both electrodes are in contact with the electrolyte, the porous electrode domain is selected. This porous electrode domain takes into account the charge balance in the electrode phase and the electrolyte in the pores of the electrode. In the porous electrode domain, there are two attributes that are available to define the electrode kinetics and species transport. The electrode kinetics are defined by the porous electrode reaction attribute and provides the ability to define and model the electrode kinetics during the charge transfer reactions i.e. charging or discharging. The species transport properties are used to define the models used to represent the movement of lithium ions during the charging and discharging of the battery. Since lithium ion batteries use intercalation of lithium ions instead of deposition, the intercalation properties and the species transport properties are setup in the Particle Intercalation attribute. Simple Butler-Volmer reaction kinetics were used to represent the current flow as defined in Equation (2.22). This porous electrode domain is assigned to the negative electrode or the anode by selecting the domain on the 3D geometry as well as initializing the material associated with the domain. The temperature of operation is set to 293.15K (20◦C) and the electrolyte and electrode materials are set to LiPF6
and Graphite as discussed in the previous section. Similarly, a porous electrode is defined for the cathode. For this model, the default material properties and simple Butler-Volmer reaction kinetics were used to check the feasibility of the approach. Fig. 3.9 and Fig. 3.10 show the flow chart that describe the procedure to select the appropriate components for the model and the initialization of the electrodes.The porous electrode settings window for the anode is shown in Fig. 3.11.
Figure 3.11: Porous electrode settings for the anode.
the anode due to lithium ion intercalation. The cathode surface is used to declare the electrode current, i.e., the applied current on the terminals of the battery. The cathode is selected because the anode is declared as the reference ground and applying a current on the anode would result in "shorting" of the current source and ground.
A current pulse of 1C (4.6A) was used to pulse discharge the battery for a period of 600s and then the battery was allowed to rest for another 600s for 3600s as shown in Fig. 3.12. This pulse discharge experiment was conducted to determine if the model was able to replicate the discharge and relaxation curve of a real lithium ion battery. A variable was initialized in the Global Definitions section to define the current that needs to be applied on the battery.
Figure 3.12: Pulse Discharge Current of 1C (4.6A) used to discharge the battery model.
3.13, it can be observed that the COMSOL model provides almost the same results as the real battery and therefore can be used as a good representative of the battery for future simulations. The R2value of the experimental data and the COMSOL result was obtained to be 0.99. The R2 fit is shown in Fig.3.14.
Figure 3.14: R2fit of Terminal Voltage from COMSOL and Experiment.
3.2.4
Single Layer Multi-Electrode Model
Figure 3.15: Single Layer Two Electrode Model.
Figure 3.17: The 4DM with multiple layers and multiple electrode materials.
3.2.5
Multi-Layer Multi-Electrode Model
CHAPTER
4
DEGRADATION PHENOMENA &
SENSITIVITY ANALYSIS
4.1
Battery Aging
However, the impacts of these aging phenomena in the literature so far have been typically represented using only two indices - capacity and internal resistance of the battery. This results in a many to one mapping, making it hard to determine the cause of the degradation. Fig. 4.1 shows the components that different operating conditions have an impact on. The impact that partial charging/discharging has on the components of the battery is still not clearly researched and studied because of the variability associated with experiment design, the requirement of resources and the manufacturing differences associated with battery development.
4.2
Three Major Classes of Degradation
There are three major classes of degradation phenomena in a battery viz. (1) loss of active material, (2) loss of lithium inventory, and (3) side reactions. The following section will discuss the different kinds of degradation phenomena in each of these classes.
4.2.1
Loss of active material
Figure 4.2: Representation of structural changes that can happen to the anode of the battery.
Structural changes refer to the changes in the macrostructure as well as the microstructure of the electrode. When exposed to charging and discharging, the battery’s anode is more susceptible to changes in its structure because of its need to expand to accommodate the intercalating lithium ions. When designed the battery’s anode is similar to Fig. 2.1. However, as the battery begins to be used, the structure of the anode starts changing either due to wear and tear or as a result of cracking. This would result in a structure similar to Fig. 4.2 and exposing a larger area of the electrode material to the electrolyte and provide a path with increased resistance to the intercalating lithium ions.
Binder degradation is similar to the structural changes but the loss of the binding material that holds the electrode in position. This degradation can result in the movement of the electrode material and thus result in lesser electrode material available to react with the lithium ions to generate current.
4.2.2
Loss of Lithium inventory
plating happens when the lithium ion is unable to intercalate into the electrode and instead gets deposited on the surface of the electrode and forms an irreve