ABSTRACT
SAHBAEE BAGHERZADEH, ARASH. Abrasion and Pilling Resistance of Nonwoven Fabrics Made from Bicomponent Fibers. (Under the direction of Dr. William Oxenham.)
The purpose of this research is to investigate key factors that affect structure and abrasion resistance of nonwoven fabrics produced from bicomponent fibers. The main objective of producing bicomponent fibers is to develop capabilities not existing in either polymer alone. By this technique, fibers with different cross sectional shape or geometry can be produced. Bicomponent fibers are commonly classified by their fiber cross section structures as side-by-side, sheath-core, islands-in-the-sea and citrus fibers or segmented-pie cross section types.
The properties of nonwoven fabrics are primarily determined by the properties of the fibers used to make them. Fundamentally, a fiber property is the response of a fiber to an imposed chemical environment or physical force.
Abrasion and Pilling Resistance of Nonwoven Fabrics
Made from Bicomponent Fibers
by
Arash Sahbaee Bagherzadeh
A thesis submitted to the Graduate Faculty of North Carolina State University
in partial fulfillment of the requirement for the Degree of
Master of Science
Textile Management and Technology Raleigh, North Carolina
November, 2007 APPROVED BY:
Dr. Pamela Banks-Lee Dr. Hoon Joo Lee Dr. William Oxenham
ii
DEDICATION
With lots of love to the best sister in the world, Azadeh and the best friend
iii
BIOGRAPHY
iv
ACKNOWLEDGMENTS
v
TABLE OF CONTENTS
LIST OF TABLES ... vii
LIST OF FIGURES ... viii
1 Introduction ... 1
1.1 Specific Objective ... 1
2 Literature Review ... 3
2.1 Definition of Nonwoven ... 3
2.2 General Remarks ... 4
2.3 Nylon Fibers ... 9
2.4 Polyester Fibers ... 10
2.4.1 General Polyester Fiber Characteristics: ... 10
2.4.2 Relationship between Structure, Properties and Processing
Parameters of PET Fibers ... 11
2.4.3 Mechanical Properties of Polyester Fibers ... 11
2.5 Bicomponent Fibers ... 12
2.6 Abrasion of Nonwoven ... 15
2.6.1 Pilling ... 16
2.6.2 Pilling is promoted by a number of factors: ... 18
3 Discussion of Experimental Methodology ... 20
3.1 General Information ... 20
3.2 Experimental Design ... 25
3.3 Measuring Methods ... 26
4 Result and Discussion ... 29
4.1 Segmented Fiber ... 29
4.2 Islands-in-the-Sea Fibers ... 30
4.3 Trilobal Fibers ... 30
4.4 Abrasion and Pilling Resistance ... 31
4.4.1 Segmented Fiber ... 33
4.4.1.1 8 Segments ... 33
vi
4.4.1.3 32&64 Segments ... 46
4.4.1.4 Pilling Resistance of Nonwoven Fabrics Made From Segmented
Fibers ... 52
4.4.2 Islands-in-the-Sea Fibers ... 58
4.4.2.1 60PET/40N-150gsm ... 58
4.4.3 Trilobal Fibers ... 65
4.4.3.1 50PET/50N66 ... 65
5 Conclusion ... 70
6 Suggesting for Future Work ... 73
vii
LIST OF TABLES
Table 2. 1: Fibers used in Nonwoven industry ... 8
Table 3. 1: Nonwoven Fabrics with Segmented Pie Structure Filament ... 25
Table 3. 2: Nonwoven Fabrics with Islands in the Sea Filament ... 26
Table 3. 3: Nonwoven Fabrics with Tipped Trilobal Filament ... 26
Table 4. 1: Properties of fabrics made from segmented fibers ... 29
Table 4. 2: Properties of fabrics made from Islands in the Sea fibers ... 30
viii
LIST OF FIGURES
Figure 2. 1: World Consumption of Nylon fiber for Nonwovens ... 10
Figure 2. 2: Typical stress strain curve for PET fibers. ... 12
Figure 2. 3: Cross and Longitudinal Section of Island in the Sea ... 13
Figure 2. 4: Segmented pie structure ... 14
Figure 2. 5: Segmented Cross structure ... 14
Figure 2. 6: Trilobal Structure ... 14
Figure 3. 1: Martindale Abrasion Tester... 21
Figure 3. 2: Lissajous pattern ... 21
Figure 3. 3: Random Tumble Pilling Tester ... 22
Figure 3. 4: Rotary Platform, Double Head Method ... 23
Figure 3. 5: Allaso Pilling Analyzer ... 28
Figure 4. 1: Before Abrasion (8 segments) ... 34
Figure 4. 2: Martindale (2000 Cycles) ... 34
Figure 4. 3: Martindale (6000 Cycles) ... 34
Figure 4. 4: Random Test (30 min) ... 34
Figure 4. 5: Tensile Test for 8 Segmented Fibers ... 36
Figure 4. 6: Grab Test for Fabrics Produced from 8 Segmented Fibers ... 36
Figure 4. 7: Load (lb)-Extension (mm) diagrams of 8 Segments Group .... 37
Figure 4. 8: Pill Ranking (Optical & Visual) ... 39
Figure 4. 9: Comparing of Optical (software) & Visual assessment ... 39
Figure 4. 10: Loss weight for Fabrics with 8 Segmented Fibers ... 40
Figure 4. 11: Before Abrasion (16 segments) ... 41
Figure 4. 12: Martindale (2000 Cycles) ... 41
Figure 4. 13: Martindale (6000 Cycles) ... 41
Figure 4. 14: Random Test (30 min) ... 41
Figure 4. 15: Tensile Test for 16 Segmented Fibers... 43
ix
Figure 4. 17: Load (lb)-Extension (mm) diagrams of 16 Segments Group 44
Figure 4. 18: Pill Optical Ranking (with software) ... 45
Figure 4. 19: Pill Visually Ranking ... 45
Figure 4. 20: Loss weight for Fabrics with 16 Segmented Fibers ... 45
Figure 4. 21: Before Abrasion (32&64 segments) ... 47
Figure 4. 22: Martindale (2000 Cycles) ... 47
Figure 4. 23: Martindale (6000 Cycles) ... 47
Figure 4. 24: Random Test (30 min) ... 47
Figure 4. 25: Tensile Test for Fibers with 32&64 segments ... 49
Figure 4. 26: Grab Test for Fabrics with 32&64 segments ... 49
Figure 4. 27: Load (lb)-Extension (mm) diagrams of 32&64 Segments
Group ... 50
Figure 4. 28: Optical Ranking ... 51
Figure 4. 29: Visually Ranking ... 51
Figure 4. 30: Loss weight for Fabrics with 32&64 Segmented Fibers ... 52
Figure 4. 31: Cross Shapes of Segmented Fibers ... 53
Figure 4. 32: SEM Pictures from Side of Fabrics ... 54
Figure 4. 33: Tensile Test for Segmented Fibers ... 54
Figure 4. 34: Grab Test for Fabrics with Segmented Fibers ... 55
Figure 4. 35: Load (lb)-Extension (mm) diagrams ... 56
Figure 4. 36: Pictures of Fabrics’ texture before Abrasion ... 57
Figure 4. 37: Optical and Visual Rating ... 57
Figure 4. 38: Before Abrasion ( Islands in the Sea) ... 59
Figure 4. 39: Martindale (2000 Cycles) ... 59
Figure 4. 40: Martindale (6000 Cycles) ... 59
Figure 4. 41: Random Test (30 min) ... 59
Figure 4. 42: Tensile Test for Segmented Fibers ... 61
Figure 4. 43: Grab test of Fabrics with Island in the Sea Fibers (150 gsm) 61
Figure 4. 44: Load (lb)-Extension (mm) Diagrams of Fabrics with Island in
the Sea Fibers ... 62
Figure 4. 45: Optical Rating ... 64
Figure 4. 46: Visual Rating ... 64
Figure 4. 47: Loss weight for Fabrics with Islands-in-the-Sea Fibers ... 64
Figure 4. 48: Before Abrasion (Trilobal Fibers) ... 66
Figure 4. 49: Martindale (2000 Cycles) ... 66
Figure 4. 50: Martindale (6000 Cycles) ... 66
Figure 4. 51: Random Test (30 min) ... 66
x
Figure 4. 53: Load (lb)-Extension (mm) Diagrams of Fabrics ... 68
Figure 4. 54: Optical Rating ... 70
Figure 4. 55: Visual Rating ... 70
1
1 Introduction
With the rising popularity of nonwovens, greater demands for quality have been required as end-users have become more aware of its negative properties, however still a few studies have been reported on the geometry and dimensional properties of nonwovens fabrics produced from different kinds of bicomponent fibers.
The main objective of this research is to investigate the effects of fibers variables such as on fabric structure, pilling, and abrasion properties of nonwovens fabrics made from bicomponent fibers.
1.1 Specific Objective
The specific objectives of this proposal are:
To summarize literature in the field
To better understand the key factors which affect fabric structure, and pilling resistance of hydroentangled nonwoven fabrics produced from different types of bicomponent fibers.
To compare the results of two different abrasion testers (Martindale and Random Tumble) and determine whether the relative results are dependent on the fabric specifications.
2
At the same time, it is illustrated that the interaction of various factors, including fiber properties (type, diameter, length, curvature and strength) and fabric construction (structure, compactness) determines the rate and extent of pill formation.
3
2 Literature Review
2.1 Definition of Nonwoven
“Today’s nonwovens are highly engineered solutions made up of a variety of materials including fibers, powders, particles, adhesive, films and other materials that provide specific solution providing a multitude of functionalities”. [11]
As a main characteristic, the general definition indicates that nonwoven fabrics are made out of fibers, without any restriction. These can be very short fibers of a few millimeters in length as in the wetlaid process, or very long filaments. Properties and characteristics of a nonwovens fabric depend in large part on the type of fiber used in its construction. These fibers can be natural or synthetic, organic or inorganic. Such fibers can also be produced continuously in connection with the nonwovens process itself and then cut to length, or then extruded directly from polymer granules into a filament and then fibrous structure.
4
Their applications are multifold. Examples of their uses can be listed as follows:
Personal care and hygiene: baby diapers, feminine hygiene products, adult incontinence items, dry and wet pads, but also nursing pads or nasal strips. Healthcare: surgical drapes, gowns and packs, face masks, dressings and swabs, osteomy bag liners, etc.
Clothing: interlining, insulation and protection clothing, industrial workwear, chemical defence suits, shoe components, etc.
Home: wipes and dusters, tea and coffee bags, fabric softeners, food wraps, filters, bed and table linens, etc.
Automotive: boot liners, shelf trim, oil and cabin air filters, moulded bonnet liners, heat shields, airbags, tapes, decorative fabrics, etc.
Construction: roofing and tile underlay, thermal and noise insulation, house wrap, underslating, drainage, etc.
Geotextiles: asphalt overlay, soil stabilization, drainage, sedimentation and erosion control, etc.
Filtration: air and gas, Hevac, Hepa, Ulpa filters
Industrial: cable insulation, abrasives, reinforced plastics, battery separators, satellite dishes, artificial leather, air conditioning, coating.
Agriculture, home furnishing, leisure and travel, school and office, etc.
Not only nonwovens are substitute just for their end cost, they have more and more additional or improved benefits for the users.
2.2 General Remarks
5
Despite the maturity of some of the nonwoven technologies, their growth is expected to continue at a steady rate. Technologies which are expected to gain in importance are spunbonding, meltblowing, and spunlacing. [2]
Spunbonding - is direct fabric manufacturing from polymer in one step (Spin and bond). Polymer is prepared, melted, extruded, draw/quenched into continous oriented filaments, deposited on a moving screen, and then bonded in a variety of ways. This technique is the most cost effective method of making a fabric. [11]
Meltblowing – is a one-step process that converts resin to fine fiber nonwovens webs or structures. This technique produces fine fibers (2-8 micron) for applications where small fibers, large fibers surface area and pore size are required. [11]
Spunlacing (Hydronentagling) – water jet entangled fabrics consisting of mechanically interlocked fibers and fiber bundles where the energy is supplied by high pressure streams of water in the form of columnar jets. [11]
6
Key characteristics of nonwovens fabrics are as follows: [2]
Physical properties: adjustable to a certain extent
Handle: adjustable between extremely soft and extremely hard, but this adjustment causes marked changes in other properties
Drape: falls between conventional textiles and paper
Surface area: always greater than conventional textile fabric
Bulk: adjustable, usually greater than conventional textile fabric
Appearance: with some exceptions, less attractive than that of conventional textile fabric
Price: usually more cost-effective than conventional textile fabric
Woven and knitted fabrics manifest their properties from the arrangement of fibers in the yarn and the arrangement of yarns in the fabrics. Likewise, the properties of nonwovens fabrics are largely dependent on fiber properties, fabric structural geometry, and particularly the type of fiber-to-fiber bonding. Moreover, nonwoven fabric properties can be “tailor-made” through the use of the various web manufacturing and bonding processes, the selective use of fibers/raw materials, and various bonding finishing processes. [2]
7
Essentially, chemical properties are a direct function of the chemical composition of a fiber and determine its resistance to acids, bases, and solvents. Physical properties are scientifically affected by molecular arrangement and determine the reaction of a fiber to mechanical forces, moisture, heat, light, and electrical phenomena. Fiber density, geometry, and dimensions are also considered as physical properties. This research will provide a descriptive overview of fiber properties and their significance in determining the properties of hydroentangled fabrics. [3]
The nonwoven textile industry has made dramatic technical and commercial progress in recent years.
8
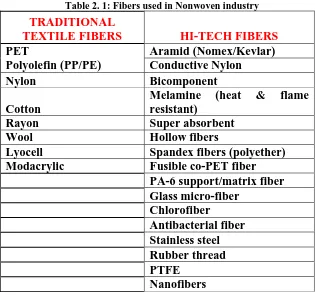
Table 2. 1: Fibers used in Nonwoven industry
TRADITIONAL
TEXTILE FIBERS HI-TECH FIBERS
PET Aramid (Nomex/Kevlar)
Polyolefin (PP/PE) Conductive Nylon
Nylon Bicomponent
Cotton
Melamine (heat & flame resistant)
Rayon Super absorbent
Wool Hollow fibers
Lyocell Spandex fibers (polyether) Modacrylic Fusible co-PET fiber
PA-6 support/matrix fiber
Glass micro-fiber
Chlorofiber
Antibacterial fiber
Stainless steel
Rubber thread
PTFE Nanofibers
9
The specific molecular structure along with the polymer-chain length and chain alignment accounts for essentially all of the physical properties of polymers.
Rigidity, elasticity, flexibility, toughness, crystallinity, and amorphous structure are all dependent upon these parameters and can have a great influence as to what polymer and what type of structure should best be employed for achieving specific performance characteristics.
The longer chains with the least amount of branching will increase polymer strength on stretching. Corresponding to the increased chain alignment, there will be a significant drop in elongation of the stretched polymer system. [2]
2.3 Nylon Fibers
10
Figure 2. 1: World Consumption of Nylon fiber for Nonwovens
2.4 Polyester Fibers
2.4.1 General Polyester Fiber Characteristics:
Strong
Resistant to stretching and shrinking Resistant to most chemicals
Quick drying Crisp and resilient Wrinkle resistant Mildew resistant Abrasion resistant
Retains heat-set pleats and crease Easily washed
0 10 20 30 40 50 60
Consumption In Thousand
tons
1998 1999 2000 2001 2005 2007
11
2.4.2 Relationship between Structure, Properties and Processing
Parameters of PET Fibers
Properties of polyester fibers are strongly affected by fiber structure. The fiber structure, which has a strong influence on the applicability of the fiber, depends heavily on the process parameters of fiber formation such as spinning speed (threadlike stress), hot drawing (stretching), stress relaxation and heat setting (stabilization) speed.
As the stress in the spinning threadlike is increased by higher wind-up speed, the PET molecules are extended, resulting in better as-spun uniformity, lower elongation and higher strength, greater orientation and high crystallinity. Hot drawing accomplishes the same effect and allows even higher degrees of orientation and crystallinity. Relaxation is the releasing of strains and stresses of the extended molecules, which results in reduced shrinkage in drawn fibers. Heat stabilization is the treatment to "set" the molecular structure, enabling the fibers to resist further dimensional changes. Final fiber structure depends considerably on the temperature, rate of stretching; draw ratio (degree of stretch), relaxation ratio and heat setting condition. The crystalline and non-crystalline orientation and the percentage of crystallinity can be adjusted significantly in response to these process parameters. [8]
2.4.3 Mechanical Properties of Polyester Fibers
12
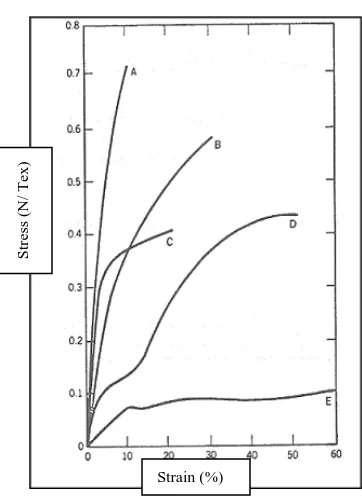
Typical stress strain curve for various polyester fibers are shown in Figure 2.2. It can be seen that the filament represented by curve C has a much higher initial modulus than the regular tenacity staple shown in curve D. High tenacity filament and staple (curve A and B) have very high breaking strengths and module, but relatively low elongations. Partially oriented yarn (POY) and spun filament yarns, exhibit low strength but very high elongation (curve E). [8]
Figure 2. 2: Typical stress strain curve for PET fibers. (A-High tenacity filament, B-High tenacity staple, C-regular tenacity filament, D-regular tenacity staple, E-POY filament)
2.5 Bicomponent Fibers
The main objective in producing bicomponent fibers is to exploit capabilities not existing in either polymer alone. By this technique, it is possible to produce fibers of any cross sectional shape or geometry that can be imagined. Bicomponent fibers are commonly
Strain (%)
13
classified by their fiber cross section structures as side-by-side, sheath-core, islands-in-the-sea and citrus fibers or segmented-pie cross section types.
In the current project the goal was to investigate abrasion and pilling resistance of nonwoven fabrics with three types of bicomponent fibers: Islands-in-the-Sea, Trilobal, and Segmented Pie structures. [10]
Islands-in-the-Sea- these are also called Matrix-Fibril. Technically these are complicated structures to make and use. In cross section, they are areas of one polymer in a matrix of a second polymer. These types of bicomponent structures facilitate the generation of micro denier fibers. The ‘islands’ are usually a melt spinnable polymer such as nylon, polyester or polypropylene. The finest denier that can be obtained normally is below 0.1denier (Figure 2.3). Basically, these fibers are spun from the mixture of two polymers in the required proportion; where one polymer is suspended in droplet form in the second melt. An important feature in production of matrix-fibril fibers is the necessity for forced cooling of the fiber immediately below the spinneret orifices. Different spinnability of the two components would almost disable the spinnability of the mixture, except for low concentration mixtures (less than 20%). [10]
Figure 2. 3: Cross and Longitudinal Section of Island in the Sea Bicomponent Fibers
PET
14
Segmented Pie- this structure as shown in Figure 2.4 is commonly referred to as "segmented pie structure". Alternate pie or wedges are made of nylon and polyester. The fiber contains around 16 segments in this picture. The fibers are made into a web and the fiber web is passed through a high-pressure jet of air or water to split the fibers. This splitting and entanglement makes the resultant fabric more strong. [10]
Figure 2. 4: Segmented pie structure
Sometimes, it becomes very difficult to card this type of fiber because of its different modulus properties. In order to overcome this problem their structure is altered as in Figure 2.5 and Figure 2.6.
Figure 2. 5: Segmented Cross structure Figure 2. 6: Tipped Trilobal Structure
15
The behavior of bicomponents may be expected to depend on the individual properties of the components in the blend, their relative proportions, degree of heterogeneity and the properties of the interface between the components. [10]
2.6 Abrasion of Nonwoven
The measurement of the resistance to abrasion of textile fabrics is very complex. The resistance to abrasion of nonwovens is affected by many factors that include the inherent mechanical properties of the fibers; the dimensions of the fibers; the blends of fibers, the construction of the fabrics; the type, kind, and amount of treatment added to the fibers, or fabric; the nature of the abradant; the variable action of the abradant over the specimen area abraded; the tension on the specimen; the pressure between the specimen and the abradant; and the dimensional changes in the specimen. [1]
Abrasion can result in four effects on appearance:
Crocking: is the transfer of color from one fabric to another during abrasion.
Frosting: is the change of the fabric color by localized abrasion.
Hole
Pilling
16
2.6.1 Pilling
Gintis and Mead pointed out that a loose fiber held at one end would quickly align itself with the abrading force, which thereby would minimize the effect on it. Also, it seems reasonable to assume that a free foreign fiber or a fractured fuzz fiber rolling around in the fuzz array would be likely to snarl up with fixed fuzz fibers and initiate the entanglement process. As soon as two fuzz fibers become entangled, their ability to align themselves with the abrading force is restricted, and considerably greater forces can be exerted on them.
It seems probable that such a discontinuity in bending modulus along the fiber length would encourage a flailing or lashing action during rubbing and that the resulting inter-fiber contact would more easily convert into permanent entanglement due to the hinge action of the fatigue zones.
Once two well-separated fuzz fibers have joined up by entanglement, the interaction between the abradant and these fibers becomes more effective. They can no longer align themselves with the force, and rolling and twist-snarling lead to greater entanglement, or sometimes to disentanglement.
17
The pull-out mechanism provides a source of fiber for pill growth that is independent of the adjacent-fiber structure, and, in addition, it makes the pill more mobile and increases the probability of adjacent-fiber pick-up. Clearly, tight fabrics structure leads to low pull-out and restricted pill growth and, for fibers with high tensile strengths, the pills that form are likely to become immobile and remain on the fabric surface without wearing off.
The reduced bending modulus of the fatigue zones enables the fiber to develop much smaller bending radii within the pill body, and, as the anchor fatigue rolls-up into the pill core, the morphology of the pill changes. [4]
18
Formation of fuzz and pill in nonwoven fabrics are extensively depends on:
Raw Material ( Elongation, Tensile strength, Shape of cross section, Diameter)
Fabrics Parameters Bonding Techniques Bonding Parameters Testing Technique
2.6.2 Pilling is promoted by a number of factors: [2]
1- Pill formation rate—pill formation is a dynamic process in which pills are constantly
formed and wear off. If the formation rate is grater than the break-off rate, then pills build-up
on the surface.
2- The longer the staple length, the lower the pilling tendency, because there are fewer fiber
ends protruding per unit area.
3- Coarser fibers are more rigid and hence they have a lower tendency to pill.
4- A circular cross section with smooth fiber surface allows the fiber to migrate to the surface
of a fabric and form pills. Irregular cross sections reduce pilling.
5- Low tenacity fiber will increase pill wear-off rate.
19
20
3 Discussion of Experimental Methodology
3.1 General Information
A specific objective of this project was to investigate the abrasion and pilling resistance of different nonwoven fabrics in three groups which are classified according to the fibers used in each group.
Since the test results show that each tester has a different sensitivity for different factors, it is recommend that at least 2 different testers be used in order to obtain reliable results, one of these being the Martindale while the other one is Random Tumble Tester.
Ball (1938) indicated eight measurable changes in textile materials as a result of abrasion:
Tensile strength Thickness Weight Surface luster Air permeability Color
Character of abraded material Appearance of surface
21
Short descriptions of these three test methods and how abrasion and pilling resistance of nonwoven fabrics were measured in each method are discussed below:
ASTM – D 4966
(Martindale Abrasion Tester Method):Figure 3. 1: Martindale Abrasion Tester
This test method covers the determination of the abrasion resistance of textile and nonwoven fabrics using the Martindale abrasion tester. Fabrics of all types may be tested by this method (Figure 3.1).
Fabrics are mounted on the Martindale Tester, and the face of the test specimen is rubbed against the face of the standard mounted fabric in the form of a geometric figure. The rubbing action is such that the fabric is rubbed over its whole surface in many different directions. (Lissajous pattern, specimen is abraded uniformly at every point). (Fig 3.2)
22
The resistance to abrasion in this test method also is affected greatly by the conditions of the
tests, such as the nature of abradant; variable action of the abradant over the area of specimen
abraded, the tension on the specimen, the pressure between the specimen and abradant, and
the dimensional changes in the specimen. All samples were conditioned weighed before and
after abrasion, and abrasion was assessed in terms of weight loss. Pilling was assessed both
by using a visual rating and using an imagining system.
ASTM – D 3512
(Random Tumble Pilling Tester):Figure 3. 3: Random Tumble Pilling Tester
This test method covers the resistance to the formation of pills and other related surface changes on textile fabrics using the random tumble pilling tester. The procedure is generally applicable to all types of woven, knitted, and nonwoven fabrics (Figure 3.3).
23
The degree of fabric pilling is evaluated by comparison of the tested specimens with visual standards that may be actual fabrics, or photographs of fabrics, showing a range of pilling resistance. The observed resistance to pilling is reported using an arbitrary rating scale. All samples were weighed before and after abrasion, and pilling resistance was determined using with both optical and visual methods.
ASTM – D 3884 – RPDM
(
Rotary Platform, Double Head Method):Figure 3. 4: Rotary Platform, Double Head Method
This guide covers the determination of the abrasion resistance of textile fabrics using the rotary platform, double-head tester (RPDH). (Figure 3.4)
24
Uncontrolled manufacturing or finishing variations occurring within a fabric or within lots of the same style of fabric can be detected satisfactorily with the RPDH tester.
Counting the pills and weighing their number with respect to their size and contrast, as a combined measure of pilling resistance, is not recommended in this method, because of the excessive time required for counting, sizing, and calculation. All samples were weighted before and after abrasion and abrasion resistance was determined base on the weight loss.
All the test methods and instruments that have been developed for abrasion resistance may show a high degree of variability in results obtained by different operators and in different laboratories; however, they represent the methods most widely used in the industry, because there is a definite need for measuring the relative resistance to abrasion. [1]
25
These general observations apply to all types of fabrics, including woven, nonwoven, and knit apparel fabrics, household fabrics, industrial fabrics, and floor coverings. It is not surprising, therefore, to find that there are many different types of abrasion testing machines, abradants, testing conditions, testing procedures, methods of evaluation of abrasion resistance, and interpretation of results. [1]
3.2 Experimental Design
The experiment consisted of 15 samples in three different categories depending on the fibers shape (Segmented, Island-in-the-Sea, and Trilobal). Table 1, 2, 3 lists the material characteristics recommended for measurement during this study.
Table 3. 1: Nonwoven Fabrics with Segmented Pie Structure Filament (N used for Nylon)
Fiber Cross Shape gsm Bonding
1
PET/N-25/75
Segmented
8 S/P 160 Spunbond/Hydro
2
PET/N-50/50
Segmented
8 S/P 170 Spunbond/Hydro
3
PET/N-75/25
Segmented
8 S/P 170 Spunbond/Hydro
4
PET/N-25/75
Segmented
16 S/P 190 Spunbond/Hydro
5
PET/N-50/50
Segmented
16 S/P 210 Spunbond/Hydro
6
PET/N-75/25
Segmented
16 S/P 190 Spunbond/Hydro
7
PET/N-50/50
Segmented
32 S/P 170 Spunbond/Hydro
8
PET/N-50/50
Segmented
64 S/P 170 Spunbond/Hydro
9
PET/N-75/25
Segmented
26
Table 3. 2: Nonwoven Fabrics with Islands in the Sea Filament
Fiber Cross Shape gsm Bonding
1
PET/Nylon
60/40 Island-Sea/37 150 Spunbond/Hydro
2
PET/Nylon
60/40 Island-Sea/19 150 Spunbond/Hydro
3
PET/Nylon
60/40 Island-Sea/7 150 Spunbond/Hydro
Table 3. 3: Nonwoven Fabrics with Tipped Trilobal Filament
Fiber Cross Shape gsm Bonding
1 PET/Nylon 50/50 Nylon (core) Trilobal 135 Spunbond/Hydro
2 PET/Nylon 50/50 PET (core) Trilobal 135 Spunbond/Hydro
3.3 Measuring Methods
27
The software can setup to output the data in comparison to any pictorial standard. This method uses a laser with an x – y stage to measure the distance from the laser to the fabric surface, thereby creating a height map (image) of the surface. A major advantage of this method is that it does not depend on illumination and measures the true surface character of the fabric. The method is however, slower and more expensive than most optical systems that are currently available. To objectively identify and estimate both fuzzing and pilling, a method has been developed that is capable of assessing changes easily and reliably.
This is accomplished by controlling the angle of incident light such that only objects raised from the surface are illuminated.
The laser method determines the geometric figures of the pill objects, including density (Referring to the total number of pill elements in the same area of the sample) and pill element size (pill area fraction), expressed as a percentage of the total area examined.
28
Figure 3. 5: Allaso Pilling Analyzer [12]
Additionally, pilling test specimens were evaluated by subjective comparison with standard picture of such specimens. This method is based on pill counts. Visual Standard method was used to recognize the difference between Allaso Pilling Analyzer and conventional method. Test specimens were evaluated by assigning to them a numerical rating of 1 to 5 which indicates their overall pilling in comparison with the standard. The average rating of each specimen reported by three evaluators.
5- No Pilling
4- Slight Pilling
3- Moderate Pilling
2- Severe Pilling
1- Very Severe Pilling
29
4 Result and Discussion
Each of 15 fabrics in three groups was tested using the Martindale, and the Random testers and data was collected which could be used to assess abrasion and pilling resistance. The methods that were used for measuring abrasion and pilling resistance of fabrics are measuring weight loss, optical rating with Allaso Pilling Analyzer, and visual rating (comparing with standard pictures). The other physical parameters (peak load (lb), elongation (mm), initial modulus) were evaluated before abrading the samples. Each tester gave different information about abrasion and pilling for the same fabric. The aim of this project was to compare fabrics of each group with each other and hopefully determine the key factors influencing abrasion resistance.
4.1 Segmented Fiber
Nine fabric samples were compared in Martindale and Random testers. In this study all fabrics were made with segmented fibers with different percentage of polyester and nylon. The fabrics had been spunbonded and hydroentangled on both sides with a speed of 10 m/s [12]. The individual test results can be found in the Table 4.1.
Table 4. 1: Properties of fabrics made from segmented fibers
FABRIC PARAMETERS MARTINDALE
2000 CYCLES
MARTINDALE
6000 CYCLES RANDOM TEST
PET/N (%) No. Segment 2 /m g WGT LOSS% PILL RATING PILL OPTICAL RATING WGT LOSS% PILL RATING PILL OPTICAL RATING WGT LOSS% PILL RATING PILL OPTICAL RATING
1 25/75 8 S/P 160 -1.18 2.5 211 0.917 1 221 0.312 4.75 123
2 50/50 8 S/P 170 -0.91 4.5 185 -0.58 3 161 0.28 4.5 164
3 75/25 8 S/P 170 -0.64 4.25 82 -0.45 4 219 0.511 5 135
4 25/75 16 S/P 190 0.20 4.5 200 0.121 3.5 278 0.877 5 125
5 50/50 16 S/P 210 0.08 4 254 0.503 4.5 235 0.024 5 120
6 75/25 16 S/P 190 -0.81 4 154 -0.97 2 197 0.122 5 166
7 50/50 32 S/P 170 -0.79 1 286 -1.27 1 245 0.218 3.5 203
8 50/50 64 S/P 170 -0.70 1 289 -1.2 1 230 0.67 3.5 240
30
4.2 Islands-in-the-Sea Fibers
Three fabric samples were compared in Martindale and Random testers. In this series the fabrics were made from Islands-in-the-Sea fibers with different percentage of polyester/nylon and different number of islands. All islands are polyester and seas are nylon66. They were spunbonded and hydroentangled on both sides with a speed of 10 m/s. The individual test results can be found in the Table 4.2.
Table 4. 2: Properties of fabrics made from Islands in the Sea fibers
FABRIC PARAMETERS MARTINDALE
2000 CYCLES
MARTINDALE
6000 CYCLES RANDOM TEST
PET/N (%) No. Islands in Sea 2 /m g WGT LOSS% PILL RATING PILL OPTICAL RATING WGT LOSS% PILL RATING PILL OPTICAL RATING WGT LOSS% PILL RATING PILL OPTICAL RATING
1 60/40 37 150 -0.75 1 258 33.92 1.5 202 -1.14 4 69
2 60/40 19 150 -1.18 2 228 0.404 1 344 -0.49 3.5 171
3 60/40 7 150 -0.92 3.5 141 -0.38 3.5 14 -0.18 3.5 67
4 60/40 37 200 -0.78 2 278 -0.35 1 195 -0.12 1 250
5 60/40 19 200 -0.97 1 282 -0.79 2 250 0.041 3 245
6 80/20 19 200 -0.16 5 117 0.735 5 244 -0.16 5 137
4.3 Trilobal Fibers
Three fabric samples were compared in Martindale and Random testers. All fabrics were made from Trilobal fibers with different core (Polyester or Nylon). They were spunbonded and hydroentangled on both sides with a speed of 10 m/s. The individual test results can be found in the Table 4.3.
Table 4. 3: Properties of fabrics made from Trilobal fibers
FABRIC PARAMETERS
MARTINDALE 2000 CYCLES
MARTINDALE
6000 CYCLES RANDOM TEST
PET/N (%)
Trriped
Trilobal gsm
WGT LOSS% PILL RATING PILL OPTICAL RATING WGT LOSS% PILL RATING PILL OPTICAL RATING WGT LOSS% PILL RATING PILL OPTICAL RATING
1 50/50 N
Core 135 -1.38 3.5 232 -0.12 3 235 0.445 4.5 192
2 50/50 P
31
4.4 Abrasion and Pilling Resistance
Abrasion and pilling resistance were assessed using Martindale and Random testers. In Martindale test all samples were evaluated at 2000 and 6000 cycles; in the Random tester all samples were evaluated after 30 minutes running. Comparison of weight loss and pill formation versus cycles has been investigated.
There exist two essentially different classes of factors which govern the abrasion resistance of nonwoven structures: the inherent abrasion resistance of the material substantively, and the geometry of the composite structure, which may be characterized as the “form factor”.
32
If the hydroentangling process promotes splitting and bonding then the less fiber splitting, the more fuzzy fabric would be. In addition these factors also affect the bending rigidity of fibers.
If fibers are not split well, they will have higher bending rigidity because their count would be bigger than split fibers. So they will not be entangled as much as split fibers.
33
4.4.1 Segmented Fiber
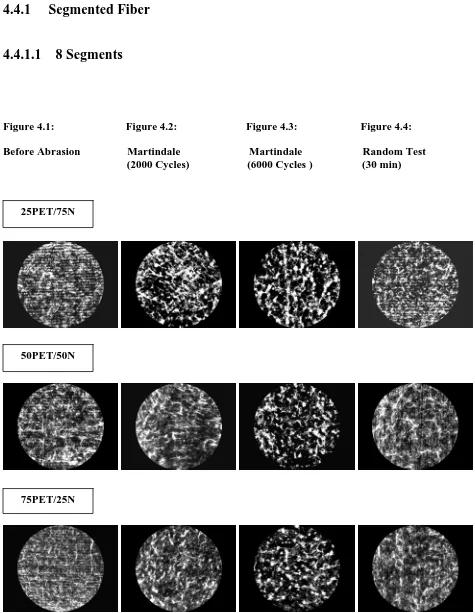
4.4.1.1 8 Segments
Figure 4.1: Figure 4.2: Figure 4.3: Figure 4.4:
Before Abrasion Martindale Martindale Random Test (2000 Cycles) (6000 Cycles ) (30 min)
25PET/75N
50PET/50N
34
Figures 4.1-4.4 show samples of 8 segments prior to and after specific abrasion. Figure 4.1 shows the samples before abrasion. Figure 4.2 and 4.3 show the samples after 2000 and 6000 cycles respectively on the Martindale abrasion tester. Figure 4.4 shows abraded fabrics after 30 minutes on the Random tester.
Properties of Initial Sample Material
From Figure 4.1 (before abrasion), it is apparent that the 25PET/75N blend has the clearest defined texture. Hydroentangled lines are also most obvious in this fabric, followed by 75PET/25N and 50PET/50N blends, in that order. The Fabric produced from 50PET/50N blend has the fuzziest appearance.
Tensile test of 8 segmented fibers (Fig. 4.5a) shows that 25PET/75N fiber is the strongest, followed by 50PET/50N and 75PET/25N fibers. Also 25PET/75N fiber clearly has the highest elongation.[11]
When the properties of fabrics containing these fibers are evaluated a different picture emerges. As Figure 4.6 shows, fabric with 50PET/50N blend is the strongest fabric structure in the machine direction, followed by fabrics with 75PET/25N and 25PET/75N blends, in that order. Additionally the 50PET/50N blend fabric also has the highest elongation in machine direction.
35
These results indicate that in the same bonding process, the number of segments and percentage of each component has the most effect on fiber splitting and fabric structure.
It is clear in 25PET/75N that the number of nylon fibrils is the same as polyester fibrils but the linear density of nylon fibrils is almost 3 times that of the polyester fibrils. The number and the linear density of nylon fibrils are the same as polyester fibrils in 50PET/50N, and the linear density of the polyester fibrils are 3 times that of the nylon fibrils in 75PET/25N blend.
0.0 50.0 100.0 150.0 200.0 250.0 300.0 S tr a in ( % )
2 5 / 7 5 8 S e g.
5 0 / 5 0 8 S e g.
7 5 / 2 5 8 S e g.
Tensile Test
(a) Peak Load (b) Strain
Figure 4.5: Tensile Test for 8 Segmented Fibers
0 10 20 30 40 50 60 70 80 P e a k Loa d ( lb)
2 5 / 7 5 8 S e g.
5 0 / 5 0 8 S e g.
7 5 / 2 5 8 S e g. Grab Test MD CD 0 10 20 30 40 50 60 70 E long a ti o n (mm)
2 5/ 75 8 Seg .
50 / 50 8 Seg .
75/ 2 5 8 Seg .
Grab Test
MD CD
(a) Peak Load (b) Elongation
Figure 4.6: Grab Test for Fabrics Produced from 8 Segmented Fibers
0.0 10.0 20.0 30.0 40.0 50.0 60.0 70.0 80.0 90.0 P e ak L o ad (g f)
2 5 / 7 5 8 S e g.
5 0 / 5 0 8 S e g.
36
Figure 4.7 depicts the Load-Elongation curves for all three blends in 8-Segmented group. As shown in (a) the initial modulus of 25PET/75N combination is the highest, followed by 50PET/50N and 75PET/25N combinations, respectively. It is obvious from Figures 4.5 and 4.7, that fabrics made from stronger fibers have the highest initial modulus.
(a): 25PET/75N (b): 50PET/50N (c): 75PET/25N
Figure 4.7: Load (lb)-Extension (mm) diagrams of 8 Segments Group
Results after Abrasion
In Figure 4.2 (abrasion after 2000 cycles) the differences between the samples appear to be obvious. The 25PET/75N blend has higher tendency to pill compared to the other two blends. It seems reasonable to assume that pills formed more on the 25PET/75N fabrics because of less fiber splitting leading to the most open fabric structure. Additionally this fabric was also made from the fibers which exhibited the highest initial tenacity.
37
Figure 4.10 confirms this because this fabric gained more weight and that means the rate of pill formation in this fabric is greater than the rate of pill wear-off.
Figure 4.9 shows the comparison of the data observed from the optical assessment (using software) and visual assessment. It is clear that while there is a lot of deviation in the trend, in general a higher optical rating (bad pilling) is achieved for fabrics with a low visual rating (bad pilling). As indicated earlier the difference in these results could be due to the fact that the software always tends to be greatly influenced by surface fuzz-which is not true of the visual assessment.
Figure 4.10 shows that the 75PET/25N blend gained less weight than the others after 2000 cycles. It was observed during the abrasion test that the sample was actually shedding fibers and pills. This could be seen because they were blue fibers on opposed to the white abradant fabrics. It seemed probable that wool abradant debris was influencing the pill formation. And it is also clear however that several of the fabrics actually gained weight during abrasion. The only possible explanation for this phenomenon is that in addition to the fiber loss due to abrasion there was also a fiber gain due to transfer of fiber from the abradant on to the test sample. The transferred fibers become entangled with the fibers on the sample of the test specimen.
From Figure 4.3 (abrasion after 6000 cycles) it is evident that the 25PET/75N blend has the highest number of pills, and the sizes of the pills are bigger than after 2000 cycles, followed by 50PET/50N and the 75PET/25N blends.
* As can be seen from many of the results from the Martindale, the weight of the sample being tested, actually increased after abrasion. Thus in Figure 4.10 the positive values represent weight loss and the negative values indicate weight gain.
38
According to Cooke (1985), if the interfiber forces are reduced just enough to allow some pull-out but not enough to increase the total fuzz formation, then the total numbers of pills will be unchanged but the average pill mass will increase. In this case the pill will be larger. From Figure 4.10, it is obvious that 25PET/75N blend lost most weight (0.0016 g). 0 50 100 150 200 250
8Seg- 25/ 75 8Seg- 50/ 50 8Seg- 75/ 25
Op t i c a l R a t i n g
Bef or e Abr asi on 2000 Cycl es 6000 Cycl es Random Test 0 1 2 3 4 5 St a n d a rd S c al e
8Seg-25/75 8Seg-50/50 8Seg-75/25
Visual Ranking
2000 Cycles 6000 Cycles Random Test
(a) Pill Optical Ranking (b) Pill Visually Ranking
Figure 4.8: Pill Ranking (Optical & Visual)
0 50 100 150 200 250
0 1 2 3 4 5 6
Visual Raitng O p ti c a
l Ra
ti n g 2000 Cycles 6000 Cycles Random Test
39 -0.0025
-0.002 -0.0015 -0.001 -0.0005 0 0.0005 0.001 0.0015 0.002
(g
r)
8Seg-25/75 8Seg-50/50 8Seg-75/25
Weight Lo ss
2000 Cycles 6000 Cycles Random Test
Figure 4.10: Weight loss for Fabrics with 8 Segmented Fibers
Figure 4.4 (after 30 min. in Random Tester) shows all samples are fuzzier after abrasion, and there is no obvious pill on the surface of fabrics. From Figure 4.10 it can be seen that after the Random Test, 25PET/75N lost more weight than the other two fabrics.
These results clearly indicate that different testers may give different pilling results for the same fabric.
40
4.4.1.2 16 Segments
Figure 4.11: Figure 4.12: Figure 4.13: Figure 4.14:
Before Abrasion Martindale: Martindale: Random Test: 2000 Cycles 6000 Cycles 30 min.
25PET/75N
50PET/50N
41
Figures 4.11-4.14 show samples of 16 segments prior to and after specific abrasion. Figure 4.11 shows the samples before abrasion. Figures 4.12 and 4.13 show the samples after 2000 and 6000 cycles respectively on the Martindale abrasion tester. Figure 4.14 shows abraded fabric after 30 minutes on the Random tester.
Properties of Initial Sample Material
From Figure 4.11 (before abrasion), it is apparent that the textures of all three fabrics are different. Hydroentangled lines are most obvious in the 50PET/50N fabric, followed by 25PET/75N. Fabric produced from the 75PET/25N blend has the fuzziest appearance.
From Figure 4.15 (Tensile test of fibers), it is evident that 75PET/25N fiber is the strongest, followed by 25PET/75N and the 50PET/50N fibers [11]. Tensile test results of 16 segments fibers are in contrary to the 8 segments results where the 25PET/75N blend fiber was the strongest. So the number of segments plays a very important role in tensile test of segmented fibers. It is clear that in the 75PET/25N blend fibers the number of nylon fibrils is the same as polyester fibrils but the linear density of polyester fibrils is three times that nylon fibrils are. The number and the linear density of nylon fibrils is the same as polyester fibrils in 50PET/50N, and the linear density of the nylon fibrils is three times that of nylon fibrils in are 25PET/75N blend.
42 0.0 20.0 40.0 60.0 80.0 100.0 120.0 140.0 160.0 P eak L o ad ( g f)
2 5 / 7 5 16 S e g.
5 0 / 5 0 16 S e g.
7 5 / 2 5 16 S e g. Tensile Test 0.0 50.0 100.0 150.0 200.0 250.0 St ra in ( % ) 25/ 75 16Seg. 50/ 50 16Seg. 75/ 25 16Seg. Tensile Test
(a) Peak Load Chart for Fibers (b) Strain Chart for Fibers
Figure 4.15: Tensile Test for 16 Segmented Fibers
0 10 20 30 40 50 60 70 80 90 P e a k Loa d (l b)
2 5/ 75 16 Seg .
50 / 50 16 Seg .
75/ 2 5 16 Seg .
Grab Test MD CD 0 10 20 30 40 50 60 70 80 E longa ti on (m m )
2 5 / 7 5 16 S e g.
5 0 / 5 0 16 S e g.
7 5 / 2 5 16 S e g. Grab Test
MD CD
(a) Peak Load for Fabrics (b) Elongation for Fabrics
Figure 4.16: Grab Test for Fabrics with 16 Segmented Fibers
43
(a): 25PET/75N (b): 50PET/50N (c): 75PET/25N
Figure 4.17: Load (lb)-Extension (mm) diagrams of 16 Segments Group
Abraded Results:
From Figure 4.12 (abrasion after 2000 cycles) there is no difference between 25PET/75N and 50PET/50N blend fabrics, because there are no obvious pills on either of them. Abrasion after 2000 cycles just made a lot of fuzz in the 25PET/75N and 50PET/50N fabrics. There are small pills on the 75PET/25N blend that are tied together like chains. As mentioned in chapter 3, the optical rating is more sensitive to fuzz than pills. In Figure 4.18 (Optical Ranking) after 2000 cycles, the 50PET/50N blend is the highest. But Figure 4.19 (Visual Rating) shows the 75PET/25N blend has the most pills. Figure 4.20 shows that unlike the other two fabrics the 75PET/25N fabric gained weight rather than losing it. Because of the loose fabric structure of 75PET/25N fabric, anchor pull-out occurred more than pill wear-off.
44
Figure 4.18: Pill Optical Ranking (with software) Figure 4.19: Pill Visually Ranking
-0.003 -0.002 -0.001 0 0.001 0.002 0.003 (g r)
16Seg-25/75 16Seg-50/50 16Seg-75/25
We ight Lo ss
2000 Cycles 6000 Cycles Random Test
Figure 4.20: Weight loss for Fabrics with 16 Segmented Fibers
Figure 4.14 (after 30 min. in Random Tester) shows all samples are just fuzzier after abrasion, and there are no obvious pill on the surface of the fabrics. In 25PET/75N and 50PET/50N blends even hydroentangled lines are obvious after Random test. Figure 4.18 shows that the 75PET/25N blend is the fuzziest one. Figure 4.19 depicts that all samples have rank 5 which means no pill was formed. Figure 4.20 shows that after the Random Test, 50PET/50N fabric lost most weight in this group.
These results again indicate that different testers may give different pilling results for the same fabric. 0 0.5 1 1.5 2 2.5 3 3.5 4 4.5 5 S ta nda rd Sc a le
2 5 / 7 5 16 S e g .
5 0 / 5 0 16 S e g .
7 5 / 2 5 16 S e g .
Visual Ranking 2000 Cycles 6000 Cycles Random Test 0 50 100 150 200 250 300
2 5/ 75 16 Seg .
50 / 50 16 Seg .
75/ 2 5 16 Seg .
Optical Rating
45
In the 16-segmented group, the75PET/25N blend fabric has the loosest fabric structure and most pill formation. The 50PET/50N fabric has the strongest structure as in the 8-Segmented group and 25PET/75N has the best abrasion resistance.
46
4.4.1.3 32&64 Segments
Figure 4.21: Figure 4.22: Figure 4.23: Figure 4.24:
Before Abrasion Martindale: Martindale: Random Test: 2000 Cycles 6000 Cycles 30 min.
50PET/50N-32Seg
50PET/50N-64Seg
47
Figures 4.21-4.24 show samples of 32&64 segments, prior to and after specific abrasion. Figure 4.21 shows the samples before abrasion. Figure 4.22 and 4.23 show the samples after 2000 and 6000 cycles on the Martindale abrasion tester. Figure 4.24 shows abraded fabric after thirty (30) minutes on Random tester.
Properties of Initial Sample Material
From Figure 4.21 (before abrasion) the textures of all three fabrics are obvious. Hydroentangled lines are not as clear as for the 8 and 16 segments group. When compared to 8 and 16 segmented groups, this group has the fuzziest appearance. Fabric made from 50PET/50N-64 segment blend has the fuzziest appearance. The differences among these groups will be discussed in detail in the next section.
48 0.0 20.0 40.0 60.0 80.0 100.0 P e ak L o ad (g f) 50/ 50 32Seg. 50/ 50 64Seg. 75/ 25 64Seg. Tensile Test 0.0 50.0 100.0 150.0 200.0 250.0 300.0 St ra in ( % )
5 0 / 5 0 3 2 S e g.
5 0 / 5 0 6 4 S e g.
7 5 / 2 5 6 4 S e g. Tensile Test
(a) Peak Load Chart for fibers (b) Strain Chart for Fibers
Figure 4.25: Tensile Test for Fibers with 32&64 segments
0 10 20 30 40 50 60 Pe a k L o a d ( lb )
50 / 50 3 2 Seg .
50 / 50 6 4 Seg .
75/ 2 5 6 4 Seg .
Grab Test MD CD 0 10 20 30 40 50 60 70 E lon ga ti on (mm)
50 / 50 3 2 Seg .
50 / 50 6 4 Seg .
75/ 2 5 6 4 Seg .
Grab Test
MD CD
(a) Tensile Test for Fabrics (b) Elongation for Fabrics
Figure 4.26: Grab Test for Fabrics with 32&64 segments
Figure 4.27 depicts the Load-Elongation curves for all three combinations in 32&64-Segmented group. As shown in Figure 30(a) the initial modulus of 50PET/50N-32Seg blends is the highest, followed by 50PET/50N-64Seg and the 75PET/25N-64Seg blends, in that order. Unlike the 8 and 16 segmented group where the stronger the fiber, the higher the initial modulus of the fabric, in this group fabric made from the weakest fibers has the highest initial modulus.
49
(a): 25PET/75N-32 Seg. (b): 50PET/50N-64 Seg. (c): 75PET/25N-64 Seg.
Figure 4.27: Load (lb)-Extension (mm) diagrams of 32&64 Segments Group
Abraded Results
Figure 4.22 (abrasion after 2000 cycles) shows the differences among abraded fabrics in this group. Almost all three fabrics were covered with pills and there seems to be no free standing fuzz. It looks as though all of the fabrics in this group have the propensity to pill. The differences are in the shape and size of the pills. This result confirms the assumption that fabrics in this group have the loosest structure when compared with the 8 and 16 segmented groups. In 50PET/50N-32 segmented there are a lot of tough pills that covered all of the abraded part. The difference between 50PET/50N-64Seg and 75PET/25N-64 segmented is that the pills in 50PET/50N-64Seg are bigger than those in 75PET/25N-64 segmented fabric. As the linear density of the nylon fibrils in 75PET/25N-64Seg fibers is smaller than nylon fibrils in 50PET/50N-64Seg fibers, this seems to indicate that nylon fibrils give more pills.
50
From Figure 4.27 there is less fuzz than after 2000 cycles. This shows that with loose structures, anchor pull-out occurred more. As in the 8 and 16 segment groups the reduced interfiber forces are just enough to allow some pull-out but not enough to increase the total fuzz formation. thous the total numbers of pills will be unchanged but the average pill mass will increase. In this case the pill will be larger.
From Figure 4.28 (Optical rating, after 2000 cycles), the 50PET/50N-32Seg and 50PET/50N-64Seg blends have the highest rating, followed by the 75PET/25N-64 segmented. But, after 6000 cycles Figure 4.28 shows a lower optical rating than with 2000 cycles. Figure 4.29 shows 50PET/50N-32Seg and 50PET/50N-64Seg blends have the most pills, followed by 75PET/25N-64Seg. Figure 4.30 shows that the 250PET/50N-32Seg and 50PET/50N-64Seg fabrics lost the same weight in the Martindale test, so the only factor that changes the size and shape of pills is the denier of nylon fibrils.
0 50 100 150 200 250 300
32Seg-50/ 50 64Seg-50/ 50 64Seg-75/ 25
Opt i cal Rat i ng
Bef or e Abr asi on 2000 Cycl es 6000 Cycl es Random Test 0 0.5 1 1.5 2 2.5 3 3.5 4 4.5 S tan d a rd S cal e
32Seg-50/50 64Seg-50/50 64Seg-75/25
Visual Ranking
2000 Cycles 6000 Cycles Rando m Test
51 -0.015
-0.01 -0.005 0 0.005 0.01 0.015
(g
r)
32Seg-50/50 64Seg-50/50 64Seg-75/25
Weight Lo ss
2000 Cycles 6000 Cycles Random Test
Figure 30: Weight loss for Fabrics with 32&64 Segmented Fibers
Figure 4.24 (after 30 min. in Random Tester) shows all samples are fuzzier and have pills after abrasion in the Random tester. From optical ratings (Figure 4.28), 50PET/50N-64 segmentedeg blend has the highest rating, followed by 50PET/50N-32 segmented and finally by the 75PET/25N-64 segmented blends, in that order. But from Figure 4.29 (visual rating), 50PET/50N-32 segmented and 50PET/50N-64 segmented have the same scale (3.5), and 75PET/25N-64 segmented has almost the same value as original one (4.5). Figure 4.30 shows after the Random Test, 50PET/50N-64 segmented fabric lost the most weight in this group.
These results reiterate the earlier conclusion that different testers may give different pilling results for the same fabric.
52
4.4.1.4
Pilling Resistance of Nonwoven Fabrics Made From Segmented
Fibers
Properties of Initial Sample Material
This section focuses on more details of the properties of a series of nonwovens fabrics made from segmented fibers. Four fabrics with the same percentage of polyester/nylon66 (50PET/50N66) but different number of segments (8, 16, 32, and 64) were compared. In addition to the physical tests, samples were also examined under a scanning electron microscope (SEM) to see the cross section of fibers and how they were split after the hydroentangling bonding process.
(a) 50PET/50N-8Seg. (b) 50PET/50N-16Seg. (c) 50PET/50N-32Seg. (d) 50PET/50N-64Seg.
Figure 4.31: Cross Shapes of Segmented Fibers [11]
Figure 4.31 shows the cross section of different segmented fibers. It can be seen, in the 50PET/50N blend, that as the number of segments increase, the cross section of fiber is more elliptical.
53
(a)50PET/50N-8Seg. (b) 50PET/50N-16Seg.
(c) 50PET/50N-32Seg. (d) 50PET/50N-64Seg.
Figure 4.32: SEM Pictures from Side of Fabrics [11]
Figure 4.33 shows results of tensile test of segmented fibers. Figure 34 (a) and (b) show peak load and strain of fibers. [11]
0.0 10.0 20.0 30.0 40.0 50.0 60.0 70.0 P eak L o ad ( g f)
50 / 50 8 Seg
50 / 50 16 Seg .
50 / 50 3 2 Seg .
50 / 50 6 4 Seg .
Tensile Test 0.0 20.0 40.0 60.0 80.0 100.0 120.0 140.0 160.0 180.0 S tr a in ( % )
5 0 / 5 0 8 S e g
5 0 / 5 0 16 S e g.
5 0 / 5 0 3 2 S e g.
5 0 / 5 0 6 4 S e g. Tensile Test
(a) Peak Load Chart (b) Strain Chart
54
Figure 4.34 depicts results of grab test of different fabrics. Figure 4.34(a) shows peak load and 4.34(b) shows elongation for different nonwoven fabrics with different segments fibers.
(a) Peak Load Chart (b) Strain Chart
Figure 4.34: Grab Test for Fabrics with Segmented Fibers
From figure 4.33(a) and (b) it is obvious that 50PET/50N-16 segmented fibers have the least peak load and elongation compared to other fibers in this group. But as it is shown in Figure 4.34(a) and (b) fabric with 50PET/50N-16 segmented fibers has the strongest structure. The main factor for making strong structure directly depends on the fiber splitting. Figure 4.32 confirms this since it is clearly seen that most 50PET/50N-16 segments fibers were split after the hydroentanling bonding process.
Splitting better means fibrils contribute in the hydroentangling bonding process better and thus make stronger fabric structures. Because fibrils have lower modulus (bending rigidity) than non-split fibers, they will deform easier under the water pressure and will assist in inter-fiber entanglement and hence make tighter structures.
0 10 20 30 40 50 60 70 80 90 P e a k Loa d (l b)
5 0 / 5 0 8 S e g.
5 0 / 5 0 16 S e g.
5 0 / 5 0 3 2 S e g.
55
Figure 4.35 (Load-Elongation curves) shows Load-Extension diagrams for each fabric with the same percentage of polyester/nylon but different number of segments. As it is obvious from these figures, the strongest structure (50PET/50N) has the highest initial modulus. However, the looser the structure of the fabric, the lower the initial modulus of the fabric. These results are contrary to the result of load-elongation results of each group that show the stronger the fiber, the higher will be the initial modulus of the fabric.
(a) 50PET/505N-8 Seg. (b) 50PET/505N-16 Seg. (c) 50PET/505N-32 Seg. (d) 50PET/505N-64 Seg.
Figure 4.35: Load (lb)-Extension (mm) diagrams
We can assume that in each group that strength of fabrics is close to each other, the initial modulus of fabrics depends to the strength of fibers. But when the differences are significant, the initial modulus of fabric depends on the structure of the fabric.
56
(a) 50PET/50N-8Segments (b) 50PET/50N-16Segments (c) 50PET/50N-32Segments
(d) 50PET/50N-64Segments
Figure 4.36: Pictures of Fabrics’ texture before Abrasion
0 50 100 150 200 250 300 8Seg-50PET/ 50N 16Seg-50PET/ 50N 32Seg-50PET/ 50N 64Seg-50PET/ 50N Opt i c a l R a t i ng
Before Abrasion 2000 Cycles 6000 Cycles 0 1 2 3 4 5 S tan d a rd Scal e 8Seg-50PET/ 50N 16Seg-50PET/ 50N 32Seg-50PET/ 50N 64Seg-50PET/ 50N Vi sua l R a t i ng
2000 Cycles
6000 Cycles
Random Test
(a) Optical Rating (b) Visual Rating
Figure 4.37: Optical and Visual Rating
57
58
4.4.2 Islands-in-the-Sea Fibers
4.4.2.1 60PET/40N-150gsm
Figure 4.38: Figure 4.39: Figure 4.40: Figure4. 41:
Before Abrasion Martindale: Martindale: RandomTest 2000 Cycles 6000 Cycles 30 min.
60PET/40N - 37 islands
60PET/40N - 19 islands
59
Figures 4.38-4.41 show samples of fabrics with Islands-in-the-sea fibers prior to and after specific abrasion. Figure 38 shows the samples before abrasion. Figure 4.39 and 4.40 show the samples after 2000 and 6000 cycles on the Martindale abrasion tester. Figure 4.41 shows abraded fabric after 30 minutes on Random tester.
Properties of Initial Sample Material
Figure 4.38 (before abrasion) shows the texture of all three fabrics. As it can be seen hydroentangled lines are not obvious in any of blends, but 7 islands fabric has the most uniform appearance. Also 19 islands fabric has the fuzziest appearance. As it is evident the percentage of polyester (60%) and nylon (40%) are the same in all blends. The only difference among the blends is the number of islands (polyester) in the sea (nylon66). So the number of islands plays a very important role in the structure of fabric when other factors are the same. The greater the number of islands is, the smaller the linear density of polyester fibrils.
Figure 4.42 shows the tenacity (g/den) and strain (%) of 7 islands and 37 islands fibers. As can be seen, the tenacity of 7 islands fiber is greater, but their elongation of that is less than that of 37 islands fibers. In contrary to the segmented fibers, where the higher the number of segments the stronger the fiber, for islands in the sea fiber is stronger when the number of islands is less.
60
(a) Peak Load Chart (b) Strain Chart
Figure 4.42: Tensile Test for Segmented Fibers
Figure 4.43 shows peak load and elongation of all three, 37 islands, 19 islands, and 7 islands fabrics in machine and cross directions. It is evident that the peak load and elongation of 7 islands fabric in machine direction is the greatest. 19 and 37 islands fabrics have almost the same peak load and elongation. Unlike the segmented fibers where the weakest fibers made the strongest fabric structures, the strongest Islands-in-the-Sea fibers make the strongest fabric structures.
0 10 20 30 40 50 60 70 80 P e ak L o ad ( lb )
6 0 / 4 0 3 7 Is .
6 0 / 4 0 19 Is .
6 0 / 4 0 7 Is . Grab Test MD CD 0 10 20 30 40 50 60 E longa ti on ( m m )
6 0 / 4 0 3 7 Is .
6 0 / 4 0 19 Is .
6 0 / 4 0 7 Is . Grab Test
MD CD
(a) Peak Load of Fabrics (b) Elongation of Fabrics
Figure 4.43: Grab test of Fabrics with Island in the Sea Fibers (150 gsm)
2. 2 2. 4 2. 6 2. 8 3 3. 2 Te na c it y (g /d e n )
6 0 / 4 0 3 7Is.
6 0 / 4 0 7Is. Tensile Test 0 20 40 60 80 100 St ra in (% )
6 0 / 4 0 3 7Is.
61
The results of the grab test suggest that 7 islands blend fibers were split better than 19 islands and 37 islands blends. As mentioned for segmented fibers, the better the Islands-in-the-Sea fibers split, the better they entangle in the hydroentangling bonding process. The abraded tests results confirm this assumption.
Figure 4.44 depicts the Load-Elongation curves for all three blends in this group. As it is shown in 4.44(c) the initial modulus of 7 islands fabric is the greatest, followed by 19 islands and the 37 islands fabrics, in that order. These results indicate that initial modulus of these fabrics depends on the strength of the fibers. The stronger the fiber is, the higher the initial modulus.
(a) 60PET/40N-37 islands (b) 60PET/40N-19 islands (c) 60PET/40N-7 islands
62
Abraded Results
Figure 4.39 (abrasion after 2000 cycles) shows the differences in the size and density of pills that were formed on the surface of fabrics. The 37 islands blend has a higher tendency to pill compared to other blends, followed by 19 islands. Although, not easily seen, the sizes of the pills on the 7 islands fabric are very small. This is because the 7 islands fibers were better split than the