LASER BEAM MODULATION BY AN ACOUSTO OPTIC MODE LOCKER
Nazariah Mat Daud, Mohamad Khairi Saidin, Noriah Bidin, Yaacob Mat Daud
Laser Technology Laboratory, Physics Department
Faculty of Science, University Teknologi Malaysia, 81310 UTM Skudai, Johor, Malaysia
ABSTRACT
The characterization of beam modulation by acousto-optic mode locker is reported. HeNe laser was employed as a source. Acousto-optic mode locker (AOML) was used to convert the continuous beam to become pulsed. Radio frequency signal provided an acoustic source to the AOML. The signal was amplified using a power amplifier. A pulse generator was utilized to regulate the frequency of the signal. The frequency and the power of the amplifier were varied to characterize the modulated beam. The HeNe laser beam was modulated into a periodic signal. The pulse width of the modulated signal was found to increase linearly with the RF pulse width. The modulated signal intensity was also found to vary linearly with RF drive power.
Keywords: Mode Locked, Acousto Optic Modulator, Radio Frequency, Bragg Angle,
Longitudinal Mode,
INTRODUCTION
In many lasers, a number of longitudinal modes will be present simultaneously. Ordinarily, the phases of these modes will be independent of each other. But under some conditions, the modes can interact with each other and their phases can become locked together. Mode locking is the process of forcing longitudinal modes to maintain fixed phase relationship with each other [1].The technique of mode locking allows the generation of laser pulses of ultra short duration and very high peak power. Modelocking can be made to produce pulses of light of extremely short duration,
on the order of picoseconds (10-12s). There are numerous reasons why researchers have become
interested in the generation of picosecond light pulses with gigawatts of peak power. The availability of optical pulses of such high power and short time duration has aroused considerable interest among military, academic, and industrial researchers. The application of high-energy picoseconds pulses to controlled thermonuclear plasma, optical radar, optical information processing, spectroscopy, nonlinear optical properties of materials, transient response of quantum systems, and ultra short acoustic shock research appears very promising [2].
Mode locking was first observed experimentally in 1964 by Hangrove [1] in He Ne laser mode locked with an acousto optic modulator. The FM mode locking of He Ne laser was demonstrated in 1964 by Harris and Targ [1], using a He Ne laser with an internal phase modulator. The first mode locking of a dye laser was reported by W.Schmidt and Schafer in 1968, who observed mode locking of a flash-lamp pumped Rhodamine 6 G dye laser [3].
primarily a subject of academic interest until the invention of laser in 1960 [5]. The need then arose for modulation and deflection of laser beams. Gordon wrote a general review on deflection and modulation devices [6]. Maydan [7] and Chang [8] have developed acousto optic devices for the purpose of optical beam control, such as light modulators and deflectors and it is widely used in various laser applications
The mode-locking behavior is encouraged by inserting a acousto optic modulator in the laser cavity near the output mirror and opening the modulator at a frequency, f = c/2L. Here c is the velocity of light and L is the length of the laser cavity. Acousto optic modulator operation is based on acousto optic effect. The acousto optic effect can be used to control the frequency, intensity, and direction of an optical beam. The AO effect occurs when a light beam passes through a transparent material, such as glass, where traveling acoustic waves are also presents [9]. Acoustic waves are generated in the glass by a piezoelectric transducer that is driven by a RF signal source. This acts like a phase grating, traveling through the crystal at the acoustic velocity of the material and with an acoustic wavelength dependent on the frequency of the RF signal. Any incident laser beam will be diffracted by this grating, generally giving a number of diffracted beams [10]. The acoustic standing waves that are produced by the piezo-transducer in the AO medium are made to
correspond to the frequency, ∆f = c/2L.Due to the acousto optic effect, the modulator will act as a
shutter that opens and closes during each round trip transit time of the incident laser beam [11]. Thus the laser is forced to emit ultra short pulses. The result is a series of short pulses separated in time by 2L/c, the round-trip transit time of the cavity [12]. The duration of these pulses is very short, often of the order of a few picoseconds. Hence, a laser operating in this fashion is often called a picosecond pulse laser.
METHODOLOGY
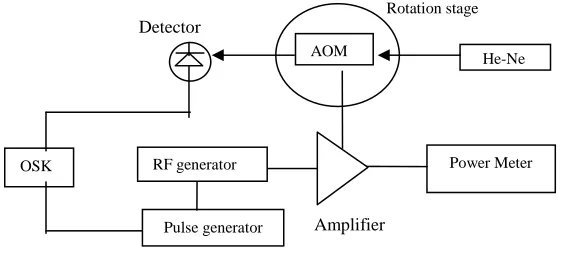
Acousto optic mode locker (AOML) was employed as a beam modulator in this research. In order to characterize the modulated beam of AOML, He-Ne laser with the wavelength of 632.8 nm was used as a source. Prior to experimental works angular adjustment is desired so that the light beam intersects the acoustic wavefronts at the Bragg angle. The AOML was mounted on a rotation stage, to determine the Bragg angle. A pulse generator was used to generate a desired pulse at different pulse-width. The pulse generator was connected to external FM modulation of TGR1040 RF signal generator. The power of RF signal was amplified using HD14975 RF power amplifier. The experiment was carried out to modulate He Ne signal by AOML. This experiment also performed to modulate He Ne signal by keeping the RF pulse to be constant but varying the RF drive power from 1.01 watt to 5.00 watt. When the RF drives power was made constant the RF
pulses was varied from 10.11 s to 108.40 s. The signal was detected by using a photodetector
with a rise time of 1 nsec and the result was displayed on a Tektronix 054B Digital Phosphor Oscilloscope. The whole experimental setup is shown in Figure 1.
Figure 1: The experimental setup to characterize output of AOML Detector
Amplifier
Pulse generator OSK
AOM
RF generator Power Meter
RESULT AND DISCUSSION
Typical results obtained from the experiment are shown in Figure 2. Figures 2(a) and 2(b) show the oscilloscope traces of HeNe CW signal before and after modulation by AOML respectively. After being modulated, the HeNe CW signal becomes periodic signal having pulse width in microsecond. The frequency of the acoustic standing waves produced by the piezoelectric transducer in the AO material which corresponds to the frequency of round trip transit time. Because of the diffraction phenomenon that has been described before, the AOML will act like a shutter that opens and closes during each round trip transit time of the incident laser beam. Thus the laser is forced to emit short pulses. This result is in good agreement with the result obtained by other researchers [13].
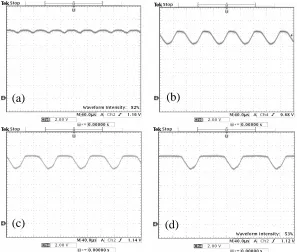
Figure 3 shows the oscillgram of HeNe output pulses by varying the duration of pulse from pulse
generator in a range of 10.11
s to 108.4
s. The power of RF driver was kept constant at 4.96watt. It is clearly seen that output signal of HeNe was broaden with increased in the duration of the pulse generator.
(a) (b)
Figure 2: (a) HeNe signal before modulated (b) He Ne signal that
have been modulated by AOML
(a) (b)
(c) (d)
The graph from Figure 4 (a) and (b) are plotted based on the results obtained by changing the RF
pulses width from the range of 10.11 s to 108.4 s. Figure 4 (a) shows the HeNe output
pulse-width versus RF pulse-pulse-width. Figure 4 (b) shows that the HeNe output frequency with the increasing of RF pulse frequency. This result is in good agreement with the other researcher [14]. It can bee seen that the value of HeNe frequency is exactly equal to RF pulse frequency. The
frequency of HeNe laser light is about 4.7 1014Hz. But when the HeNe laser light was
modulated and diffracted by acoustic waves that generated in acousto optic material, the HeNe signal tends to have similar frequency as the frequency of acousto optic modulator frequency. Hence the frequency of the first order diffracted beam was shifted by an amount exactly equal to the shift in the acousto optic modulator frequency, f.
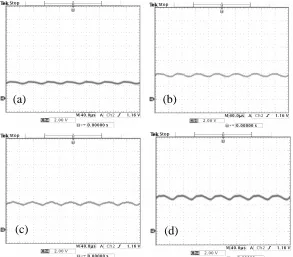
Figure 5 shows the oscillogram of HeNe output signal intensity by verifying the RF drive power. The HeNe output signal was detected by a photodetector which converted the electromagnetic radiation into an electric signal. The voltage of the signal was represented the amplitude intensity of the light source. It is notice that, increasing the power of RF driver increases the voltage of signal, implying that, the intensity of HeNe laser was increased when the power of RF driver increases.
(a) (b)
(c) (d)
Figure 5: The intensity of He Ne output signal at various RF drive
power (a) 1.53 watt (b) 2.53 watt (c) 3.54 watt (d) 4.01 watt
0 5 10 15 20 25
0 5 10 15 20 25
RF Pulses Frequency (kHz)
H e N e S ig n a l F re q u e n c y (k H z ) 0 20 40 60 80 100 120 140 160
0 20 40 60 80 100 120
RF Pulse Width (us)
H e N e S ig n a l P u ls e W id th (u s )
(a) (b)
Figure 4: (a) He Ne Signal pulse-width versus RF pulses width
The graph that depicted in Figure 6 represents the results obtained by varying the RF drive power from 1.01 watt to 5.00 watt. The duration from pulse generator was kept constant at
20.59
s. Figure 6 shows that the He Ne signal intensity increases linearly with the RF drivepower. The increase in RF drive power causes greater efficiency in the interaction. The amount of laser light diffracted to the first order beam depends on the amplitude of the acoustic waves that diffract the incident laser beam, and therefore, by modulating the power level of the acoustic wave source, the intensity of the diffracted light beam can be modulated.
CONCLUSION
The characteristic of the AOML using He Ne laser source was successfully studied. The He Ne laser beam was modulated into periodic signal. The pulse width of the modulated signal was found to increase linearly with respect to the RF pulse width. The modulated signal intensity was also found to increase linearly with RF drive power.
REFERENCES
[1] Kelin J.Kuhn, (2000). Laser Engineering. New York : Prentice Hall :193.
[2] A.J Demaria,William H.Glenn, Michael J.Brienza and Michael E.Mack, (1969).
Picosecond Laser Pulses.Proceeding Of IEEE, Vol.57: 1-25.
[3] F.P Schafer (1990). Topic In Apllied Physics Dye Lasers. New York : Springer Verlag.139.
[4] Amnon Yariv, Poochi Yeh (1984).Optical Waves in Crystals. Canada : John Wiley &
Sons. 318-366.
[5] Akis P.Goutzoulis and Dennis R.Pape (1994). Design and Fabrication of Acousto Optic
Devices. New York: Marcel Dekker: 1-13.
[6] E.I Gordon (1966), A Review Of Acoustooptical Deflection and Modulation
Devices.Proceeding Of IEEE, Vol 54:1391-1401.
[7] D.Maydan (1970).AcoustoOptical Pulse Modulators. IEEE J.Quantum Electron, Vol QE-6
:15-24.
[8] I.C Chang (1976). Acousto Optic Devices and Apllication. IEEE Trans.Sonics Ultrasonis,
Vol SU-23.
[9] James T.Luxon, David E.Parker (1992). Industrial lasers and Their Applications. New
Yrok : Prentice Hall : 30-31
[10] Partha P.Banerjee and Ting-Chung Poon (1991). Principal of Applied Optics. New York: Irwin: 190
[11] C B Scruby and L E Drain (1990), Laser Ultrasonic Technique and Applications. New York: Adam Hilger : 37-73.
[12] Walter Koechner (1992), Solid State Laser Engineering, New York: Springer
0 1 2 3 4 5 6 7 8 9 10
0 0.5 1 1.5 2 2.5 3 3.5 4 4.5 5 5.5
RF Drive Pow er (Watt)
H
e
N
e
S
ig
n
a
l
In
te
n
s
it
y
(
V
)
Verlag: 323.
[13] R.W Dixon (1967), Acoustic Diffraction of Light in Anisotropic Media, IEEE Journal of Quantum Electronics .Vol. QE-3, No.2: 85-93.