ABSTRACT
WORMALD, JONATHAN LAWRENCE. Atomistic Modeling of Fission Energy Deposition and Transport in Nuclear Fuel. (Under the direction of Dr. Ayman I. Hawari).
In fission based nuclear reactors fuel is subject to an intense neutron environment which propagates the neutron chain reaction. This process directly results in the production of fission fragments with an initial energy of approximately 1 MeV/amu. These fragments primarily lose energy through inelastic interactions which result in excitation of the electronic structure. Subsequently, these electron excitations transfer energy to the atomic lattice through electron-phonon (e-p) scattering. Consequently, a high temperature spike is formed around the fission fragment which permits enhanced atomic mobility. This initial stage of interaction, therefore, has disruptive consequences to the fuel material and may drive the onset and evolution of fuel damage. Experimentally, these consequences are found to be mitigated in uranium dioxide (UO2)–the most commonly used fuel in nuclear power
reactors–when compared to other fuel materials such as uranium carbide (UC) and uranium nitride (UN). UO2 may be characterized as having an insulator electronic structure, whereas
UN and UC may be characterized as metallic. Based on this observation, the impact of fission energy deposition on the evolution of the fuel microstructure can be correlated to the electronic structure of the fuel material.
In this work, the impact of the electronic structure, specifically the strength of e-p scattering interactions, on the evolution of fission fragment energy deposition in UO2 was
investigated. Initially, classical molecular dynamics (MD) combined with a two-temperature model (TTM) was used to capture the deposition of energy in the electronic structure and its subsequent transfer to the atomic lattice through e-p interactions. In these simulations the properties of the electronic system were varied to represent metal-like and insulator-like systems; whereby an insulator-like system corresponded to an increasing strength of the e-p interaction. For UO2, the strength of the e-p interaction was tuned to reproduce experimental
Subsequently, a new multi-group model (MGM) was developed, whereby the slowing-down process of fast electrons (e.g. delta-rays) and the thermalization of secondary electron excitations are explicitly treated. In this model the e-p interaction is based on e-p scattering cross-sections that are calculated from first principles. Additionally, the electron-electron scattering cross-sections and diffusion of fast electron-electrons is derived from Monte Carlo simulations of the electron transport process for fission fragment delta-rays. The MGM model, the calculated e-p cross sections, and the outcome of the fast electron interaction simulations were combined to predictively investigate fission driven phenomena in UO2. The
results demonstrated the ability to predictively reproduce experimental observations. This includes the formation and size of ion tracks, the enhanced mobility of atomic species and the annealing of defects due to fission spike-ion track interactions.
Atomistic Modeling of Fission Energy Deposition and Transport in Nuclear Fuel
by
Jonathan Lawrence Wormald
A dissertation submitted to the Graduate Faculty of North Carolina State University
in partial fulfillment of the requirements for the degree of
Doctor of Philosophy
Nuclear Engineering
Raleigh, North Carolina 2016
APPROVED BY:
_______________________________ _______________________________ Dr. Ayman I. Hawari Dr. Elena Jakubikova
Committee Chair
DEDICATION
BIOGRAPHY
Jonathan Wormald was born and Raleigh, North Carolina, and was raised in the neighboring towns of Cary and Apex. After graduating Valedictorian from Apex High School in 2007, Jonathan enrolled in the North Carolina State University where he graduated
magna cum laude with a Bachelor of Science in Nuclear Engineering in 2010. During his undergraduate studies, he interned at Knolls Atomic Power Laboratory in Niskayuna NY.
ACKNOWLEDGMENTS
I would like to express my gratitude to Dr. Ayman Hawari for his guidance and support both throughout this research project and in pursuit of my future career. I appreciate the opportunity to work on such a novel project and benefit from apprenticing with such an accomplished scientist. Throughout my graduate studies I was fortunate to have his support to attend multiple conferences. Dr. Hawari’s lessons and training have been profoundly influential in my development as a researcher. I look forward to our continued interactions throughout my career.
I would also like to thank Dr. Elena Jakubikova, Dr. Igor Bolotnov and Dr. Bernard Wehring for agreeing to serve on my committee and devoting their time to review my dissertation. Dr. Elena Jakubikova has been especially supportive of my research interest and career goals.
TABLE OF CONTENTS
LIST OF TABLES ... vii
LIST OF FIGURES ... viii
LIST OF SYMBOLS ... xviii
CHAPTER 1 Introduction... 1
1.1 Nuclear Reactors and Fuel Performance ... 1
1.1.1 Fuel Performance Analysis ... 3
1.2 Fission Effects in Nuclear Fuel ... 4
1.2.1 Fission Spike... 6
1.2.2 Point Defects... 7
1.2.3 Thermal Spike... 7
1.2.4 Fission Enhanced Diffusion... 8
1.2.5 Ion-Tracks ... 9
1.2.6 Fission-Bubble Resolution ... 10
1.2.7 Swelling ... 10
1.3 Fundamental Fuel Properties and Fission Effects ... 11
1.3.1 Fission Enhanced Diffusion and Electronic Structure in Nuclear Fuel ... 12
1.3.2 Correlation between Electron-phonon and Fission Effects ... 13
1.4 Fission Fragment Modeling ... 14
CHAPTER 2 Fission Fragments Physics ... 16
2.1 Radiation Energy Loss and Range ... 16
2.1.1 Scattering Theory Preliminaries ... 18
2.1.2 Formulation of Scattering Potentials ... 19
2.1.3 Inelastic Scattering Theory ... 25
2.1.4 Inelastic Scattering and Scatterer Dynamics ... 28
2.2 Fission Fragments ... 31
2.3 Delta-rays and Secondary Electron Excitations ... 36
2.3.1 Electron Slowing-down and thermalization ... 39
2.3.2 Solid-state Effects ... 43
2.3.3 Electron Scattering Interactions ... 44
CHAPTER 3 Electronic Structure of Nuclear Fuel and Electron-phonon Scattering ... 47
3.1 Solid-State Properties of Nuclear Fuel ... 47
3.1.1 Many-body Picture ... 48
3.1.2 Electronic Structure Theory ... 50
3.1.3 Electronic Structure Calculations of UO2 ... 53
3.1.4 Theoryof lattice vibrations in solids ... 58
3.1.5 Calculation of Phonons in UO2 ... 60
3.2 Electron-Phonon Scattering in Nuclear Fuel ... 64
3.3 Methodology for Generation of Electron-Phonon Scattering Cross-Sections .. 66
3.3.2 Treatment of Thermal Electron Quasi-Particles ... 70
3.3.3 Generation of the Effective Electron-Phonon Interaction ... 74
3.3.4 Dynamic Structure Factors of UO2 ... 78
3.3.5 Double Differential Electron-Phonon Scattering Cross-Section in UO2 ... 85
3.3.6 Differential Electron-Phonon Scattering Cross-Section in UO2 ... 90
3.3.7 Electron-Phonon Scattering Cross-Section in UO2 ... 95
3.3.8 Electron-Phonon Stopping Power of Thermal Electrons in UO2 ... 98
CHAPTER 4 Fission Spike Evolution and Energy Transport ... 110
4.1 Two-Temperature Model ... 112
4.1.1 Molecular Dynamics Two-Temperature Model ... 113
4.2 MD-TTM Simulations of Fission-Spikes ... 116
4.2.1 Ion-Track Formation ... 118
4.2.2 Fission Enhanced Diffusion... 124
4.2.3 Fission-Track Interactions ... 128
4.3 Multi-group Model for Fission Effects ... 131
4.3.1 Molecular Dynamics Multi-Group Model ... 133
4.4 MD-MGM Simulations of Fission Spikes ... 138
4.4.1 Ion-track Formation ... 142
4.4.2 Fission Enhanced Diffusion... 150
4.4.3 Fission-damage Interactions ... 155
CHAPTER 5 Conclusion and Future-work ... 160
5.1 Correlations between Fission Effects and Electronic Structure ... 161
5.2 Future-work... 162
REFERENCES ... 165
APPENDICES ... 180
APPENDIX A.Feynman Diagrams and Many-Body Theory ... 181
A.1. Electron-Electron Scattering ... 186
A.2. Electron-Phonon Scattering ... 190
APPENDIX B.Density Functional Theory ... 197
B.1. Exchange Correlation Functional ... 198
B.2. PAW Pseudopotentials ... 199
B.3. TDDFT and Response Functions ... 202
APPENDIX C.Molecular Dynamics ... 204
C.1. Thermostats ... 205
C.2. Correlation Functions ... 207
APPENDIX D.Computational Packages ... 209
D.1. VASP ... 209
D.2. PHONON ... 214
D.3. LAMMPS... 215
LIST OF TABLES
Table 1-1. Correlation of electronic structure to thermal conductivity and fission enhanced diffusion of uranium. For UO2 and ZrO2 the size of the band gap (Eg) is given. The values of
the thermal conductivities are listed for a temperature of 1000 oC... 13 Table 2-1. Basic Feynman diagrams for particle propagators and interactions. ... 22 Table 3-1. List of common quasi-particles and collective excitations found in solids ... 50 Table 3-2. Summary of UO2 properties, lattice parameter, a, bulk modulus, B0, cohesive
energy, Ecoh, band gap energy, Eg, and uranium magnetic moment μ. The magnetic moment is in Bohr magnetons, μB. The dielectric constant ε is the relative dielectric function for a
zero momentum and zero energy transfer, and is unitless. ... 56 Table 3-3. Summary of neutron scattering parameters of uranium and oxygen. ... 61 Table 3-4. DFT predicted band gap energy as a function of the effective onsite coulomb repulsion energy, Ueff. The band gap energy is indicated as Eg. ... 69
Table 4-1. Track Radius for various electronic stopping powers and electron-phonon relaxtion times. The MD-TTM electronic system had a 20 W∙m-1∙K-1conductivity for all τ
e-p.
The experimental data are 173 MeV (29 keV/nm) Xe ions, 1300 MeV (56 keV/nm) uranium ions, and 2713 MeV (59 keV/nm) uranium ions in UO2. Fission fragments of stopping
powers between 18 keV/nm and 22 keV/nm have been found to not form tracks in bulk UO2
[58,60]. MD results have an estimated uncertainty of approximately ±0.3 nm. ... 124 Table 4-2. Impact of electronic structure on fission fragment annealing of latent ion tracks. The MD predicted initial track radii, Ri, and final track radii, Rf, have estimated uncertainties
of no more than ±0.3 nm. ... 130 Table 4-3. Stopping force and energy of SHI and fission fragments used in MGM simulations of fission spikes. The maximum delta-ray energy, Em, calculated using Eq. (2.54) is also
shown. ... 140 Table 4-4. Track Radius for various electronic stopping powers and band gap energies. The MD-MGM electronic system had an 11 W∙m-1∙K-1conductivity for all Eg. The experimental
data are 173 MeV (29 keV/nm) Xe ions, 1300 MeV (56 keV/nm) uranium ions, and 2713 MeV (59 keV/nm) uranium ions in UO2. Fission fragments of stopping powers between 18
keV/nm and 22 keV/nm have been found to not form tracks in bulk UO2 [58,60]. Track radii
have an estimated uncertainty of approximately ±0.3 nm. ... 148 Table 4-5. Impact of electronic structure on fission fragment annealing of latent ion tracks. The MD predicted initial track radii, Ri, and final track radii, Rf, have estimated uncertainties
LIST OF FIGURES
Fig. 1.1. The fuel assembly of a pressurized water reactor (PWR) [3]. The assembly is composed of fuel rods that are in turn composed of UO2 fuel pellets. The UO2 is clad in
zircaloy. ... 1 Fig. 1.2. Length and times scales for computational techniques used in the multi-scale modeling method. ... 4 Fig. 1.3. Effect of fission dose on swelling in nuclear fuels [12,13,60,61]. The magnitude of swelling for UN, UC, and UO2 is directly correlated to the thermal conductivity. ... 11
Fig. 1.4. Flow chart of simulation process for the modeling of fission fragment energy deposition and evolution in UO2. ... 15
Fig. 2.1. Feynman diagram of general scattering phenomena. ... 23 Fig. 2.2. Energy spectrum of 235U fission fragments resulting from fission induced by thermal
neutrons [87-89]. This distribution is representative of fission fragments expected in a most nuclear reactors, which in general operate with a thermal neutron spectrum. ... 31 Fig. 2.3. Feynman diagram of RPA ... 32 Fig. 2.4. Electronic and nuclear stopping power of typical fission fragments calculated with the SRIM code [95]. The electronic stopping power is dominant for ion energies greater than 1-5 MeV. The inset illustrates the change in stopping power for the fission fragments as functions of its path length, x, estimated using Eq. (2.4). ... 34 Fig. 2.5. LFF, 95 MeV 95Kr, trajectory and collision cascades in UO2, calculated using Monte
Carlo sampling with the SRIM code [95]. Fission fragment trajectories are in black, whereas colored regions indicate collision cascades. Trajectories were generated for 100 LFF. Each gridline corresponds to 1 μm. ... 35 Fig. 2.6. HFF, 70 MeV 140Ba, trajectory and collision cascades in UO2, calculated using
Monte Carlo sampling with the SRIM code [95]. Fission fragment trajectories are in black, whereas colored regions indicate collision cascades. Trajectories were generated for 100 HFF. Each gridline corresponds to 1 μm. ... 36 Fig. 2.7. Fission fragment delta-ray emission spectra for LFF and HFF. The LFF and HFF spectra correspond to energies of 95 MeV (~1 MeV/amu) and 70 MeV (~0.5 MeV/amu) respectively. Each spectra represents a discrete probability distribution as opposed to a differential distribution, and was calculated from Eq. (2.58). ... 39 Fig. 2.8. Evolution of delta-ray energy during fission spike for a (a) LFF and (b) HFF. The LFF and HFF have energies of 95 MeV (~1 MeV/amu) and 70 MeV (~0.5 MeV/amu) respectively. Cylindrical spatial bins have a thickness of 0.5 nm, whereas each time bin was 10 attoseconds (10-17 s). For each fragment the energy density distribution in time and space
Fig. 2.9. Evolution of delta-ray energy distribution for a (a) LFF and (b) HFF. The LFF and HFF have energies of 95 MeV (~1 MeV/amu) and 70 MeV (~0.5 MeV/amu) respectively. The energy spectrum was divided into 40 logarithmic energy bins between 10 eV and the maximum delta-ray energy calculated from Eq. (2.54); each time bin was 10 atto-seconds (10-17 s). ... 42
Fig. 2.10. Feynman diagram of electron scattering in crystals. The scattering diagrams include both electron-electron and electron-phonon interactions. ... 45 Fig. 2.11. Feynman diagram of effective electron-phonon interaction. The effective interaction is a ‘dressed’ interaction which includes the effects of crystal polarization. ... 45 Fig. 3.1. Crystal unit cells of UO2 (left), UN (right), and U3Si2 (bottom). The symmetry of the
UO2 and UN unit cells are the same, Fm-3m (space-group 225). The symmetry of U3Si2 is
P4/mbm UC (not shown) has the same crystal structure as UN, with the nitrogen interchanged with carbon. ... 48 Fig. 3.2. Electronic structure of nuclear fuel materials, UO2, UC, UN, and U3Si2 as obtained
through DFT calculations using the VASP code with the Perdew-Burke-Ernzerhof projector augmented-wave pseudopotentials and the addition of a Hubbard model for UO2
[38,51,115-120]. The availability of states is continuous across the Fermi energy in UC, UN and U3Si2.
In contrast, a 2 eV band gap is observed in UO2. ... 53
Fig. 3.3. UO2 unit cell in 1-k antiferromagnetic ground state. The magnetic moments are
indicated by black arrow. Uranium atoms (gray/light) form a FCC lattice, whereas oxygen atoms (red/dark) form a cubic lattice. ... 54 Fig. 3.4. Equation of state for UO2. The Birch-Murnaghan fit, Eq. (3.10), is overlayed on the
data predicted by DFT calculations. The volume corresponding to the minimum of the Birch-Murnaghan equation of state is assumed to be the ground state. ... 55 Fig. 3.5. Total electron density of states for UO2 as predicted through DFT calculation and
Eq. (3.9). The energy is referenced to the Fermi energy, EF. The inset is a comparison
between the calculated partial electronic density of states for 5f and the experimentally measure 5f electron spectrum [138]. The experimental data for the valence and conduction band were measured using XPS and BIS techniques respectively. ... 56 Fig. 3.6. Comparison of measured and calculated dielectric of UO2. The dielectric function
was calcualted in the RPA using linear response TDDFT and is shown in red. The measured dielectric function was extracted from reflectivity measurements of UO2 single crystals and is
shown in black [143]. ... 57 Fig. 3.7. Comparison of the measured and calculated energy loss spectrum of UO2 at
Fig. 3.8. Phonon dispersion curve for UO2. The calculation was obtained from ab initio
lattice dynamics and is shown as a line in red. The experimental phonon dispersion measurements were obtained neutron scattering measurements shown as circles (a) [147] and squares (b) [23,24]. The phonon momentum is labeled by the wave vector coordinate in reduced lattice units (r.l.u) such that the phonon momentum is relative to the value in the X-direction. ... 62 Fig. 3.9. Neutron weighted phonon density of states of UO2. The calculation was obtained
from ab initio lattice dynamics and is shown as a line in red. The experimental phonon dispersion measurements were obtained neutron scattering measurements [23,24]. ... 63 Fig. 3.10. Neutron weighted phonon density of states of UO2 at 295 K. The calculation was
obtained from ab initio lattice dynamics broadened using Eq. (3.16) with experimental line-widths [23] and is shown as a line in red. The experimental phonon dispersion measurements were obtained from neutron scattering measurements [23,24]. ... 63 Fig. 3.11. Flow chart of the calculation of inelastic electron-phonon cross-section. ... 67 Fig. 3.12. UO2 electron density of states for various band gaps predicted using DFT. The
energy is relative to the Fermi energy, EF. The variation in band gap energies are a result of
varying the effective onsite coulomb repulsion energy in the Hubbard model applied to the DFT calculations [129]. The electronic density of states is calculated according to Eq. (3.9). ... 68 Fig. 3.13. UO2 total phonon density of states for various band gaps predicted using DFT. The
variation in band gap energies are a result of varying the effective onsite coulomb repulsion energy in the Hubbard model applied to the DFT calculations [86]. The inset shows the partial phonon density of states for uranium and oxygen for Eg=2.0 eV. ... 70
Fig. 3.14. Electron-phonon coupling strength and band gap energy correlation. The data was obtained from various experimental measurements and theoretical calculations [22,107,109,157-181]. Values for UO2 are indicated separately from the general trend
[22,169]. The inset shows the effective mass used in this work for each band gap. ... 72 Fig. 3.15. Electron-phonon relaxation time as a function of band gap energy. The range of values in this work is compared to theoretical and experimental estimates of the energy relaxation rate of excited electrons in materials [22,86,107,158-161,186-203]. The range of e-p relaxation times in this work was calculated according to Eq. (3.30). ... 74 Fig. 3.16. Atomic PAW pseudopotentials for uranium and oxygen [117,119]. The pseudopotentials shown include only the Hartree and local parts. ... 75 Fig. 3.17. Inverse static dielectric function of UO2 calculated from TDDFT. The primary plot
illustrates the dielectric function as calculated from TDDFT with and electron mass of me.
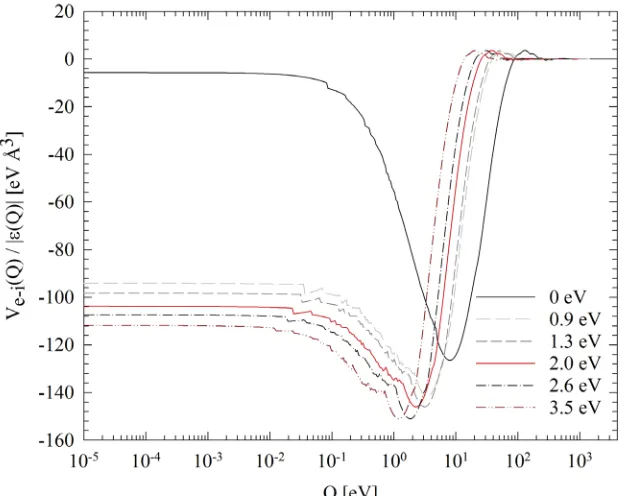
Fig. 3.19. Effective electron-phonon scattering potential (Eq. (2.63)) of an electron quasi-particle with uranium in UO2 for various band gap energies... 77
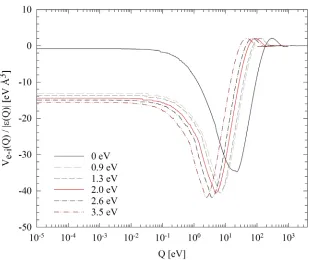
Fig. 3.20. Effective electron-phonon scattering potential (Eq. (2.63)) of an electron quasi-particle with oxygen in UO2 for various band gap energies. ... 78
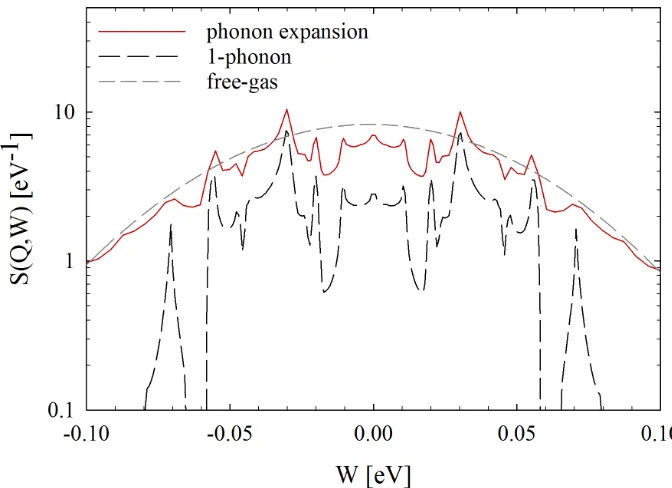
Fig. 3.21. Dynamic structure factor of oxygen in UO2 with a 2 eV band gap compared to the
1-phonon contribution (Eq. (3.24)) and free gas (Eq. (3.26)) at 300 K and a momentum transfer of 40 eV. The dynamic structure factor is calculated using the phonon expansion Eqs. (3.23)-(3.25) ... 79 Fig. 3.22. Dynamic structure factor of oxygen in UO2 with a 2 eV band gap compared to the
1-phonon contribution (Eq. (3.24)) and free gas (Eq. (3.26)) at 10000 K and a momentum transfer of 40 eV. The dynamic structure factor is calculated using the phonon expansion Eqs. (3.23)-(3.25). ... 79 Fig. 3.23. Dynamic structure factor of oxygen in UO2 at 300 K calculated in the independent
oscillator approximation, see Eq. (3.22). ... 81 Fig. 3.24. Dynamic structure factor of oxygen in UO2 at 1500 K calculated in the
independent oscillator approximation, see Eq. (3.22). ... 81 Fig. 3.25. Dynamic structure factor of oxygen in UO2 at 3300 K calculated in the
independent oscillator approximation, see Eq. (3.22). ... 82 Fig. 3.26. Dynamic structure factor of oxygen in UO2 at 10000 K calculated in the
independent oscillator approximation, see Eq. (3.22). ... 82 Fig. 3.27. Dynamic structure factor of uranium in UO2 at 300 K calculated in the independent
oscillator approximation, see Eq. (3.22). ... 83 Fig. 3.28. Dynamic structure factor of uranium in UO2 at 1500 K calculated in the
independent oscillator approximation, see Eq. (3.22). ... 83 Fig. 3.29. Dynamic structure factor of uranium in UO2 at 3300 K calculated in the
independent oscillator approximation, see Eq. (3.22). ... 84 Fig. 3.30. Dynamic structure factor of uranium in UO2 at 10000 K calculated in the
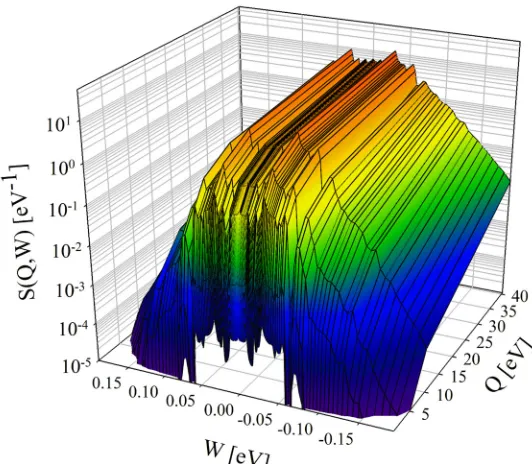
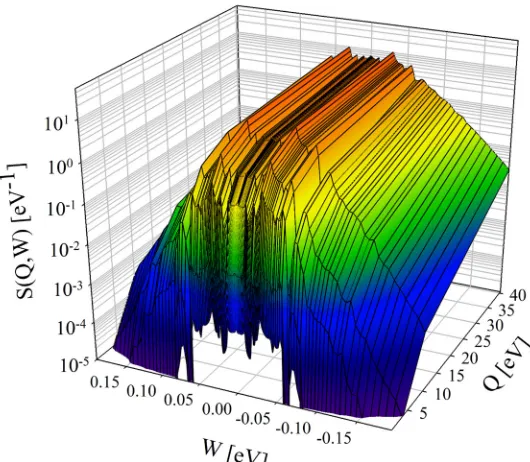
independent oscillator approximation, see Eq. (3.22). ... 84 Fig. 3.31. Inelastic electron-phonon double differential scattering cross-section for oxygen in UO2 at 300 K, see Eq. (3.21). ... 86
Fig. 3.32. Inelastic electron-phonon double differential scattering cross-section for oxygen in UO2 at 1500 K, see Eq. (3.21). ... 86
Fig. 3.33. Inelastic electron-phonon double differential scattering cross-section for oxygen in UO2 at 3300 K, see Eq. (3.21). ... 87
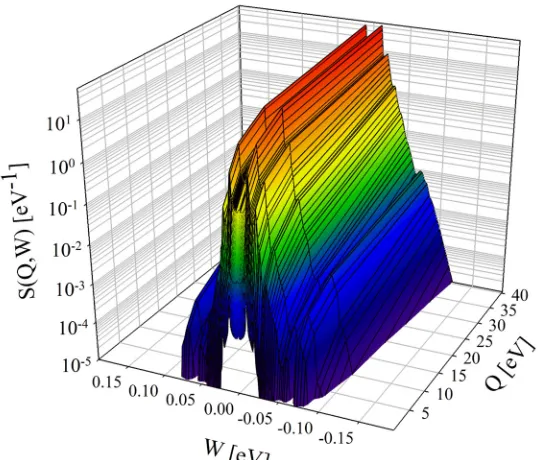
Fig. 3.35. Inelastic electron-phonon double differential scattering cross-section for uranium in UO2 at 300 K, see Eq. (3.21). ... 88
Fig. 3.36. Inelastic electron-phonon double differential scattering cross-section for uranium in UO2 at 1500 K, see Eq. (3.21). ... 88
Fig. 3.37. Inelastic electron-phonon double differential scattering cross-section for uranium in UO2 at 3300 K, see Eq. (3.21). ... 89
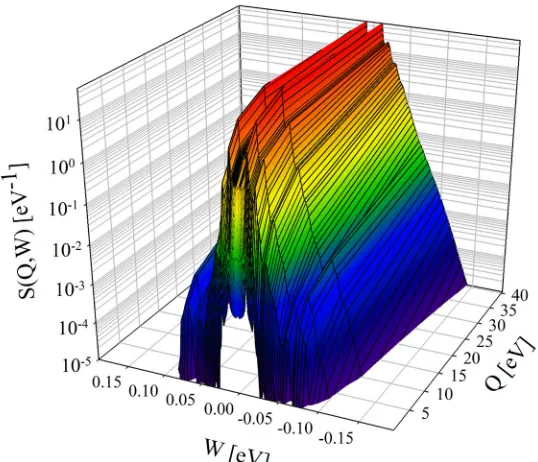
Fig. 3.38. Inelastic electron-phonon double differential scattering cross-section for uranium in UO2 at 10000 K, see Eq. (3.21). ... 89
Fig. 3.39. Inelastic electron-phonon differential scattering cross-section for oxygen in UO2 at
300 K, see Eq. (3.31). ... 91 Fig. 3.40. Inelastic electron-phonon differential scattering cross-section for oxygen in UO2 at
1500 K, see Eq. (3.31). ... 91 Fig. 3.41. Inelastic electron-phonon differential scattering cross-section for oxygen in UO2 at
3300 K, see Eq. (3.31). ... 92 Fig. 3.42. Inelastic electron-phonon differential scattering cross-section for oxygen in UO2 at
10000 K, see Eq. (3.31). ... 92 Fig. 3.43. Inelastic electron-phonon differential scattering cross-section for uranium in UO2
at 300 K, see Eq. (3.31)... 93 Fig. 3.44. Inelastic electron-phonon differential scattering cross-section for uranium in UO2
at 1500 K, see Eq. (3.31)... 93 Fig. 3.45. Inelastic electron-phonon differential scattering cross-section for uranium in UO2
at 3300 K, see Eq. (3.31)... 94 Fig. 3.46. Inelastic electron-phonon differential scattering cross-section for uranium in UO2
at 10000 K, see Eq. (3.31)... 94 Fig. 3.47. Comparison of independent oscillator inelastic and elastic electron-phonon cross-section (Eq. (3.34)) to free-atom (Eq. (3.35)) for oxygen in UO2 at temperatures 300 K‒3300
K. ... 96 Fig. 3.48. Comparison of independent oscillator inelastic and elastic electron-phonon cross-section (Eq. (3.34)) to free-atom (Eq. (3.35)) for oxygen in UO2 at 10000 K. ... 96
Fig. 3.49. Comparison of independent oscillator inelastic and elastic electron-phonon cross-section (Eq. (3.34)) to free-atom (Eq. (3.35)) for uranium in UO2 at temperatures 300 K‒
3300 K. ... 97 Fig. 3.50. Comparison of independent oscillator inelastic and elastic electron-phonon cross-section (Eq. (3.34)) to free-atom (Eq. (3.35)) for uranium in UO2 at 10000 K. ... 97
Fig. 3.51. Electron-phonon stopping force by oxygen in UO2. The stopping force is evaluated
Fig. 3.52. Electron-phonon stopping force by uranium in UO2. The stopping force is
evaluated from Eq. (3.36) relative to the uranium atom density in UO2. ... 99
Fig. 3.53. Impact of electronic structure on electron-phonon stopping force by oxygen in UO2
at 300 K. The stopping force is evaluated from Eq. (3.36) relative to the oxygen atom density in UO2. ... 100
Fig. 3.54. Impact of electronic structure on electron-phonon stopping force by uranium in UO2 at 300 K. The stopping force is evaluated from Eq. (3.36) relative to the uranium atom
density in UO2. ... 100
Fig. 3.55. Energy loss and gain contribution to the electron-phonon stopping force by oxygen in UO2for temperatures 300 K‒10000 K. The stopping force is evaluated from Eq.(3.37) and
(3.38) relative to the oxygen atom density in UO2. ... 101
Fig. 3.56. Energy loss and gain contribution to the electron-phonon stopping force by uranium in UO2 for temperatures 300 K‒10000 K. The stopping force is evaluated from
Eq.(3.37) and (3.38) relative to the uranium atom density in UO2. ... 102
Fig. 3.57. Electron-phonon energy (a) loss and (b) gain rate due to oxygen in UO2 modeled
with 0 eV band gap. The stopping powers are evaluated from Eqs. (3.39) and (3.40) relative to the oxygen atom density in UO2. The atom and electron temperatures are Te and Ta
respectively. ... 104 Fig. 3.58. Electron-phonon energy (a) loss and (b) gain rate due to uranium in UO2 modeled
with 0 eV band gap. The stopping powers are evaluated from Eqs. (3.39) and (3.40) relative to the uranium atom density in UO2. The atom and electron temperatures are Te and Ta
respectively. ... 105 Fig. 3.59. Electron-phonon energy (a) loss and (b) gain rate due to oxygen in UO2 modeled
with 0.9 eV band gap. The stopping powers are evaluated from Eqs. (3.39) and (3.40) relative to the oxygen atom density in UO2. The atom and electron temperatures are Te and Ta
respectively. ... 106 Fig. 3.60. Electron-phonon energy (a) loss and (b) gain rate due to uranium in UO2 modeled
with 0.9 eV band gap. The stopping powers are evaluated from Eqs. (3.39) and (3.40) relative to the uranium atom density in UO2. The atom and electron temperatures are Te and Ta
respectively. ... 107 Fig. 3.61. Electron-phonon energy (a) loss and (b) gain rate due to oxygen in UO2 modeled
with 2.0 eV band gap. The stopping powers are evaluated from Eqs. (3.39) and (3.40) relative to the oxygen atom density in UO2. The atom and electron temperatures are Te and Ta
respectively. ... 108 Fig. 3.62. Electron-phonon energy (a) loss and (b) gain rate due to uranium in UO2 modeled
with 2.0 eV band gap. The stopping powers are evaluated from Eqs. (3.39) and (3.40) relative to the uranium atom density in UO2. The atom and electron temperatures are Te and Ta
Fig. 4.1. Evolution of fission fragment energy loss. The corresponding evolution of the electronic structure and atomic lattice is also shown. Equilibration between electrons and phonons, occurs as the electrons thermalize through electron-phonon scattering resulting in localized atomic heating. Quenching refers to the subsequent cooling process, whereby the electrons and lattice temperature return to thermodynamic equilibrium with the bulk crystal. ... 111 Fig. 4.2. Evolution of 29 keV/nm thermal spike in a simulated insulator-like system with τe-p
of 150 fs. The fission spike time progression from left to right is (a) original crystal, (b) ballistic phase, (c) quenching phase, (d) annealing phase, and (e) latent track. Uranium atoms are blue (dark) and oxygen atoms are yellow (light). ... 119 Fig. 4.3. Evolution of relative uranium density resulting from a 29 keV/nm thermal spike in a simulated insulator-like system with τe-p of 150 fs. The relative density is referenced to the initial density within each zone... 120 Fig. 4.4. (a) Pristine crystal and latent tracks resulting from (b) 29 keV/nm, (c) 56 keV/nm and (d) 59 keV/nm thermal spike in an insulator-like system with τep of 150 fs. Uranium
atoms are blue (dark) and oxygen atoms are yellow (light). ... 120 Fig. 4.5. Pair-correlation function, G(r), for a simulated 29 keV/nm ion track in a system with a τe-p of 150 fs and ke of 20 W∙m-1∙K-1. The pair correlation functions were measured within
0.5 nm thick cylindrical zones centered about the simulated particle trajectory. The cylindrical zone for each illustrated pair correlation is shown. ... 121 Fig. 4.6. (a) Temperature and (b) pressure spikes for a simulated 29 keV/nm ion in an UO2
system with τe-p of 150 fs. The temperature distributions illustrate the rapid increase in lattice energy in a thermal spike followed by a slower quenching of heat from a molten zone. The pressure spike is shown as stress energy, pressure × volume, illustrating the development and decay of a pressure gradient. A stress zone may be observed around the latent track, which has a radius of 1.2 nm. ... 122 Fig. 4.7. (a) Temperature and (b) pressure spikes for a simulated 29 keV/nm ion in an UO2
system with τe-p of 1000 fs. The pressure spikeis shown as stress energy, pressure × volume, illustrating the development and decay of a pressure gradient. ... 122 Fig. 4.8. (a) Temperature and (b) pressure spikes for a simulated 22 keV/nm fission fragment in an UO2 system with τe-p of 150 fs. The pressure spike is shown as stress energy, pressure ×
volume, illustrating the development and decay of a pressure gradient. While no track was observed for fission fragments, a stress zone from oxygen defect clusters may be observed near the simulated fission fragment path. ... 123 Fig. 4.9. Fission-enhanced diffusion coefficient of uranium for a fission rate density of 1013
cm-3∙s-1 and an insulator-like electronic system with a τe-p of 150 fs and ke of 20 W∙m-1∙K-1.
Fig. 4.10. Atomic displacement for uranium and oxygen resulting from a 22 keV/nm fission spike in a UO2 system with τe-p of (a) 150 fs and (b) 1000 fs. The atomic displacements and
average temperature, Tave, were calculated within a 6 nm radius of the simulated fission
fragment path. ... 127 Fig. 4.11. Uranium sub-lattice of UO2 in the {110} direction around (a) a 1 nm track and (b)
dislocation precipitates following a simulated 29 keV/nm ion spike. Dislocation loops are a result of stacking faults and two exemplar dislocations are labeled. ... 128 Fig. 4.12. Interaction of 22 keV/nm fission fragment with (a) a 3 nm track, in UO2 modeled
as (b) insulator-like and (c) metal-like from MD-TTM simulations. The distance between the track center and fission fragment trajectory is Δx = 0 nm. ... 129 Fig. 4.13. Interaction of 22 keV/nm fission fragment with (a) a 3 nm track, in UO2 modeled
as (b) insulator-like and (c) metal-like from MD-TTM simulations. The distance between the track center and fission fragment trajectory is Δx = 3 nm. ... 129 Fig. 4.14. (a) Relaxation time and (b) effective diffusion coefficient for delta-rays resulting from an 18 keV/nm LFF and 22 keV/nm HFF. The relaxation time (Eq. (4.34)) defines the rate of energy transfer rate from the fast electron group to the thermal electron group, whereas the diffusion coefficient (Eq. (4.32)) describes the spatial transport of the energy of the fast electrons. ... 140 Fig. 4.15. Evolution of a thermal spike due to a 29 keV/nm 129Xe ion in a simulated system with 2 eV band gap. The ion spike time progression from left to right is (a) original crystal, (b) ballistic phase, (c) quenching phase, (d) annealing phase, and (e) latent track. Uranium atoms are blue (dark) and oxygen atoms are yellow (light). ... 143 Fig. 4.16. Evolution of relative uranium density during a thermal spike resulting from a 29 keV/nm 129Xe ion in a simulated insulator system with a 2 eV band gap. The relative density
is referenced to the initial density within each zone. ... 144 Fig. 4.17. (a) Pristine crystal and latent tracks resulting from (b) 29 keV/nm, (c) 56 keV/nm and (d) 59 keV/nm ion spike in an insulator system with a 2 eV band gap. Uranium atoms are blue (dark) and oxygen atoms are yellow (light). The ion corresponding to each stopping force is listed in Table 4-3. ... 144 Fig. 4.18. Pair-correlation function, G(r), for a simulated 29 keV/nm 129Xe ion track in a
system with a 2 eV band gap and ke of 11 W∙m-1∙K-1. The pair correlation functions were
measured within 0.5 nm thick cylindrical zones centered about the simulated particle trajectory. The cylindrical zone for each illustrated pair correlation is shown. ... 145 Fig. 4.19. (a) Temperature and (b) pressure spikes for a simulated 22 keV/nm HFF in an UO2
Fig. 4.20. (a) Temperature and (b) pressure spikes for a simulated 29 keV/nm 129Xe ion in an
UO2 system with 2 eV band gap. The temperature distributions illustrate the rapid increase in
lattice energy in a thermal spike followed by a slower quenching of heat from a molten zone. The pressure spike is shown as stress energy, pressure × volume, illustrating the development and decay of a pressure gradient. A stress zone may be observed around the latent track, which has a radius of 1.9 nm. ... 146 Fig. 4.21. (a) Temperature and (b) pressure spikes for a simulated 29 keV/nm 129Xe ion in an
UO2 system with a 0 eV band gap. The pressure spike is shown as stress energy, pressure ×
volume, illustrating the development and decay of a pressure gradient. ... 147 Fig. 4.22. Comparison of track radii predicted using MD-MGM and MD-TTM. The track radii for both models have an uncertainty of 0.3 nm. The band gap corresponding to each τe-p
utilized in MD-TTM was derived from Fig. 3.15, and is shown with the corresponding estimated 0.25 eV uncertainty. Experimental track radii are shown with uncertainty [58].. 149 Fig. 4.23. Fission-enhanced diffusion coefficient of uranium for a fission rate density of 1013
cm-3∙s-1 and an insulator electronic system with a E
g of 2 eV and ke of 11 W∙m-1∙K-1. The
MD-MGM D*, calculated using Eq. (4.18) and (4.19), is compared to experimental measures of uranium fission enhanced diffusion, D*, [14,53-55] and thermally actived diffusion coefficient [222-224]. As in experiment the predicted D* has a relatively athermal behavior [14,53-55]... 150 Fig. 4.24. Atomic displacement for uranium and oxygen resulting from a 22 keV/nm fission spike in a UO2 system with a (a) 2 eV band gap and (b) 0 eV band gap. The atomic
displacements and average temperature, Tave, were calculated within a 6 nm radius of the
simulated fission fragment path. ... 152 Fig. 4.25. Atomic displacement for uranium and oxygen resulting from a 18 keV/nm fission spike in a UO2 system with a (a) 2 eV band gap and (b) 0 eV band gap. The atomic
displacements and average temperature, Tave, were calculated within a 6 nm radius of the
simulated fission fragment path. ... 152 Fig. 4.26. Comparison of atomic mobility predicted from MD-MGM and MD-TTM simulations of LFF (18 keV/nm) and HFF (22 keV/nm) simulations. The band gap corresponding to each τe-p utilized in MD-TTM was derived from Fig. 3.15, and is shown with the corresponding estimated 0.25 eV uncertainty. The MSD was calculated in 16 nm radius around the trajectory of the fission fragment trajectory, and includes the contribution from thermal vibrations. In the case of the metal systems, Eg = 0 eV, the contribution to MSD
from enhanced mobility resulting from fission is negligible in comparison to thermal vibrations... 154 Fig. 4.27. Uranium sub-lattice of UO2 in the {110} direction around (a) a 2 nm track and (b)
Fig. 4.28. Interaction of 22 keV/nm HFF with (a) a 3 nm track, in UO2 modeled as (b)
insulator and (c) metal from MD-MGM simulations. The distance between the track center and fission fragment trajectory is Δx = 0 nm. ... 157 Fig. 4.29. Interaction of 22 keV/nm HFF with (a) a 3 nm track, in UO2 modeled as (b)
insulator and (c) metal from MD-MGM simulations. The distance between the track center and fission fragment trajectory is Δx = 3 nm. ... 157 Fig. 4.30. Interaction of 18 keV/nm LFF with (a) a 3 nm track, in UO2 modeled as (b)
LIST OF SYMBOLS
Solid State Physicsq Wavevector of collective excitations (momentum transfer)
ω
Energy of collective excitations (energy transfer)
g
E Band gap energy between valence and conduction electrons
( )
e
D E Electron density of states
( )
ε q Static dielectric function
(
,)
ε q ω Dielectric function
( )
ph
D E Phonon density of states
Quantum and Many-Body Theory
(
)
0 ,
G k ω Free particle propagator
(
,)
G k ω Particle propagator
(
,)
c
G qω Propagator for collective excitations (two-particle propagator)
Γ Phonon line-width (phonon self-energy)
(
,)
D q ω Phonon propagator
(
,)
S q ω Dynamic structure factor
(
,)
s
S q ω Self-part of dynamic structure factor
(
,)
d
S q ω Distinct part of dynamic structure factor
φ Wavefunction
ϕ Electron wavefunction
λ Wavefunction of medium
0
ˆ
H Unperturbed Hamiltonian
ˆ
H Hamiltonian operator
ˆ
P Momentum operator
Scattering Theory
E Particle energy
W Energy transfer
Q Momentum transfer
x Path length , '
k k Incident and scattered wavevector of a free particle
ˆ
T Transition matrix operator
V Scattering potential
V Effective interaction potential 2
'
E
σ ∂
∂Ω∂ Double differential cross-section (generic) 2
Q W
σ ∂
∂ ∂ Double differential cross-section (momentum and energy variables)
σ ∂
∂Ω Elastic differential cross-section
W σ ∂
∂ Inelastic differential cross-section
σ
Microscopic cross-sectionΛ Macroscopic cross-section
d d E x −
Stopping force
d d E t −
Stopping power
e e
τ
− Electron-electron relaxation timee p
τ − Electron-phonon relaxation time
e p
g − Electron-phonon coupling constant
Basic Properties and Thermodynamics
R,r Position
v Velocity
F Force
M Atomic mass
e
m Electron mass
ρ Particle density
a
N Atom density
, e
n n Electron density
T Temperature
a
e
T Electron temperature
a
C Atom heat capacity
( )
a Ta
κ Atomic thermal conductivity
e
C Electron heat capacity
,
e e
κ κ Electron thermal conductivity
D Diffusion coefficient
D* Fission enhanced diffusion coefficient
( )
G R Pair-correlation function
Constants
0
ε Permittivity of free space
Plank’s constant
B
CHAPTER 1 Introduction
1.1 Nuclear Reactors and Fuel Performance
Nuclear fuel in a nuclear reactor is the initial and primary component that defines the reactor’s operational and safety characteristics. Much of the cost in the construction and operation of a reactor is dedicated to the safety of the fuel and core systems. Fuel performance analysis considers the macroscopic consequences due to exposure to the extreme conditions of a nuclear reactor core. These macroscopic effects, such as fuel swelling or pellet clad mechanical interaction (PCMI) are driven by microscopic phenomena and the fuel material’s microstructure and microscopic properties.
The design and safe operating limits of a nuclear reactor may be correlated to thermodynamic and radiation resistance properties of the material used for reactor fuel. Nuclear fuel in most current power reactors is constructed into fuel rods by loading pellets of sintered UO2 of approximately ½ cm radius into 4 meter zirconium alloy cladding with a
thickness of less than 0.1 cm. A typical fuel assembly for a light water reactor (LWR) is shown in Fig. 1.1.
In general, the operating power of nuclear reactors is limited by the heat flux along the fuel rods, particularly that of the hottest rod. The centerline temperature of the hottest rod in UO2 fuel is typically less than 2100 K in LWR, providing sufficient margin to melting at
3100 K [1]. The limit for heat flux is imposed due to concerns of fuel melt or clad failure in an accident scenario, and is generally a function of the thermal conductivity of the fuel [2]. The limit imposed on linear heat flux restricts the thermal efficiency of the core (around 30% in the current US nuclear fleet), by limiting the core coolant temperature. To enhance the thermal efficiency in a reactor system the temperature of the coolant, i.e. working fluid, must be increased; which may be achieved by enhancing the thermal conductivity within the fuel.
Much recent effort has been expended to find accident tolerant fuels (ATF) compatible with current LWR technology which may serve as alternatives to UO2 fuel pellets [4-11].
These include U-N-Si fuel pellets, SiC cladding, and U3Si2 fuel pellets. These fuel materials
are selected to improve thermal conductivity, mechanical strength and fission product retention. Currently, measurements of these properties are a field of active investigation [6,8-11]. The impact of the fission environment on thermal conductivity and fission product retention in UO2 is available in the literature, and has been widely investigated
experimentally and using first principles investigations [12-30]. However, the relationship between the microscale origin of these properties and fuel performance behavior is not fully understood [13,14,30]. For proposed accident tolerant fuels such as U3Si2, the impact of the
fission environment on the fuel performance response is less certain, as there are limited experimental and atomistic studies on these materials [31-39]. Specifically, the microscale effects of fission and the impact of fuel burn-up on properties which impact reactor fuel performance such as thermal conductivity is not well known for this fuel material [31,37].
materials [12,13]. Therefore, to ensure reliable and safe reactor operation over the fuel lifetime the effects of radiation on the fuel properties must be considered when selecting material candidates.
1.1.1 Fuel Performance Analysis
Modern nuclear fuel performance analysis is performed to determine the steady-state and transient behavior of nuclear reactor fuel rods. The US industry standards for steady-state and transient analysis of reactor cores using traditional UO2 fuel are FRAPCON [40] and
FRAPTRAN [41]. These tools simulate macroscale heat transfer and fission gas release during steady-state operation and transient (e.g. accident) scenarios. In these models, the microscopic properties of the fuel materials, such as thermal conductivity or atomic diffusion, are captured with semi-empirical relationships parameterized to experimental data. The effects of fission on fuel properties are also included in these semi-empirical relationships as a function of fuel burn-up [25,40].
Recently developed codes, such as BISON, attempt to better model the macroscale in-core fuel analysis utilizing the microscopic properties, obtained through the use of multi-scale modeling by coupling to the MARMOT code [42-44]. This modeling method has been made possible through modern advances in computational techniques and computer power. In this approach, the microscopic properties which affect macroscale performance are generated through a series of computational techniques suited to treat the scale of the problem. The size and time scales appropriate for the various computational techniques used in multi-scale modeling are illustrated as a flow diagram in Fig. 1.2. In general, fuel performance analysis follows “bottom-up” information traffic, such that the fundamental properties of the fuel materials are based on quantum mechanical and molecular dynamics techniques. Consequently, the accuracy of the data and phenomenological models utilized in meso-scale (10-7 m -10-4 m) and macro-scale modeling are limited by the predictive ability of
these nano-scale techniques [25].
from the highly non-equilibrium fission event and its subsequent impact on the micro and nanoscale properties are not well understood [12,13,25]. The microscopic aspects of fuel performance may be related to the intense fission environment by correlating the fundamental electronic structure (a quantum mechanical property) of the fuel to the macroscale fission effects and examining the impact of these properties on the evolution of the fission event.
Fig. 1.2. Length and times scales for computational techniques used in the multi-scale modeling method.
1.2 Fission Effects in Nuclear Fuel
enhance a multitude of ailments in a fuel material, including but not limited to, point defect formation, swelling, polygonization, creep, dislocation growth, and embrittlement [27,28,30,32-35,45-48]. The cumulative effect of any of these phenomena is to alter the thermodynamic and mechanical properties of the fuel over the fuel cycle; most importantly thermal conductivity and mechanical strength [16,30]. If fuel becomes embrittled, as is the case for the high burn-up structures formed around the edge of traditional cylindrical fuel pellets, the fuel may fail (i.e. crack) [30]. As radiation induced deterioration of thermal conductivity of the fuel progresses, the thermodynamic conditions under which the fuel may be operated safely changes, necessitating built in margin in reactor design and operation. Reactor safety and performance may, therefore, be postively impacted through better predictions and understanding of the fundamental origins of phenomena which are direct consequence of the fission environment, known as fission effects.
Fission effects occur on a size scale spanning the microscale to the macroscale. Macroscopic effects are typically quantified as the impact of fission on bulk properties, such as embrittlement, decrease in thermal conductivity, fuel densification or fuel swelling. These effects may in fact be correlated to the impact of fission on the micro-structural properties of nuclear fuel elements. These micro-structural effects include polygonization, recrystallization, void swelling, dislocation growth as well as many others. Polygonization is a process whereby the originally well crystallized grains of a nuclear fuel material become subdivided into thousands of submicron grains at high burn-up. This effect is driven by the growth and migration of dislocations within the grain structure. In contrast to polygonization, recrystallization, whereby the fission process may fuse small neighboring structure, results in the growth of grain size.
and recombination of point defects. The overall influence of fission on individual atoms can manifest in multiple important damage driving effects along the fission fragment path, including fission enhanced diffusion, the formation of ion tracks and fission-bubble resolution.
1.2.1 Fission Spike
As a result of the fission event and subsequent energy loss, temperature and pressure spikes develop in the atomic lattice in what is known as a “fission spike” [13,48]. The fission spike is the initiating phenomena for fission effects in a reactor, and includes the impact of energy loss to the electronic and atomic structure of the fuel material. Collisions with atomic nuclei, result in the production of primary knock on atoms (PKA). Subsequently, these PKA initiate high density collision cascades, which directly produce isolated defects and defect clusters in the atomic lattice of a nuclear fuel material. The evolution of this process is dominated by interactions between atoms, while contribution of energetic electronic excitations is expected to be less important. This phase of energy loss may be considered a source of atomic defects in solids.
The initial deposition of fission fragment energy may ionize electrons resulting in the production of delta rays. These delta rays slow down within approximately 10 fs through electron-electron scattering interactions, resulting in secondary excitations of the electronic structure. Subsequently, these secondary excitations transfer energy to the atomic lattice through electron-phonon interactions. The result of the energy transfer process is the generation of a thermal spike which consists of a high temperature molten core surrounded by a heated zone [49]. These spikes are a cylindrical zone centered about the fission fragment trajectory.
vacancies and interstitials. The consequence of fission damage following the annealing phase is either the emergence or absence of a latent track. These latent tracks may be defined as stable, disordered regions along the fission fragment trajectory.
1.2.2 Point Defects
Point defects due to fission occur primarily as a result of collision cascades initiated through the creation of PKA; however, isolated defects and defect clusters may also result from the thermal spike, but to a much less extent. Point defects are any defect resulting from the displacement of individual atoms or small clusters of atoms in an otherwise well crystallized grain. In general these defects are comprised of vacancies, the absence of an atom from its lattice site, and interstitials, the inclusion of atoms into non-regular sites in the crystal lattice [30]. Defects generated due to collision stopping, as predicted by Monte Carlo simulations, is on the order of several hundred thousand [13]; whereas point defects due to electronic stopping of fission fragments, as predicted by molecular dynamics, may be fewer than ten thousand. Fission induced mobility may prompt vacancies and interstitials from collision cascades to precipitate in to larger scale defects such as dislocations or voids. These point defects may therefore be regarded as the initial source of radiation induced damage and effects in nuclear fuel.
1.2.3 Thermal Spike
For temperature experienced in nuclear fission reactors the consequences of thermal spikes are found to be relatively athermal [12,13,49], suggesting that the temperatures in the vicinity of the fission fragment path are significantly greater than the bulk temperature of the crystal. Thermal spikes are described as having a molten core; however, local melting of a crystal through thermodynamic means may require sustaining a temperature at the melting point for times scales longer than the duration of the thermal spike [52]. Therefore, due to the short lived transient nature of the thermal spike, temperatures significantly beyond the melting temperature are required to a disruption of the atomic lattice.
1.2.4 Fission Enhanced Diffusion
Fission enhanced diffusion is a process whereby the high temperature fission spike promotes atomic mobility, and is the motivating phenomena for most fission effects [12-14,50-55]. Within the thermal spike, temperatures within several nanometers of the center, are expected to greatly exceed the melting temperature, such that atoms within this zone become mobile and migrate. As the thermal spike decays, this zone of mobile atoms recrystallizes with atoms occupying different lattice sites within a few nanometers of their origin. The occurrence of multiple fission spikes will cause the atoms to migrate a significant distance, on the order of 0.1-1 mm during the reactor core life. The displacement of atoms within the high temperature spike may lead to creation of defects during quenching [50,51].
diameter) compared to the high temperature core, a greater volume of atoms are influenced. Consequently, the heated zone may be expected to have a significant impact on the evolution of damage.
While it may be ambiguous from its name as to whether fission enhanced diffusion is an enhancement of pre-existing effect or in fact induced phenomena, the definition will depend on context. From the perspective of the thermodynamic behavior of the bulk nuclear fuel, the promotion of atomic mobility by the fission spike acts to enhance atomic diffusion, which would still occur in the absence of fission but to a much lesser extent. Nevertheless, atomic mobility caused by the thermal spike is an athermal process which occurs as a direct result of fission, and is therefore, in this sense, an induced phenomenon. Throughout the text promotion of atomic mobility due to fission may be referred to as both enhanced and induced depending on the perspective from which it is discussed.
1.2.5 Ion-Tracks
Latent ion-tracks may be defined as stable, disordered regions along a fission fragment or swift heavy ion trajectory. These tracks are presumed to be the result of rapid quenching of the high temperature ‘molten’ core of a thermal spike. Tracks may be continuous along the ion trajectory or may be discontinuous, with crystalline regions interspersed between longer lengths of disordered track regions [49]. The formation of these tracks is typically more prevalent in insulator materials than in metals; however, in either case it has been observed that the incident ion should exceed a threshold rate of energy loss to the electronic structure, specific to the material. In metallic materials the threshold electronic stopping is nearly an order of magnitude greater than in insulators [57].
Fortunately, in UO2 the threshold for the formation of tracks in bulk crystal is 29
keV/nm [58,59], which is greater than the maximum expected stopping power for fission fragments. Surface effects, however, may impact the formation of ion-tracks, as has been observed in UO2 where surface tracks are observed as the result of fission [60]. In this case
in the same manner as in bulk crystal resulting in local crystal deformation or sputtering effects which could result in a track [48,60].
1.2.6 Fission-Bubble Resolution
As a result of fission, gases may be formed as fission products which subsequently migrate to voids with the crystal structure, forming bubbles over a protracted period of time. Fission bubble resolution is a phenomena whereby the passage of a fission fragment near a fission gas containing void in nuclear fuel is broken apart, causing the fission gas atoms to be dispersed within the crystal matrix of the fuel [12,13,61]. This phenomenon results from fission enhanced diffusion within the proximity of fission spike. The increased mobility due to the high temperatures and pressures of the thermal spike may result in the injection of crystal atoms into the fission bubble, resulting in the destruction of the bubble. The resolution of fission gases in nuclear fuel has the impact of limiting the effects of swelling.
1.2.7 Swelling
Swelling is the increase in the volume of nuclear fuel due to the accumulation microscopic and nanoscopic damage. Point defects created in the fuel crystal exert pressure and cause the crystal volume to increase. These point defects may result in the formation of pores, or tiny voids, within crystal grains. Alternatively, vacancies may precipitate to into inter-granular voids, increasing the fuel volume and escalating the risk of PCMI or other relate modes of fuel failure. Void swelling occurs due to the growth of pores within the grain structure, in contrast to the macroscopic effect of densification which results from the collapse of inter-granular pores. Inter-granular and intra-granular pores act as accumulation sites for fission gases, such as krypton and xenon. The accumulation of these gases results in high pressures, especially in smaller pores, which drive the swelling of the fuel. Fission-bubble resolution reduces this effect by re-incorporating the fission cases into the crystal structure.
1.3 Fundamental Fuel Properties and Fission Effects
The degree to which fission effects will impact the safety of the core is related to radiation resistance, i.e., the ability of a material to resist the accumulation of radiation induced damage. Experimental evidence has shown that fission damage varies in degree depending on the type of material being irradiated. Metallic fuels such as uranium carbide (UC) and uranium nitride (UN) tend to be much more susceptible to the effects of fission induced swelling than uranium dioxide, an insulator fuel. The magnitude of fission induced swelling has been experimentally determined in the these materials and is shown in Fig. 1.3 [12,13,62,63].
Fig. 1.3. Effect of fission dose on swelling in nuclear fuels [12,13,60,61]. The magnitude of swelling for UN, UC, and UO2 is directly correlated to the thermal conductivity.
Upon examination of the thermal conductivities of UO2, UC, and UN it may be observed
selection of fuel strictly based on thermal conductivity may result in poor long term performance. Alternatively a fuel which has a lower thermal conductivity but greater radiation resistance may be a more reliable candidate for nuclear fuel. Despite its low thermal conductivity for reactor temperatures, UO2 is currently the most widely used fuel type in the
world, due in part to its resistance to radiation compared to the metallic fuels [12,66].
1.3.1 Fission Enhanced Diffusion and Electronic Structure in Nuclear Fuel
Radiation resistance in a fission environment may be linked to fission enhanced diffusion, a mechanism which may be correlated to thermal conductivity. Comparisons of the degree of recovery of irradiated UC and UN fuel to that of UO2 have demonstrated that
defect annealing during fission was less pronounced in these fuels [12-14,63]. Futhermore, the degree of fission bubble resolution has been found to be significantly greater in UO2 than
fuels such as UC and UN, which has implications for fuel swelling [12,66].
These observations are theorized to be correlated to fission enhanced diffusion, particularly the mobility of uranium interstitials [12]. Due to mass disparity between uranium and the anions in all ceramic fuels, the ability for structure restoration relies on the mobility of uranium within the fuel matrix following fission. In the UO2, fission enhanced mobility of
uranium is found to be significant [13,14,53,66]. By contrast, the occurrence of fission in other uranium based fuel materials such as UN or UC is not observed to produce diffusional behavior of a similar magnitude.
This enhancement of uranium diffusion (upon fission) in UO2 can be linked to its
electronic structure, which represents that of an insulator as opposed to the largely metallic character of UC and UN. Table 1-1 illustrates the correlation between electronic strucuture, thermal conductivity and fission enhanced diffusion coefficient of uranium for UN, UC and UO2. In addition, data is listed for ZrO2, which represents another insulating material [65].
enhanced diffusion, and by extension radiation resistance, is directly linked to the ability of a material to transport energy through the lattice [12,13].
Table 1-1. Correlation of electronic structure to thermal conductivity and fission enhanced diffusion of uranium. For UO2 and ZrO2 the size of the band gap (Eg) is given. The values of the thermal conductivities are listed for a
temperature of 1000 oC.
Material Material Type [18,63,64,66] Fission Enhanced Diffusionκ [W/m/K] [13,14,51-53]
UN Metal 24 weak
UC Metal 20 weak
UO2 (E Insulator
g = 2eV)[22] 3 significant
ZrO2 (E Insulator
g = 6eV)[65] 2 significant
1.3.2 Correlation between Electron-phonon and Fission Effects
Insulators and semi-conductors, unlike metals, have a band gap in their electronic energy structure. This is the case for the ceramic UO2 fuel versus the more metallic behaving UC
A higher electron-phonon coupling and lower thermal conductivity in gapped materials compared to metals suggests a greater localization and slower dissipation of energy along a fission fragment path. This localization of energy may allow for enhanced local disordering of the crystal lattice and thus may explain higher fission enhanced diffusion. Furthermore, a threshold energy localized to a small area may also lead to permanent deformation of that region resulting in the formation of an ion track as observed in UO2 [56,57]. Thus
localization of energy in gapped materials offers a mechanism for fission induced annealing through fission enhanced diffusion while also making insulators susceptibility to fission track formation.
1.4 Fission Fragment Modeling
In this work, modeling techniques were developed to examine fission spikes using molecular dynamics (MD) simulations. Utilizing these models the impact of electronic structure, i.e. e-p coupling, on fission enhanced diffusion and ion track formation was explored. Furthermore, electronic structure was correlated to radiation resistance through simulations of fission spikes with latent ion tracks. A formal theory relating e-p scattering to electronic structure was then developed using first principles modeling to generate inelastic e-p scattering cross-sections. Subsequently, a more advanced energy transport model, which utilizes e-p scattering cross-sections as a fundamental input, was devised and demonstrated for applications to the simulation of fission spike.
The general process for generation of data and simulation of the fission spike in UO2
used in this work is illustrated as a flow chart in Fig. 1.4. The modeling of the fission fragment energy deposition and subsequent evolution of the fission spike begins with the independent particle Monte Carlo simulations of the fission fragments in UO2 and their
delta-ray energy deposition may be utilized as inputs to molecular dynamics simulations, which may then predict the evolution and impact of the fission spike in UO2.
Fig. 1.4. Flow chart of simulation process for the modeling of fission fragment energy deposition and evolution in UO2.
The basic physics of scattering theory and fission fragment energy deposition will be presented in Chapter 2. The theory and modeling of the slowing-down and thermalization process of fission induced delta-ray will also be presented. Subsequently, first principles calculation of electron-phonon scattering cross-section will be presented in Chapter 3. In this case the electron-phonon interaction will be presented as a solid-state property of nuclear fuel materials. In Chapter 4 modeling of the evolution of fission fragments will be discussed. In this case the phenomena will be simulated using a traditional two-temperature model and a more predicted multi-group model developed in this work. The latter method utilizes the results of delta-ray modeling and electron-phonon cross-section calculations. A path forward for further development of the predictive model developed in this work will be discussed in Chapter 5.
Monte Carlo simulation:
Fission fragment and delta rays evolution in UO2
Scattering Cross-sections: inelastic electron-phonon interactions in UO2
Molecular Dynamics Simulation:
CHAPTER 2 Fission Fragments Physics
Upon exposure to neutrons, the uranium nuclei in nuclear fuel can fission resulting in the release of over 200 MeV of energy and the deposition of fission fragment energy directly in the fuel. The fission process results in the production of two fission fragments with a total kinetic energy of approximately 170MeV [70]. The deposition of this energy causes a high temperature fission spike within the fuel matrix, which may be disruptive of the atomic lattice [13,14,48,53,58,60]. The fission event, therefore, represents the initiating and driving event of radiation effects in nuclear fuel.
2.1 Radiation Energy Loss and Range
Charged particle radiation, such as fission fragments or other swift heavy ions (ions with energies > 1MeV/amu), may lose energy in a material through various interaction channels. The three primary interactions for charged particles with energies less than coulomb barrier of nucleus (e.g. fission fragments, delta-rays, ect.), are scattering with atomic nuclei, inelastic scattering with the electronic structure, and the emission of radiation (e.g. Bremsstrahlung). The deposition of particle energy in a material resulting from these interactions can be expressed by the stopping force [12,71,72],
d d d d
d t e d n d r
E E E E
x dx x x
− = − + − + −
, (2.1)
where (-dE/dx)t is the total energy loss per unit path length, (-dE/dx)e is the loss due to
inelastic interactions between the fission fragment and electronic structure, (-dE/dx)n is the
loss due to interactions with atomic nuclei, and (-dE/dx)r is the radiative loss. Radiative
losses are a relativistic effect, and are negligible for fission fragments [13,72].
a medium, where flux is the rate at which the particles pass through the boundary of an arbitrary volume (e.g. an infinitesimally small volume).
In general the double differential scattering cross-section for a particle of mass m may be estimated within first order time-dependent perturbation theory as [73-77],
(
)
2
2 2
2 ,
' '| δ
2
m E
p V E E
E λ E
λ λ
σ λ λ ω
p ′
′
∂ = 〈 ′− +
′
∂Ω∂
∑
k k ,
(2.2)
where k and k’ are the initial and final momentum of the particle. The strength of the scattering interaction is represented by the effective scattering potential, V. The scattering system, which is composed of individual scatterers, is initially in a composite quantum state. As a consequence of the scattering event the scattering system (i.e. scatterers) transitions from initial state, λ, to a final state, λ’; exchanging an energy of ħω with the incident particle. This representation of the cross-section is known as Fermi’s Golden Rule [74,78], and is the time-dependent extension of the first Born approximation. The parameters E and E’ are the initial and final particle energies, and their ratio, E E' , is a comparison of the current of scattered particles to that of incident particles. The summation over all initial states is temperature dependent and therefore considers the fundamental statistics of the particles, (i.e. bosons and fermions), where pλ is the probability of occupation of the state λ. This
occupation number includes any degeneracy in the permitted energy levels of the scatterer (e.g. lattice vibrations of atoms, electrons).
2
4π
d d d
d sc
sc E sc
E N W W
x W
σ ∞
−
∂
− = Ω
∂Ω∂
∫
∫
, (2.3)where sc indicates the specific scatterer (e.g. electrons, atoms). For conciseness, this formulation uses the energy transfer, W, as opposed to the initial and final energies, E and E’
respectively. Throughout the text the energy transfer will be defined as W E E= −' . Utilizing the total stopping force the particle path length, x, may be estimated as,
0
E
t
dx
x dE
dE
= ⋅ −
∫
. (2.4)This path length is not equivalent to the particle range in the material (e.g. nuclear fuel), which may be defined as the displacement within the material [71,72]. The stopping force as estimated by Eq. (2.3) is integrated over all angles and energies and therefore does not considered changes in particle direction or the impact of the statistical nature of scattering on energy loss. These deviations in direction of the particle trajectory or energy loss rate are known as straggling.
In the case of fission fragments, straggling has only a small impact on the range and energy loss, especially compared delta-rays and electrons where the effects of straggling are significant. This suggests that in the context of the fission event in nuclear fuel, that the initial energy loss of the fission fragment may be appropriately be described by CSDA, whereas the evolution of the delta-rays and secondary electrons must be described using methods which consider deviations in energy loss and particle trajectory. In the following sections scattering theory will be formally introduced and the applications of scattering and energy loss to fission fragments, delta-rays and thermalized electrons will be discussed.
2.1.1 Scattering Theory Preliminaries
![Fig. 1.1. The fuel assembly of a pressurized water reactor (PWR) [3]. The assembly is composed of fuel rods that are in turn composed of UO2 fuel pellets](https://thumb-us.123doks.com/thumbv2/123dok_us/1236423.1156162/24.612.175.457.404.646/assembly-pressurized-water-reactor-assembly-composed-composed-pellets.webp)
![Fig. 3.16. Atomic PAW pseudopotentials for uranium and oxygen [117,119]. The pseudopotentials shown include only the Hartree and local parts](https://thumb-us.123doks.com/thumbv2/123dok_us/1236423.1156162/98.612.146.473.75.309/atomic-pseudopotentials-uranium-oxygen-pseudopotentials-shown-include-hartree.webp)