5628
SUPERVISED CLASSIFICATION AND IMPROVED
FILTERING METHOD FOR SHORELINE DETECTION
1FARIZUWANA A. ZULKIFLE, 1 ROHAYANTI HASSAN, 1 RAZIB M. OTHMAN, 2AMIRA BIBO
SALLOW
1 Department Software Engineering, Universiti Teknologi Malaysia, 81310 UTM Skudai Johor, Malaysia 2 Computer Science Dept., Nawroz University, Computer, and I.T. College, Duhok, Iraq
Email: 1 [email protected]
ABSTRACT
Shoreline monitoring is important to overcome the problems in the measurement of the shoreline. Recently, many researchers have directed attention to methods of predicting shoreline changes by the use of multispectral images. However, the images being captured tend to have several problems due to the weather. Therefore, identification of multi class features which includes vegetation and shoreline using multispectral satellite image is one of the challenges encountered in the detection of shoreline. An efficient framework using the near infrared–histogram equalisation and improved filtering method is proposed to enhance the detection of the shoreline in Tanjung Piai, Malaysia, by using SPOT-5 images. Sub-pixel edge detection and the Wallis filter are used to compute the edge location with the subpixel accuracy and reduce the noise. Then, the image undergoes image classification process by using Support Vector Machine. The proposed method performed more effectively and reliable in preserving the missing line of the shoreline edge in the SPOT-5 images.
Keywords: Shoreline Detection, SPOT-5, Sub-Pixel Edge Detection, Support Vector Machine
1. INTRODUCTION
The shoreline is usually defined as the intersection of the land with the water surface [1]. Thus, knowledge of the shoreline position is the basis for overcoming shoreline problems, measuring the shoreline and characterising the land and water resources [1, 2, 3]. However, extracting the water bodies and land is time consuming and difficult when using the traditional approaches. Recently, many researchers have directed attention to the prediction of shoreline changes by using satellite images. Remote-sensed images are often corrupted by random variation intensities or have low contrasts. For example, in the images with sedimentation, shadows or clouds problem, the image may appear in a low contrast condition. AlFugura et al. [6] developed a method for the detection and extraction of the coastline using single radar images. They used the Lee Sigma filter to remove speckles and a median filter for land and water enhancement. The Lee Sigma filter is effective in speckle filtering [7]. However, while researchers commonly use the speckle filter method, the resulting images may lose image
information [6]. Besides the Lee Sigma and speckle filter, the Wallis filter is a special filter which enhances the image contrast and suppresses noise at the same time [8]. The method developed by Zhu et al. [7] improved the useful information and precision of river change detection by using Wallis filter. However, research by Chang et al. [9] showed disadvantages in edge detection, with some long lines in edge detection have been discarded.
According to Goncalves [4], sub-pixel precision can be used to extract the position of the shoreline. Therefore, it may be a useful tool for monitoring changing shorelines. However, there are some issues in tidal ranges that can be improved during the ebb tide. Moreover, sub-pixel edge detection cannot perform well for object corners [5]. Table 1 summarizes the issues that occur in satellite image in shoreline detection.
5629 the image undergoes image classification process by using SVM. Therefore, extraction of the land and water can be processed better.
This paper is organized as follows. In section 2, the study area is described. In section 3, the proposed method is presented. The experimental results, evaluation and analysis are briefly in section 4. Finally, our work of this paper is summarized in the last section.
2. STUDY AREA: Tanjung Piai Ramsar site
The study area is located at 1.2661° N, 103.5108° E (Figure 1) in the Point district, State of Johor, Malaysia. It was designated as a Ramsar site in 2003 and is managed by the Johor National Parks Corporation. Tanjung Piai is not only famous for its coastal mangrove reserve, including an 8 km-long strip of mangrove swamp but is also famous as a hotspot for bird watchers during the migratory season. Moreover, the mangrove reserve is especially important for the protection of habitats from sea-water intrusion and coastal erosion. The average annual rainfall is from 2,000 to 2,500 mm in an even distribution throughout the year (WIMP, 1999). Tanjung Piai has a relative humidity of 90% and temperature from 24 °C to 32 °C. The cloud cover ranges from 50% to 80% and is observed to be constant over the year.
3. METHOD
The flowchart of the proposed method as depicted in a dotted red box in Figure 2. In Phase one, the SPOT-5 images are clipped into the scenes of interest (SOI) (four SOI were chosen for our research experiment). The images are then processed using the HE method. In the HE process, the NIR band is enhanced. After the NIR band has been equalised, the adjusted NIR is combined with the other colour composites. This method enhances the contrast and brightness of the water and land boundary. Next in Phase two, the combination of Sub-pixel edge detection and Willis filtering to improve random intensity noise and missing lines cues. Finally, in Phase 3, the results of the histogram, and accuracy are classified. The accuracy values were calculated in order to prove the results of the analysis in
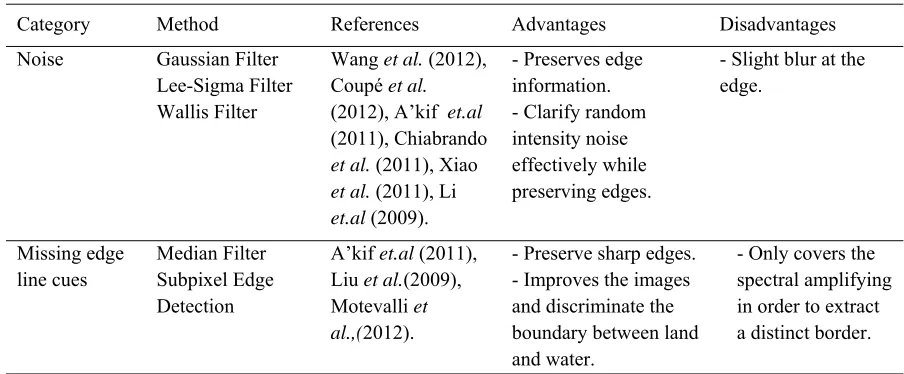
Table 1: Issues On Satellite Image In Shoreline Detection
Category Method References Advantages Disadvantages
Noise Gaussian Filter Lee-Sigma Filter Wallis Filter
Wang et al. (2012), Coupé et al. (2012), A’kif et.al (2011), Chiabrando et al. (2011), Xiao et al. (2011), Li et.al (2009).
- Preserves edge information. - Clarify random intensity noise effectively while preserving edges.
- Slight blur at the edge.
Missing edge line cues
Median Filter Subpixel Edge Detection
A’kif et.al (2011), Liu et al.(2009), Motevalli et al.,(2012).
- Preserve sharp edges. - Improves the images and discriminate the boundary between land and water.
- Only covers the spectral amplifying in order to extract a distinct border.
Figure 1: Topography map area in Tanjung Piai, Malaysia, Source: The Department of Survey and
5630 determining the shoreline changes. The featured processed images are overlaid. As a result, shoreline changes can be detected. Classes extracted in the classification process were vegetation, sea, soil and developed areas.
SPOT satellites have been supplying high-resolution, wide-area optical imagery since 1986 [15]. We chose SPOT-5 images for our research. The imagery was acquired between 2008 and 2011. The SPOT-5 data were made available for use in this research by the Malaysian Remote Sensing Agency. The data were based on Level 2A and had the same radiometric corrections as applied in the Level 1A product, and were georeferenced to a UTM WGS84 projection. Multispectral images and panchromatic images in SPOT-5 images have to
be pan-sharpened to merge and create a single high-resolution colour image. The multispectral images have a resolution of 10
meters, while the panchromatic images have a resolution of 5 meters. Before the images can be processed, the images need to be accurately georeferenced. For the purposes of this study, four scenes were chosen based on the problems to be analysed (Table 1). The first scene was clipped based on a scene that had a cloud cover. The second scene had a hazy image while the third scene had a shoreline with sedimentation. The fourth scene had a shoreline with a shadow of a cloud. These scenes were chosen to show that the NIR channel plays an important role in shoreline detection. Three bands were chosen from the SPOT-5 images, namely, NIR, red and green. This was referred to as the false colour composite and this combination of colour was suitable for vegetation, land and water detection.
3.1 The Improved Filtering Method
From the remote-sensed images, four scenes were chosen based on the basic issues being investigated. We examined the images for combinations of three bands; NIR, Red and Green band. In the first band, the NIR band was used; in the second band, the red band was chosen; and in the third band, the green band was used. Thus, due to the presence of surface reflectance in the image, the NIR band was enhanced by using the HE algorithm (NIR–HE)[16]. Then, the band was
Table 2: Scenes of interest.
Scene12008 Scene22009 Scene32010 Scene42011
Cloudy Haze Sedimentation Shadow, Cloudy
Wallis filtering
Image Filtering
Canny edge is used for shoreline edge detection Sub-pixel edge detection
filtering
Maximum and Minimum Threshold Value
Adjusted image
Image processing
Pre-processing
Haze removal
NIR HE method
Image classification Support Vector Machine
Evaluation & Analysis Histogram & Accuracy
Result Analysis
Overlay SPOT-5 images to estimate shoreline
changes
Shoreline changes map
Phase 1 Phase 2 Phase 3
5631 combined by transforming the adjusted NIR band in the channel of the image. Therefore, this image was called the false composite image.
The normalized difference water index (NDWI) was used to extract land and water from the SPOT-5 images [2,12]. There were two bands in this index. The extraction of the shoreline at sub-pixel level is based on the water and land in the NDWI images. The NDWI is expressed as follows:
NDWI= (Green – NIR) / (Green + NIR) (1) Where: NIR indicates the reflectance radiated from NIR band, and Green represents reflectance radiated from the visible green band. The presence of the green wavelength maximizes the reflectance of water, while the presence of the NIR wavelength gives high reflectance in land and vegetation. The line in an image is extracted based on the pixel scale. The threshold is obtained as the intersection between the water and land. The separation of the water and land occurs when the adjusted NIR band intensity gradient around the edge pixel level value of shoreline is at its maximum. This method initially assumes that the extraction could be approximated by straight lines in the neighborhood of each shoreline pixel. Therefore, the shoreline pixel distribution of the water and land neighborhood affects the correct determination of the shoreline. In addition, integration of false color composite produced a SPOT-images with red colour which representing a healthy vegetation area. The NDWI adjusted was performed as follows:
Step 1: Calculate the histogram of the SOI image. Step 2: Extract Green and NIR band from SOI image.
Step 3: Apply NIR-HE method to the NIR band. Step 4: Calculate the histogram of the image. Step 5: Based on NDWI adjusted equation, the separation of the water and land occur.
NDWIadjusted=(Green–NIRadjusted)/(Green +NIRadjusted)
(2) Step 6: Repeats Step 1-5 for all SOI.
Image filtering can enhance and smooth the remote-sensed images. Thus, the edge enhancement of shorelines is very useful in remote-sensed images. Edge enhancement is suitable in detection lineament and structural details in geological studies. After the land and water in the SPOT-5 images have been separated by the sub-pixel edge detection method, Wallis filtering will take place. The aim of this method is to map the gray scale mean and variance of the image into the given gray scale mean and variance [14]. Moreover, Wallis filtering is a useful method
to enhance the line in SPOT-5 images as it gives better surface boundary discrimination. The combination of sub-pixel edge detection and Wallis filtering suppresses the noise while preserving the image edge. Thus, it enables the images to be matched with a great degree of precision and enables the shoreline to be detected effectively. In this study, edge detection was applied on the SPOT-5 images by using Canny edge detection to detect the shoreline. The range of the threshold used was from 0.01 to 0.09. After the image underwent the filtering process, the image was smoothed using the Gaussian filter. The Canny edge detector was used to produce a sharp and smooth edge. The best threshold was 0.03 where the smooth and sharp edges can be identified.
3.2 Classification using Support Vector Machines
Support Vector Machine (SVM) classification is considered to be most suitable and favorably used as classification tool when relatively small samples are taken into consideration [10, 11].Therefore, higher accuracy and minimal error will be achieved when training data were extracted.
Classification of the initial image is used to determine the agreement between the selected reference materials and the classified data. Through this study utilize SVM for image classification. Identical and testing pixels were used to minimize evaluation bias and to perform an individual search for ideal parameters. The SVM method performed well in separating the vegetation and sea classes. Therefore, SVM based in the radial basis kernel type with a suitable threshold of 0.07 was used to produce the classification results for accuracy values. The results of the classification which have been separating into four class; vegetation areas indicated by the red color, water indicated by the blue color, developed areas indicated by the green color and natural ground areas indicates by the yellow color.
4. EVALUATION AND ANALYSIS
5632 Thus, we used four SOI of SPOT-5 images which were evaluated in four different years: 2008, 2009, 2010 and 2011. These SOI were clipped based on the problem of the image. In each year, the images have different types of surface reflectance problems such as the presence of cloud, haze, sedimentation, and shadow.
After the surface reflectance has been removed, the extraction of the shoreline at the sub-pixel level is based on the water and land in the false colour composite image. Before this method was used, the SOI was extracted by using NDWI. It is useful to use NDWI because this is the effective way to separate the land and water before the edge of the shoreline can be detected. Meanwhile, this index uses the green wavelength to extract the reflectance of water while the NIR wavelength is used to extract
the land. Then, the sub-pixel edge detection will take place whereby the line in each SOI is extracted based on the pixel scale. The threshold is obtained as the intersection between the water and land. The separation of water and land occurs when the adjusted NIR band intensity gradient around the edge pixel level value of the shoreline is at its maximum. This method initially assumes that the extraction could be approximated by straight lines in the neighborhood of each edge pixel. Hence, the edge pixel distribution of the water and land neighborhood affects the correct determination of the shoreline. In Table 2, the land neighborhood corresponds to the water. The results show that the images were corrected with
a high level of accuracy and the edge of the shoreline was extracted effectively.
Furthermore, Table 3 shows the results of edge detection using different filtering method over the four years. The median filtering, Gaussian filtering, Weiner filtering and Wallis filtering with sub-pixel edge detection (proposed method) have been evaluated and compared. The best threshold was set at 0.03. From Table 3, it is shown that proposed method was able to better detect the edge with almost noise was removed.
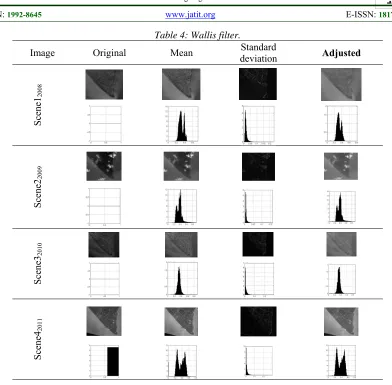
In addition, the shape of the histogram value showed that the Wallis filtering enhance the image and reduce the noise by sharpening the image boundaries. As tabulated in Table 4, the Wallis filter preserved the missing line with better capability in removing the noise. Almost all of the noise was removed. The Weiner filter had the lowest result due to the missing lines. It was expected that changes had occurred due to the decreased mangrove distribution based on the ground truth survey shown in Figure 3. The
Table 3: Edge Detection Using Different Methods
Filter Scene12008 Scene22009 Scene32010 Scene42011
Cloud Haze Sedimentation Shadow, Cloud
Median
Gaussian
Weiner
Proposed Method
Table 4: Sub-Pixel Edge Detection.
Scene12008 Scene22009 Scene32010 Scene42011
Cloudy Haze Sedimentation Shadow, Cloudy
Edges were detected and almost all of the noise was removed
Lowest edge detection
Missing edge detection
5633 pattern of the shoreline from 2008 to 2011 in Tanjung Piai in Figure 4 showed dramatic change.
A good performance is achieved due to the Wallis filter applies a local adaptive contrast enhancement which is best designed for a grayscale image. First, the SOI was converted to the grayscale image from the false colour images. Then, the brightness of the SOI was adjusted according to the values of the local areas. Next, the specified values of the mean and standard deviation were specified into the target values as shown in Table 3.
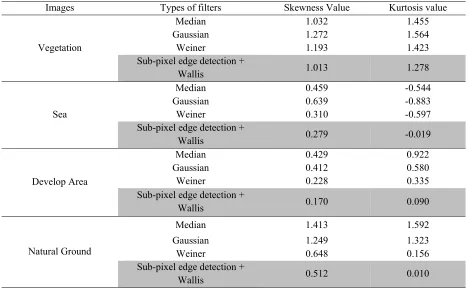
Skewness was important to the analysis as it revealed non-normal distribution after the enhancement and these features were incorrectly extracted. As depicted in Table 5, four scene of interest examined all had distributions that were positively skewed. All the features classes examined had distributions that were positively skewed. However, sea shown negatively skewed. The negative value was expected due to random intensity
noise. Meanwhile, the kurtosis measures the width of the shoulder of the distribution and can be used as a sharpness metric. A normal distribution will have kurtosis value of zero and all the kurtosis values for all features fell in the normal range. Overall, the highest kurtosis value, -0.019 was for the sea because the sea had the highest frequency content because they had edges and corners. Generally, the enhancement provided importantly good textural information.
As described in Table 6, classification method using SVM has been tested on the enhanced image which it can be observed that a success rate of more than 90% of accuracy. This shows that proposed method produced better results when classified with four class features, namely, vegetation area develop area, sea and soil. In conclusion, SVM produced desirable results, had high performance and could ensure accurate shoreline detection.
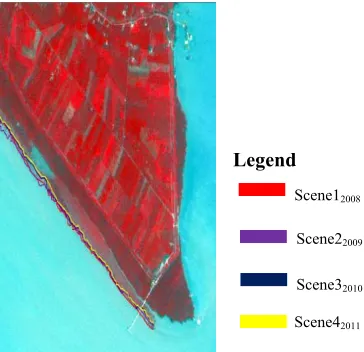
On the other hand, the shoreline changes not only affected the mangrove population but also the ecology in the mangrove area. Therefore, shoreline changes are an issue with a significant impact on the Tanjung Piai areas which is listed as a priority site for national eco-tourism. It was expected that changes had occurred due to the decreased mangrove distribution based on the ground truth survey as depicted in Figure 4. The pattern of the shoreline from 2008 to 2011 in Tanjung Piai showed dramatic change. Hence, the shoreline changes not only affected the mangrove population but also the ecology of the
mangrove area. Therefore, shoreline changes are an issue with a significant impact on the Tanjung Piai areas which is listed as a priority site for national eco-tourism. Thus, the mangrove in Tanjung Piai needs to be conserved due to its important role in protecting the shoreline. Figure 4 shows the results of shoreline detection over the four years.
Figure 4: Shoreline changes from 2008 to 2011
Scene12008
Scene22009
Scene32010
Scene42011
Legend
5634
Table 4: Wallis filter.
Image Original Mean deviation Standard Adjusted
Scene
12008
Scene
22009
Scene
32010
Scene
42011
Table 6: Classification accuracy (%) of four scenes
Scene12008 Scene22009 Scene32010 Scene42011
PA UA PA UA PA UA PA UA
Vegetation 74.07 74.07 100.0 83.33 89.71 87.14 85.19 85.19
Sea 84.52 84.52 87.21 98.68 86.36 89.41 90.48 91.57
Develop Area 9492 91.80 100.0 93.44 100.0 95.38 96.61 90.48
Artificial ground 71.05 75.00 71.43 100 89.29 96.15 84.21 91.43
Accuracy 82.55 92.75 91.06 89.79
Kappa 0.77 0.90 0.88 0.86
5635 5. CONCLUSION
The results of this research demonstrate that the improved filtering method can perform adequately as a shoreline detection tool using SPOT-5 images. The sub-pixel edge detection can be used to effectively separate the land and water, while the Wallis filter enhance the image and reduce the noise by sharpening the image boundaries. Although the Wallis filter has minimal errors in missing lines, it gave significantly better shoreline detection results than the other filter methods and used the SVM to classifying the data with higher values accuracy. However, we assumed that the selected four scenes has the problematic issues which are cloudy, hazy, sedimentation and shadow. For future works, we are currently experimenting the proposed method using several different type of satellite images.
6. ACKNOWLEDGEMENTS
The authors would like to acknowledge the Malaysian Remote Sensing Agency which provided SPOT-5 data and the Malaysian Government and Department of Survey and Mapping Malaysia (JUPEM) which provided
topography and gazettes relating to the Tanjung Piai area. Tanjung Piai Johor National Park staff provided useful information about the study site. Thanks are also expressed to the supervisory team for helpful discussions during this research. This research was supported by the MyPhD scholarship scheme of the Ministry of Higher Education Malaysia and the G-Heart scheme under the Gates Scholars Foundation. Also thanks to publication fund by Vot no: 4C097.
REFERENCES
[1] Maiti, S., and Bhattacharya, A. K. (2009). Shoreline change analysis and its application to prediction: A remote sensing and statistics based approach. Marine Geology, 257(1–4), 11–23.
[2] Kuleli, T., Guneroglu, A., Karsli, F., and Dihkan, M. (2011). Automatic detection of shoreline change on coastal Ramsar wetlands of Turkey. Ocean Engineering, 38(10), 1141– 1149.
[3] Pardo-Pascual, J. E., Almonacid-Caballer, J., Ruiz, L. A., & Palomar-Vázquez, J. (2012). Automatic extraction of shorelines from Landsat TM and ETM+ multi-temporal images with subpixel precision. Remote Sensing of Environment, 123(1), 1–11. Table 5: Statistical measure results
Images Types of filters Skewness Value Kurtosis value
Vegetation
Median 1.032 1.455
Gaussian 1.272 1.564
Weiner 1.193 1.423
Sub-pixel edge detection +
Wallis 1.013 1.278
Sea
Median 0.459 -0.544
Gaussian 0.639 -0.883
Weiner 0.310 -0.597
Sub-pixel edge detection +
Wallis 0.279 -0.019
Develop Area
Median 0.429 0.922
Gaussian 0.412 0.580
Weiner 0.228 0.335
Sub-pixel edge detection +
Wallis 0.170 0.090
Natural Ground
Median 1.413 1.592
Gaussian 1.249 1.323
Weiner 0.648 0.156
Sub-pixel edge detection +
5636 [4] Boak, E. H., & Turner, I. L. (2005). Shoreline
Definition and Detection: A Review. Journal of Coastal Research, 688–703.
[5] Goncalves, R. M., Awange, J. L., Krueger, C. P., Heck, B., and Coelho, L. dos S. (2012). A comparison between three short-term shoreline prediction models. Ocean & Coastal Management, 69, 102–110.
[6] Cheng, S.-C., and Wu, T.-L. (2005). Subpixel edge detection of color images by principal axis analysis and moment-preserving principle. Pattern Recognition, 38(4), 527– 537.
[7] Al Fugura, A., Billa, L., and Pradhan, B. (2011). Semi-automated procedures for shoreline extraction using single RADARSAT-1 SAR image. Estuarine, Coastal and Shelf Science, 95(4), 395–400. [8] Lee, J.-S., Lee, J.-S., Wen, J.-H., Ainsworth,
T. L., Chen, K.-S., and Chen, A. J. (2009). Improved Sigma Filter for Speckle Filtering of SAR Imagery. IEEE Transactions on Geoscience and Remote Sensing, 47(1), 202-213.
[9] Zhu, L., Zhang, J., and Pa, L. (2006). River Change Detection Based on Remote Sensing Image and Vector. First International Multi-Symposiums on Computer and Computational Sciences, IMSCCS ’06, 20-24 June 2006. Hanzhou, Zhejiang, (pp.188 – 191). NOAA.NOAA Shoreline Website [online]. http://shoreline.noaa.gov/glossary.html [Accessed September 2014]
[10] Brian W. Szuster, Qi Chen, Michael Borger, A comparison of classification techniques to support land cover and land use analysis in tropical coastal zones, Applied Geography, Volume 31, Issue 2, April 2011, Pages 525-532.
[11] Shao, Y. and Lunetta, R.S. (2012) Comparison of Support Vector Machine, Neural Network, and CART Algorithms for the Land-Cover Classification Using Limited Training Data Points. ISPRS: Journal of Photogrammetry and Remote Sensing, 70, 78-87.
[12]McFeeters, S. K. (1996).The use of the Normalized Difference Water Index (NDWI) in the delineation of open water features. International Journal of Remote Sensing, 17(7), 1425-1432.
[13]Chiabrando, F., Nex, F., Piatti, D., Rinaudo, F. (2011). UAV and RPV systems for photogrammetric surveys in archaelogical areas: two tests in the Piedmont region (Italy). Journal of Archaeological Science. 38(3): 697-710.
[14]Xiao, H., Wu, Q. S., Feng, N. (2011). Fast Wallis image enhancement algorithm with CUDA. Journal of Shenyang University of Technology. 3(1): 1-11.
[15]Airbus Defence and Space (2014). SPOT Satellite Imagery [online]. Available at http://www.astrium-398 geo.com/en/143-spot-satellite-imagery [Accessed September 2014].